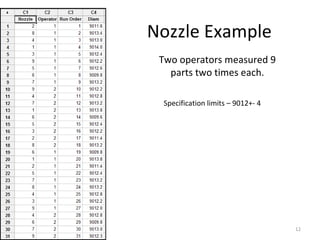
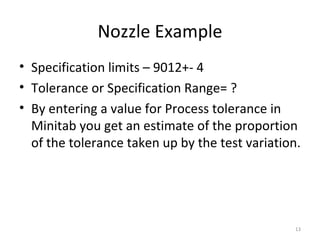
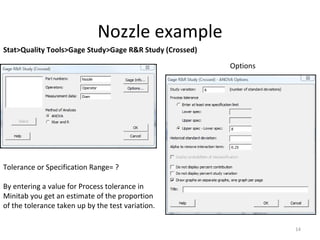
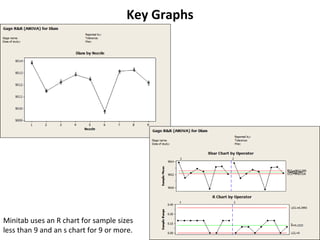
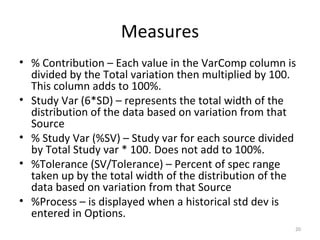
Presented by Arved Harding Prepared by Arved and Wayne Ketron ASQ Tutorials  Jan 15, 2009 Variable  Gage R&R in Minitab
Who is Arved J. Harding, Jr.? Christian United Methodist Family Man Wife + 2 boys Employee of Eastman Chemical Company for 20 Years  (5/10/08) M.S. in Statistics, Va. Tech, 1988 Active volunteer and leader in the Northeast TN Section of the American Society for Quality (ASQ) Hillbilly Graduate of UVA College at Wise - B.S. in Math, 1985 Native of Wise, VA Currently in Blountville, TN a Harding Associate Statistician 18.5 years experience in supporting Polymers and PET R&D, Technical Service and Manufacturing as well as physical and analytical testing labs. 1.5 years supporting organizations related to Adhesives, Coatings and Cellulose Esters
What are we going to cover? What is the purpose of a Variable Gage R&R? Repeatability vs. Reproducibility Generating a Variable Gage R&R study in Minitab How to define part or process tolerance Part selection for the study Analysis of Gage R&R in Minitab Interpreting the variable GRR graphical and statistical tools
What Can We Get Out of a Variable Gage R&R? Measure of the % of variation in our process that is caused by our measurement system Compare measurements within and between operators Compare measurements within and between two (or more) measurement devices Provide criteria to accept new measurement systems (consider new equipment) Evaluate a suspect gage Evaluate a gage before and after corrective action (training, repair, replacement, etc) Determine true process variation Ensure that the measurement system is measuring what we want before process improvement Avoid shipping defects to our customers Avoid scrapping perfectly good parts
Variable Gage R&R in a Nut-shell We want to characterize variation from the process We usually estimate this with part-to-part variation Can use an estimate from historical data We want to estimate the test variation Repeatability and reproducibility We want to know if the test variation is “good enough” for the application Ratio of Process Variation to Test Variation (% Study Variation) Ratio of Spec Range to Test Variation (P/T Ratio or %Tolerance)
Typical Recommended Gage R&R Study Select a product this study will represent Collect 10 parts that represent the expected variation you would see in your process. This could include out of spec parts if this is expected. Mistakes include: Collecting parts that are too close together and do not represent the total variation thus making the test variation look worse than it is. Collecting parts across different products thus making the test variation look much better than it is.
Typical Recommended Gage R&R Study Select 3 analysts and have them measure the 10 parts 2 times at random. 60 total measurements Are these numbers magical? Can I use more analysts, parts or repeats?
R&R According to Wikipedia R&R  (magazine) , a music trade magazine  R&R (Military) , acronym for Rest and Recuperation or Rest and Recreation  R&R (EastEnders) , a fictional nightclub in  EastEnders   Rock & Republic , an American designer jeans company  Repeatability and reproducibility Rescue and resuscitation "Read and review", a term used in fanfiction by authors looking for feedback "Recent and relevant", a requirement for those training teachers in the UK that they had experience teaching in a school that was both recent and relevant.;
What Mork Says When He Laughs? Humor. Ar! Ar!
R&R Repeatability  – variation due to the measuring device, or the variation observed when the same operator measures the same part repeatedly with the same device. Reproducibility – variation due to the measuring system, or the variation observed when different operators measure the same part using the same device.
Gage R&R Crossed Helps assess how well the measuring system can distinguish between parts Whether the operators can measure consistently within and between themselves Assesses test variation Crossed – every part is measured by every person Balanced – the measurement is done the same number of times by each person on each part.
Nozzle Example Two operators measured 9 parts two times each. Specification limits – 9012+- 4
Nozzle Example Specification limits – 9012+- 4 Tolerance or Specification Range= ? By entering a value for Process tolerance in Minitab you get an estimate of the proportion of the tolerance taken up by the test variation.
Nozzle example Stat>Quality Tools>Gage Study>Gage R&R Study (Crossed) Options Tolerance or Specification Range= ? By entering a value for Process tolerance in Minitab you get an estimate of the proportion of the tolerance taken up by the test variation.
Key Graphs Minitab uses an R chart for sample sizes less than 9 and an s chart for 9 or more.
Key Graphs
Graph of Variance Components
A Few Statistics
A Few More Statistics
Measures % Contribution – Each value in the VarComp column is divided by the Total variation then multiplied by 100. This column adds to 100%. Study Var (6*SD) – represents the total width of the distribution of the data based on variation from that Source % Study Var (%SV) – Study var for each source divided by Total Study var * 100. Does not add to 100%. %Tolerance (SV/Tolerance) – Percent of spec range taken up by the total width of the distribution of the data based on variation from that Source %Process – is displayed when a historical std dev is entered in Options.
Which Measure to Use? If the measurement system is used for process improvement such as reducing part-to-part variation, then %Study variation may be a better measure. If the measurement system is used to evaluate parts relative to specifications, then %Tolerance variation may be a better measure.
AIAG Guidelines %Tolerance and % Study Variation 10% or less – Acceptable 10% to 30% - Marginal 30% or greater – Unacceptable %Contribution 1% or less – Acceptable 1% to 9% - Marginal 9% or greater - Unacceptable
Number of Distinct Categories The number of distinct categories that can be reliably observed  s part  / s measuring system  * sqrt(2) Minitab truncates this value except when it is less than 1, in that case Minitab sets the number of distinct categories to 1. Number of categories Interpretation 1 The measurement system cannot discriminate between parts 2 Parts can be divided into high and low groups, as in attribute data 2<n<5 The test is likely not useful. >=5 The system is acceptable (according to AIAG) and can distinguish adequately between parts.
One More Chart – The Gage Run Chart
Another Example 3 operators measured 10 parts, two times each 60 total data points.  Notice that Pipe # is randomized within operator. Process Tolerance = 0.5mm If the parts do not cover the range of the entire process, the estimated variation from the data may not reflect the process variation, thus making the test variation “look” worse than it really is. Use a historical estimate of the variation is possible in this case. It is estimated that the standard deviation of the process is 0.078. Note that this includes test variation.
Gage Run Chart
Graphs
Operator * Pipe Interaction
Review the Statistics Notice % Process
Creating a Data Collection Worksheet Stat>Quality Tools>Gage Study>Create Gage R&R Study Worksheet Options
First 30 runs of the 60 run Design
Nested Studies Use this for Destructive tests with small batch sizes. Example – Slabs of Stainless Steel 9 slabs are randomly chosen from production. We’re assuming of course the 9 slabs represent the normal variation seen. This may not be true with only 9 selected at random. Randomly assign 3 slabs to each of 3 operators Each impact test is destructive but we can get 3 samples from each slab. We expect very little within slab variation, so testing 3 samples within a slab should be a good estimate of test variation.
Key Graphs
Gage Run Chart Note: To get this graph I had to rename the slabs all 1, 2 or 3.
Statistics on Slab
Warning Do not apply a variable gage R&R if your measurements use an attribute scale such as pass/fail, or a 1-5 rating. Consider an Attribute Agreement Study for this. That’s another seminar.
Questions????

Guagerr

  • 1.
    Presented by ArvedHarding Prepared by Arved and Wayne Ketron ASQ Tutorials Jan 15, 2009 Variable Gage R&R in Minitab
  • 2.
    Who is ArvedJ. Harding, Jr.? Christian United Methodist Family Man Wife + 2 boys Employee of Eastman Chemical Company for 20 Years (5/10/08) M.S. in Statistics, Va. Tech, 1988 Active volunteer and leader in the Northeast TN Section of the American Society for Quality (ASQ) Hillbilly Graduate of UVA College at Wise - B.S. in Math, 1985 Native of Wise, VA Currently in Blountville, TN a Harding Associate Statistician 18.5 years experience in supporting Polymers and PET R&D, Technical Service and Manufacturing as well as physical and analytical testing labs. 1.5 years supporting organizations related to Adhesives, Coatings and Cellulose Esters
  • 3.
    What are wegoing to cover? What is the purpose of a Variable Gage R&R? Repeatability vs. Reproducibility Generating a Variable Gage R&R study in Minitab How to define part or process tolerance Part selection for the study Analysis of Gage R&R in Minitab Interpreting the variable GRR graphical and statistical tools
  • 4.
    What Can WeGet Out of a Variable Gage R&R? Measure of the % of variation in our process that is caused by our measurement system Compare measurements within and between operators Compare measurements within and between two (or more) measurement devices Provide criteria to accept new measurement systems (consider new equipment) Evaluate a suspect gage Evaluate a gage before and after corrective action (training, repair, replacement, etc) Determine true process variation Ensure that the measurement system is measuring what we want before process improvement Avoid shipping defects to our customers Avoid scrapping perfectly good parts
  • 5.
    Variable Gage R&Rin a Nut-shell We want to characterize variation from the process We usually estimate this with part-to-part variation Can use an estimate from historical data We want to estimate the test variation Repeatability and reproducibility We want to know if the test variation is “good enough” for the application Ratio of Process Variation to Test Variation (% Study Variation) Ratio of Spec Range to Test Variation (P/T Ratio or %Tolerance)
  • 6.
    Typical Recommended GageR&R Study Select a product this study will represent Collect 10 parts that represent the expected variation you would see in your process. This could include out of spec parts if this is expected. Mistakes include: Collecting parts that are too close together and do not represent the total variation thus making the test variation look worse than it is. Collecting parts across different products thus making the test variation look much better than it is.
  • 7.
    Typical Recommended GageR&R Study Select 3 analysts and have them measure the 10 parts 2 times at random. 60 total measurements Are these numbers magical? Can I use more analysts, parts or repeats?
  • 8.
    R&R According toWikipedia R&R (magazine) , a music trade magazine R&R (Military) , acronym for Rest and Recuperation or Rest and Recreation R&R (EastEnders) , a fictional nightclub in EastEnders Rock & Republic , an American designer jeans company Repeatability and reproducibility Rescue and resuscitation &quot;Read and review&quot;, a term used in fanfiction by authors looking for feedback &quot;Recent and relevant&quot;, a requirement for those training teachers in the UK that they had experience teaching in a school that was both recent and relevant.;
  • 9.
    What Mork SaysWhen He Laughs? Humor. Ar! Ar!
  • 10.
    R&R Repeatability – variation due to the measuring device, or the variation observed when the same operator measures the same part repeatedly with the same device. Reproducibility – variation due to the measuring system, or the variation observed when different operators measure the same part using the same device.
  • 11.
    Gage R&R CrossedHelps assess how well the measuring system can distinguish between parts Whether the operators can measure consistently within and between themselves Assesses test variation Crossed – every part is measured by every person Balanced – the measurement is done the same number of times by each person on each part.
  • 12.
    Nozzle Example Twooperators measured 9 parts two times each. Specification limits – 9012+- 4
  • 13.
    Nozzle Example Specificationlimits – 9012+- 4 Tolerance or Specification Range= ? By entering a value for Process tolerance in Minitab you get an estimate of the proportion of the tolerance taken up by the test variation.
  • 14.
    Nozzle example Stat>QualityTools>Gage Study>Gage R&R Study (Crossed) Options Tolerance or Specification Range= ? By entering a value for Process tolerance in Minitab you get an estimate of the proportion of the tolerance taken up by the test variation.
  • 15.
    Key Graphs Minitabuses an R chart for sample sizes less than 9 and an s chart for 9 or more.
  • 16.
  • 17.
  • 18.
  • 19.
    A Few MoreStatistics
  • 20.
    Measures % Contribution– Each value in the VarComp column is divided by the Total variation then multiplied by 100. This column adds to 100%. Study Var (6*SD) – represents the total width of the distribution of the data based on variation from that Source % Study Var (%SV) – Study var for each source divided by Total Study var * 100. Does not add to 100%. %Tolerance (SV/Tolerance) – Percent of spec range taken up by the total width of the distribution of the data based on variation from that Source %Process – is displayed when a historical std dev is entered in Options.
  • 21.
    Which Measure toUse? If the measurement system is used for process improvement such as reducing part-to-part variation, then %Study variation may be a better measure. If the measurement system is used to evaluate parts relative to specifications, then %Tolerance variation may be a better measure.
  • 22.
    AIAG Guidelines %Toleranceand % Study Variation 10% or less – Acceptable 10% to 30% - Marginal 30% or greater – Unacceptable %Contribution 1% or less – Acceptable 1% to 9% - Marginal 9% or greater - Unacceptable
  • 23.
    Number of DistinctCategories The number of distinct categories that can be reliably observed s part / s measuring system * sqrt(2) Minitab truncates this value except when it is less than 1, in that case Minitab sets the number of distinct categories to 1. Number of categories Interpretation 1 The measurement system cannot discriminate between parts 2 Parts can be divided into high and low groups, as in attribute data 2<n<5 The test is likely not useful. >=5 The system is acceptable (according to AIAG) and can distinguish adequately between parts.
  • 24.
    One More Chart– The Gage Run Chart
  • 25.
    Another Example 3operators measured 10 parts, two times each 60 total data points. Notice that Pipe # is randomized within operator. Process Tolerance = 0.5mm If the parts do not cover the range of the entire process, the estimated variation from the data may not reflect the process variation, thus making the test variation “look” worse than it really is. Use a historical estimate of the variation is possible in this case. It is estimated that the standard deviation of the process is 0.078. Note that this includes test variation.
  • 26.
  • 27.
  • 28.
    Operator * PipeInteraction
  • 29.
    Review the StatisticsNotice % Process
  • 30.
    Creating a DataCollection Worksheet Stat>Quality Tools>Gage Study>Create Gage R&R Study Worksheet Options
  • 31.
    First 30 runsof the 60 run Design
  • 32.
    Nested Studies Usethis for Destructive tests with small batch sizes. Example – Slabs of Stainless Steel 9 slabs are randomly chosen from production. We’re assuming of course the 9 slabs represent the normal variation seen. This may not be true with only 9 selected at random. Randomly assign 3 slabs to each of 3 operators Each impact test is destructive but we can get 3 samples from each slab. We expect very little within slab variation, so testing 3 samples within a slab should be a good estimate of test variation.
  • 33.
  • 34.
    Gage Run ChartNote: To get this graph I had to rename the slabs all 1, 2 or 3.
  • 35.
  • 36.
    Warning Do notapply a variable gage R&R if your measurements use an attribute scale such as pass/fail, or a 1-5 rating. Consider an Attribute Agreement Study for this. That’s another seminar.
  • 37.