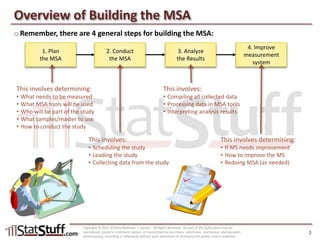
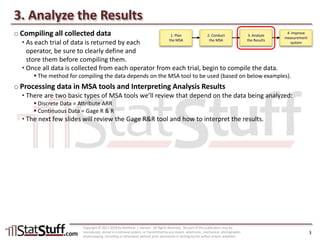
SlideShare a Scribd company logo
Section & Lesson #:
Pre-Requisite Lessons:
Complex Tools + Clear Teaching = Powerful Results
MSA – Gage R&R Test
Six Sigma-Measure – Lesson 31
An extended review on the series on building a MSA, this covers the 3rd
step of analyzing the results by using the Gage R&R test.
Six Sigma-Measure #30 – MSA – Attribute ARR Test
Copyright © 2011-2019 by Matthew J. Hansen. All Rights Reserved. No part of this publication may be reproduced, stored in a retrieval system, or transmitted by any means
(electronic, mechanical, photographic, photocopying, recording or otherwise) without prior permission in writing by the author and/or publisher.
Overview of Building the MSA
o Remember, there are 4 general steps for building the MSA:
Copyright © 2011-2019 by Matthew J. Hansen. All Rights Reserved. No part of this publication may be
reproduced, stored in a retrieval system, or transmitted by any means (electronic, mechanical, photographic,
photocopying, recording or otherwise) without prior permission in writing by the author and/or publisher.
2
1. Plan
the MSA
2. Conduct
the MSA
3. Analyze
the Results
4. Improve
measurement
system
This involves determining:
• What needs to be measured
• What MSA tools will be used
• Who will be part of the study
• What samples/master to use
• How to conduct the study
This involves:
• Scheduling the study
• Leading the study
• Collecting data from the study
This involves:
• Compiling all collected data
• Processing data in MSA tools
• Interpreting analysis results
This involves determining:
• If MS needs improvement
• How to improve the MS
• Redoing MSA (as needed)
3. Analyze the Results
o Compiling all collected data
• As each trial of data is returned by each
operator, be sure to clearly define and
store them before compiling them.
• Once all data is collected from each operator from each trial, begin to compile the data.
 The method for compiling the data depends on the MSA tool to be used (based on below examples).
o Processing data in MSA tools and Interpreting Analysis Results
• There are two basic types of MSA tools we’ll review that depend on the data being analyzed:
 Discrete Data = Attribute ARR
 Continuous Data = Gage R & R
• The next few slides will review the Gage R&R tool and how to interpret the results.
Copyright © 2011-2019 by Matthew J. Hansen. All Rights Reserved. No part of this publication may be
reproduced, stored in a retrieval system, or transmitted by any means (electronic, mechanical, photographic,
photocopying, recording or otherwise) without prior permission in writing by the author and/or publisher.
3
1. Plan
the MSA
2. Conduct
the MSA
3. Analyze
the Results
4. Improve
measurement
system
3. Analyze the Results: Gage R&R Tool
o Gage (Variable) R&R
• This MSA tool analyzes continuous data.
 There are 2 types of Gage R&R studies; the
difference depends on the parts used in the MSA:
– Crossed Gage R&R Study – use this when the same parts are used by each operator for each trial.
– Nested Gage R&R Study – use this when different parts are used by each operator for each trial.
 Neither study analyzes accuracy; they only target precision (repeatability & reproducibility).
 The below example is from the Minitab worksheet file “MSA Example 03.mtw”.
– This tool is not available in Minitab 14 Student Version.
Copyright © 2011-2019 by Matthew J. Hansen. All Rights Reserved. No part of this publication may be
reproduced, stored in a retrieval system, or transmitted by any means (electronic, mechanical, photographic,
photocopying, recording or otherwise) without prior permission in writing by the author and/or publisher.
4
1. Plan
the MSA
2. Conduct
the MSA
3. Analyze
the Results
4. Improve
measurement
system
Begin by setting up the data in a Minitab
worksheet as illustrated below…
…then go to Stat > Quality Tools > Gage Study > Gage
R&R Study (Crossed) and select the columns shown.
A reference for each item
being reviewed.
The “master” (correct
answer)
The answer from each
operator
A reference for each
operator
A reference for each trial
run. Minitab doesn’t
require this but it’s helpful
to track it in the data.
3. Analyze the Results: Gage R&R Tool (cont’d)
o Gage (Variable) R&R (cont’d)
• Minitab outputs results in 2 forms:
 Session Window – this descriptively displays the statistical results of the MSA.
 Graphs Window – this visually displays the statistical results of the MSA.
• We’ll examine how to interpret the results from both of these types of outputs.
Copyright © 2011-2019 by Matthew J. Hansen. All Rights Reserved. No part of this publication may be
reproduced, stored in a retrieval system, or transmitted by any means (electronic, mechanical, photographic,
photocopying, recording or otherwise) without prior permission in writing by the author and/or publisher.
5
1. Plan
the MSA
2. Conduct
the MSA
3. Analyze
the Results
4. Improve
measurement
system
Session Window Graphs Window
Part-to-PartReprodRepeatGage R&R
100
50
0
Percent
% Contribution
% Study Var
1.0
0.5
0.0
SampleRange
_
R=0.080
UCL=0.206
LCL=0
1 2 3
78
75
72
SampleMean
__
X=75.762UCL=75.844LCL=75.680
1 2 3
2019181716151413121110987654321
78
75
72
PartNum
321
78
75
72
Operator
2019181716151413121110987654321
78
75
72
PartNum
Average
1
2
3
Operator
Gage name:
Date of study :
Reported by :
Tolerance:
Misc:
Components of Variation
R Chart by Operator
Xbar Chart by Operator
Answer by PartNum
Answer by Operator
Operator * PartNum Interaction
Gage R&R (ANOVA) for Answer
3. Analyze the Results: Gage R&R Tool (cont’d)
o Gage (Variable) R&R (cont’d)
• Below is how to interpret the descriptive
display of the MSA’s results – shown in Minitab’s session window.
Copyright © 2011-2019 by Matthew J. Hansen. All Rights Reserved. No part of this publication may be
reproduced, stored in a retrieval system, or transmitted by any means (electronic, mechanical, photographic,
photocopying, recording or otherwise) without prior permission in writing by the author and/or publisher.
6
1. Plan
the MSA
2. Conduct
the MSA
3. Analyze
the Results
4. Improve
measurement
system
P-Value < 0.05 means there is a statistical difference. For
Operator to have 0.402 means there’s no statistical difference
between operators (as also represented by the % Contribution).
% Contribution identifies what factor(s) contributes to
the precision (variation) for the MSA. In this example,
the difference in parts make the greatest contribution.
Acceptance: <1% 1% - 10% >10%
% Study Variation & % Tolerance identify what % of a
certain type of variability is accounted for by a particular
source. This study should account for <30% of variation.
Acceptance: <10% 10% - 30% >30%
3. Analyze the Results: Gage R&R Tool (cont’d)
o Gage (Variable) R&R (cont’d)
• Below is how to interpret the graphical
display of the MSA’s results – shown in Minitab as a separate graph.
o How do I interpret the results?
Copyright © 2011-2019 by Matthew J. Hansen. All Rights Reserved. No part of this publication may be
reproduced, stored in a retrieval system, or transmitted by any means (electronic, mechanical, photographic,
photocopying, recording or otherwise) without prior permission in writing by the author and/or publisher.
7
1. Plan
the MSA
2. Conduct
the MSA
3. Analyze
the Results
4. Improve
measurement
system
Part-to-PartReprodRepeatGage R&R
100
50
0
Percent % Contribution
% Study Var
1.0
0.5
0.0
SampleRange
_
R=0.080
UCL=0.206
LCL=0
1 2 3
78
75
72
SampleMean
__
X=75.762UCL=75.844LCL=75.680
1 2 3
2019181716151413121110987654321
78
75
72
PartNum
321
78
75
72
Operator
2019181716151413121110987654321
78
75
72
PartNum
Average
1
2
3
Operator
Gage name:
Date of study :
Reported by :
Tolerance:
Misc:
Components of Variation
R Chart by Operator
Xbar Chart by Operator
Answer by PartNum
Answer by Operator
Operator * PartNum Interaction
Gage R&R (ANOVA) for Answer
Stability
Repeatability
Product vs.
Measurement
Variation
Reproducibility
3. Analyze the Results: Gage R&R Tool (cont’d)
o Stability & Repeatability Range Chart
• What does it do?
 Identifies within operator variability.
 Reflects variation between different measurements
made by the same operator for the same part used
by the same measurement tool/method.
Copyright © 2011-2019 by Matthew J. Hansen. All Rights Reserved. No part of this publication may be
reproduced, stored in a retrieval system, or transmitted by any means (electronic, mechanical, photographic,
photocopying, recording or otherwise) without prior permission in writing by the author and/or publisher.
8
1. Plan
the MSA
2. Conduct
the MSA
3. Analyze
the Results
4. Improve
measurement
system
Part-to-PartReprodRepeatGage R&R
100
50
0
Percent
% Contribution
% Study Var
1.0
0.5
0.0
SampleRange
_
R=0.080
UCL=0.206
LCL=0
1 2 3
78
75
72
SampleMean
__
X=75.762UCL=75.844LCL=75.680
1 2 3
2019181716151413121110987654321
78
75
72
PartNum
321
78
75
72
Operator
2019181716151413121110987654321
78
75
72
PartNum
Average
1
2
3
Operator
Gage name:
Date of study :
Reported by :
Tolerance:
Misc:
Components of Variation
R Chart by Operator
Xbar Chart by Operator
Answer by PartNum
Answer by Operator
Operator * PartNum Interaction
Gage R&R (ANOVA) for Answer
Part-to-PartReprodRepeatGage R&R
100
50
0
Percent
% Contribution
% Study Var
1.0
0.5
0.0
SampleRange
_
R=0.080
UCL=0.206
LCL=0
1 2 3
78
1 2 3
Gage name:
Date of study :
Report
Toleran
Misc:
Components of Variation
R Chart by Operator
Xbar Chart by Operator
Gage R&R (ANOVA) for Answer
Any data points outside the red control
limits indicate significant variation in that
data point’s measurement.
Compare the layout and shape of data
points between each trial to observe any
variation difference between the trials.
3. Analyze the Results: Gage R&R Tool (cont’d)
o Part vs. Measurement Variation
and Reproducibility Xbar Chart
• What does it do?
 Identifies measurement system variation as
compared to part variation.
 Also identifies the difference between the
average measures of different operators.
Copyright © 2011-2019 by Matthew J. Hansen. All Rights Reserved. No part of this publication may be
reproduced, stored in a retrieval system, or transmitted by any means (electronic, mechanical, photographic,
photocopying, recording or otherwise) without prior permission in writing by the author and/or publisher.
9
1. Plan
the MSA
2. Conduct
the MSA
3. Analyze
the Results
4. Improve
measurement
system
Part-to-PartReprodRepeatGage R&R
100
50
0
Percent
% Contribution
% Study Var
1.0
0.5
0.0
SampleRange
_
R=0.080
UCL=0.206
LCL=0
1 2 3
78
75
72
SampleMean
__
X=75.762UCL=75.844LCL=75.680
1 2 3
2019181716151413121110987654321
78
75
72
PartNum
321
78
75
72
Operator
2019181716151413121110987654321
78
75
72
PartNum
Average
1
2
3
Operator
Gage name:
Date of study :
Reported by :
Tolerance:
Misc:
Components of Variation
R Chart by Operator
Xbar Chart by Operator
Answer by PartNum
Answer by Operator
Operator * PartNum Interaction
Gage R&R (ANOVA) for Answer
Part-to-PartReprodRepeatGage R&R
100
50
0
Percent
% Contribution
% Study Var
1.0
0.5
0.0
SampleRange
_
R=0.080
UCL=0.206
LCL=0
1 2 3
78
75
72
SampleMean
__
X=75.762UCL=75.844LCL=75.680
1 2 3
Date of study : Misc:
Components of Variation
R Chart by Operator
Xbar Chart by Operator
The data points should reflect
the same pattern between the
different operators.
The goal is to have 50% of the data
points outside the control limits (red
lines) in order to evaluate randomness.
Practical Application
o Open the “MSA Example 03.mtw” file in Minitab.
• Run the Gage R&R Analysis in Minitab as instructed in this lesson.
 Do your results look the same as those described in the lesson?
• Randomly select at least 10 of the values in the “Answer” column and change their values.
 Re-run the analysis and compare the results from that last set of results. How do they differ?
Copyright © 2011-2019 by Matthew J. Hansen. All Rights Reserved. No part of this publication may be
reproduced, stored in a retrieval system, or transmitted by any means (electronic, mechanical, photographic,
photocopying, recording or otherwise) without prior permission in writing by the author and/or publisher.
10

More Related Content

What's hot

Measuremen Systems Analysis Training Module
Measuremen Systems Analysis Training ModuleMeasuremen Systems Analysis Training Module
Measuremen Systems Analysis Training Module
Frank-G. Adler
 
Measurement System Analysis - Module 2
Measurement System Analysis - Module 2Measurement System Analysis - Module 2
Measurement System Analysis - Module 2
Subhodeep Deb
 
MSA (GR&R)
MSA (GR&R)MSA (GR&R)
MSA (GR&R)
MANISH CHOUDHARY
 
Spc training
Spc trainingSpc training
Spc training
PRASHANT KSHIRSAGAR
 
Attribute MSA
Attribute MSA Attribute MSA
Attribute MSA
dishashah4993
 
Measurement system analysis
Measurement system analysisMeasurement system analysis
Measurement system analysis
PPT4U
 
Statistical Process Control,Control Chart and Process Capability
Statistical Process Control,Control Chart and Process CapabilityStatistical Process Control,Control Chart and Process Capability
Statistical Process Control,Control Chart and Process Capability
vaidehishah25
 
Introduction To SPC
Introduction To SPCIntroduction To SPC
Introduction To SPC
LN Mishra CBAP
 
Gage R&amp;R Measurement Systems Analysis Sample Slides
Gage R&amp;R Measurement Systems Analysis Sample SlidesGage R&amp;R Measurement Systems Analysis Sample Slides
Gage R&amp;R Measurement Systems Analysis Sample Slides
Scott Munger
 
02trainingmaterialformsa (1) 111030062223-phpapp02
02trainingmaterialformsa (1) 111030062223-phpapp0202trainingmaterialformsa (1) 111030062223-phpapp02
02trainingmaterialformsa (1) 111030062223-phpapp02
Junelly Grace Catalan-Tecson
 
Intro to Measurement System Analysis (MSA)
Intro to Measurement System Analysis (MSA)Intro to Measurement System Analysis (MSA)
Intro to Measurement System Analysis (MSA)
Mark Harrison
 
Gr&r studies
Gr&r studiesGr&r studies
Gr&r studies
shilpi020
 
Measurement System Analysis (MSA)
Measurement System Analysis (MSA)Measurement System Analysis (MSA)
Measurement System Analysis (MSA)Ram Kumar
 
Measurement system analysis
Measurement system analysisMeasurement system analysis
Measurement system analysis
Dr. Bikram Jit Singh
 
Introduction to Gage R&R
Introduction to Gage R&RIntroduction to Gage R&R
Msa training
Msa trainingMsa training
Msa training
Jitesh Gaurav
 
MSA presentation
MSA presentationMSA presentation
MSA presentation
sanjay deo
 
Statistical Process control
Statistical Process controlStatistical Process control
Statistical Process control
Prashant Tomar
 
Measurement Systems Analysis - Variable Gage R&R Study Metrics, Applications ...
Measurement Systems Analysis - Variable Gage R&R Study Metrics, Applications ...Measurement Systems Analysis - Variable Gage R&R Study Metrics, Applications ...
Measurement Systems Analysis - Variable Gage R&R Study Metrics, Applications ...
Gabor Szabo, CQE
 

What's hot (20)

Measuremen Systems Analysis Training Module
Measuremen Systems Analysis Training ModuleMeasuremen Systems Analysis Training Module
Measuremen Systems Analysis Training Module
 
Measurement System Analysis - Module 2
Measurement System Analysis - Module 2Measurement System Analysis - Module 2
Measurement System Analysis - Module 2
 
MSA (GR&R)
MSA (GR&R)MSA (GR&R)
MSA (GR&R)
 
Spc training
Spc trainingSpc training
Spc training
 
Attribute MSA
Attribute MSA Attribute MSA
Attribute MSA
 
Measurement system analysis
Measurement system analysisMeasurement system analysis
Measurement system analysis
 
Statistical Process Control,Control Chart and Process Capability
Statistical Process Control,Control Chart and Process CapabilityStatistical Process Control,Control Chart and Process Capability
Statistical Process Control,Control Chart and Process Capability
 
Introduction To SPC
Introduction To SPCIntroduction To SPC
Introduction To SPC
 
Gage R&amp;R Measurement Systems Analysis Sample Slides
Gage R&amp;R Measurement Systems Analysis Sample SlidesGage R&amp;R Measurement Systems Analysis Sample Slides
Gage R&amp;R Measurement Systems Analysis Sample Slides
 
02trainingmaterialformsa (1) 111030062223-phpapp02
02trainingmaterialformsa (1) 111030062223-phpapp0202trainingmaterialformsa (1) 111030062223-phpapp02
02trainingmaterialformsa (1) 111030062223-phpapp02
 
Intro to Measurement System Analysis (MSA)
Intro to Measurement System Analysis (MSA)Intro to Measurement System Analysis (MSA)
Intro to Measurement System Analysis (MSA)
 
Gr&r studies
Gr&r studiesGr&r studies
Gr&r studies
 
Measurement System Analysis (MSA)
Measurement System Analysis (MSA)Measurement System Analysis (MSA)
Measurement System Analysis (MSA)
 
Measurement system analysis
Measurement system analysisMeasurement system analysis
Measurement system analysis
 
Introduction to Gage R&R
Introduction to Gage R&RIntroduction to Gage R&R
Introduction to Gage R&R
 
Msa training
Msa trainingMsa training
Msa training
 
MSA presentation
MSA presentationMSA presentation
MSA presentation
 
Statistical Process control
Statistical Process controlStatistical Process control
Statistical Process control
 
Measurement Systems Analysis - Variable Gage R&R Study Metrics, Applications ...
Measurement Systems Analysis - Variable Gage R&R Study Metrics, Applications ...Measurement Systems Analysis - Variable Gage R&R Study Metrics, Applications ...
Measurement Systems Analysis - Variable Gage R&R Study Metrics, Applications ...
 
New seven qc tools
New seven qc toolsNew seven qc tools
New seven qc tools
 

Similar to MSA – Gage R&R Test

MSA – Attribute ARR Test
MSA – Attribute ARR TestMSA – Attribute ARR Test
MSA – Attribute ARR Test
Matt Hansen
 
MSA – Planning & Conducting the MSA
MSA – Planning & Conducting the MSAMSA – Planning & Conducting the MSA
MSA – Planning & Conducting the MSA
Matt Hansen
 
MSA – Improving the Measurement System
MSA – Improving the Measurement SystemMSA – Improving the Measurement System
MSA – Improving the Measurement System
Matt Hansen
 
Dilshod Achilov Gage R&R
Dilshod Achilov Gage R&RDilshod Achilov Gage R&R
Dilshod Achilov Gage R&R
ahmad bassiouny
 
Comparing Distributions and Using the Graphical Summary
Comparing Distributions and Using the Graphical SummaryComparing Distributions and Using the Graphical Summary
Comparing Distributions and Using the Graphical Summary
Matt Hansen
 
IRJET- Mathematical Analysis of Performance of a Vibratory Bowl Feeder for Fe...
IRJET- Mathematical Analysis of Performance of a Vibratory Bowl Feeder for Fe...IRJET- Mathematical Analysis of Performance of a Vibratory Bowl Feeder for Fe...
IRJET- Mathematical Analysis of Performance of a Vibratory Bowl Feeder for Fe...
IRJET Journal
 
Training on the topic MSA as per new RevAF.pptx
Training on the topic MSA as per new RevAF.pptxTraining on the topic MSA as per new RevAF.pptx
Training on the topic MSA as per new RevAF.pptx
SantoshKale31
 
Gage Repeatability and Reproducibility in Semiconductor Manufacturing.pptx
Gage Repeatability and Reproducibility in Semiconductor Manufacturing.pptxGage Repeatability and Reproducibility in Semiconductor Manufacturing.pptx
Gage Repeatability and Reproducibility in Semiconductor Manufacturing.pptx
yieldWerx Semiconductor
 
Stages of FMEA in Total Quality Management
Stages of FMEA in Total Quality Management Stages of FMEA in Total Quality Management
Stages of FMEA in Total Quality Management
Dr.Raja R
 
Six Sigma DMAIC Measure Phase Introduction
Six Sigma DMAIC Measure Phase IntroductionSix Sigma DMAIC Measure Phase Introduction
Six Sigma DMAIC Measure Phase Introduction
kusukundi
 
GP_Training_Introduction-to-MSA__RevAF.pptx
GP_Training_Introduction-to-MSA__RevAF.pptxGP_Training_Introduction-to-MSA__RevAF.pptx
GP_Training_Introduction-to-MSA__RevAF.pptx
ssuserbcf0cd
 
7 QC Tools for data analysis and problem solving
7 QC Tools for data analysis and problem solving7 QC Tools for data analysis and problem solving
7 QC Tools for data analysis and problem solving
papplion
 
IRJET- Failure Mode and Effect Analysis (FMEA) – A Case Study in Manufacturin...
IRJET- Failure Mode and Effect Analysis (FMEA) – A Case Study in Manufacturin...IRJET- Failure Mode and Effect Analysis (FMEA) – A Case Study in Manufacturin...
IRJET- Failure Mode and Effect Analysis (FMEA) – A Case Study in Manufacturin...
IRJET Journal
 
Six sigma tools an overview
Six sigma tools  an overviewSix sigma tools  an overview
Six sigma tools an overview
Komal Kamble
 
7 qc tools.
7 qc tools.7 qc tools.
Quality Improvement Using Gr&R : A Case Study
Quality Improvement Using Gr&R : A Case StudyQuality Improvement Using Gr&R : A Case Study
Quality Improvement Using Gr&R : A Case Study
IRJET Journal
 
Data Analytics For Beginners | Introduction To Data Analytics | Data Analytic...
Data Analytics For Beginners | Introduction To Data Analytics | Data Analytic...Data Analytics For Beginners | Introduction To Data Analytics | Data Analytic...
Data Analytics For Beginners | Introduction To Data Analytics | Data Analytic...
Edureka!
 
MSA – Overview
MSA – OverviewMSA – Overview
MSA – Overview
Matt Hansen
 
AIG Seven QC Tools
AIG Seven QC ToolsAIG Seven QC Tools
AIG Seven QC Tools
advanceinnovationgroup
 

Similar to MSA – Gage R&R Test (20)

MSA – Attribute ARR Test
MSA – Attribute ARR TestMSA – Attribute ARR Test
MSA – Attribute ARR Test
 
MSA – Planning & Conducting the MSA
MSA – Planning & Conducting the MSAMSA – Planning & Conducting the MSA
MSA – Planning & Conducting the MSA
 
MSA – Improving the Measurement System
MSA – Improving the Measurement SystemMSA – Improving the Measurement System
MSA – Improving the Measurement System
 
C O N T R O L L P R E S E N T A T I O N
C O N T R O L L  P R E S E N T A T I O NC O N T R O L L  P R E S E N T A T I O N
C O N T R O L L P R E S E N T A T I O N
 
Dilshod Achilov Gage R&R
Dilshod Achilov Gage R&RDilshod Achilov Gage R&R
Dilshod Achilov Gage R&R
 
Comparing Distributions and Using the Graphical Summary
Comparing Distributions and Using the Graphical SummaryComparing Distributions and Using the Graphical Summary
Comparing Distributions and Using the Graphical Summary
 
IRJET- Mathematical Analysis of Performance of a Vibratory Bowl Feeder for Fe...
IRJET- Mathematical Analysis of Performance of a Vibratory Bowl Feeder for Fe...IRJET- Mathematical Analysis of Performance of a Vibratory Bowl Feeder for Fe...
IRJET- Mathematical Analysis of Performance of a Vibratory Bowl Feeder for Fe...
 
Training on the topic MSA as per new RevAF.pptx
Training on the topic MSA as per new RevAF.pptxTraining on the topic MSA as per new RevAF.pptx
Training on the topic MSA as per new RevAF.pptx
 
Gage Repeatability and Reproducibility in Semiconductor Manufacturing.pptx
Gage Repeatability and Reproducibility in Semiconductor Manufacturing.pptxGage Repeatability and Reproducibility in Semiconductor Manufacturing.pptx
Gage Repeatability and Reproducibility in Semiconductor Manufacturing.pptx
 
Stages of FMEA in Total Quality Management
Stages of FMEA in Total Quality Management Stages of FMEA in Total Quality Management
Stages of FMEA in Total Quality Management
 
Six Sigma DMAIC Measure Phase Introduction
Six Sigma DMAIC Measure Phase IntroductionSix Sigma DMAIC Measure Phase Introduction
Six Sigma DMAIC Measure Phase Introduction
 
GP_Training_Introduction-to-MSA__RevAF.pptx
GP_Training_Introduction-to-MSA__RevAF.pptxGP_Training_Introduction-to-MSA__RevAF.pptx
GP_Training_Introduction-to-MSA__RevAF.pptx
 
7 QC Tools for data analysis and problem solving
7 QC Tools for data analysis and problem solving7 QC Tools for data analysis and problem solving
7 QC Tools for data analysis and problem solving
 
IRJET- Failure Mode and Effect Analysis (FMEA) – A Case Study in Manufacturin...
IRJET- Failure Mode and Effect Analysis (FMEA) – A Case Study in Manufacturin...IRJET- Failure Mode and Effect Analysis (FMEA) – A Case Study in Manufacturin...
IRJET- Failure Mode and Effect Analysis (FMEA) – A Case Study in Manufacturin...
 
Six sigma tools an overview
Six sigma tools  an overviewSix sigma tools  an overview
Six sigma tools an overview
 
7 qc tools.
7 qc tools.7 qc tools.
7 qc tools.
 
Quality Improvement Using Gr&R : A Case Study
Quality Improvement Using Gr&R : A Case StudyQuality Improvement Using Gr&R : A Case Study
Quality Improvement Using Gr&R : A Case Study
 
Data Analytics For Beginners | Introduction To Data Analytics | Data Analytic...
Data Analytics For Beginners | Introduction To Data Analytics | Data Analytic...Data Analytics For Beginners | Introduction To Data Analytics | Data Analytic...
Data Analytics For Beginners | Introduction To Data Analytics | Data Analytic...
 
MSA – Overview
MSA – OverviewMSA – Overview
MSA – Overview
 
AIG Seven QC Tools
AIG Seven QC ToolsAIG Seven QC Tools
AIG Seven QC Tools
 

More from Matt Hansen

Getting Feedback with a Plus/Delta Tool
Getting Feedback with a Plus/Delta ToolGetting Feedback with a Plus/Delta Tool
Getting Feedback with a Plus/Delta Tool
Matt Hansen
 
Closing a Project
Closing a ProjectClosing a Project
Closing a Project
Matt Hansen
 
Documenting a New Process with SOPs
Documenting a New Process with SOPsDocumenting a New Process with SOPs
Documenting a New Process with SOPs
Matt Hansen
 
Building a Control Plan
Building a Control PlanBuilding a Control Plan
Building a Control Plan
Matt Hansen
 
Control Charts: Recalculating Control Limits
Control Charts: Recalculating Control LimitsControl Charts: Recalculating Control Limits
Control Charts: Recalculating Control Limits
Matt Hansen
 
Control Charts: U Chart
Control Charts: U ChartControl Charts: U Chart
Control Charts: U Chart
Matt Hansen
 
Control Charts: P Chart
Control Charts: P ChartControl Charts: P Chart
Control Charts: P Chart
Matt Hansen
 
Control Charts: Xbar-S Chart
Control Charts: Xbar-S ChartControl Charts: Xbar-S Chart
Control Charts: Xbar-S Chart
Matt Hansen
 
Control Charts: I-MR Chart
Control Charts: I-MR ChartControl Charts: I-MR Chart
Control Charts: I-MR Chart
Matt Hansen
 
Control Charts: Finding the Right Control Chart
Control Charts: Finding the Right Control ChartControl Charts: Finding the Right Control Chart
Control Charts: Finding the Right Control Chart
Matt Hansen
 
Building a Scorecard
Building a ScorecardBuilding a Scorecard
Building a Scorecard
Matt Hansen
 
Control Phase Roadmap (Level 3)
Control Phase Roadmap (Level 3)Control Phase Roadmap (Level 3)
Control Phase Roadmap (Level 3)
Matt Hansen
 
Piloting Solutions: Build the Pilot Plan
Piloting Solutions: Build the Pilot PlanPiloting Solutions: Build the Pilot Plan
Piloting Solutions: Build the Pilot Plan
Matt Hansen
 
Piloting Solutions: The Process
Piloting Solutions: The ProcessPiloting Solutions: The Process
Piloting Solutions: The Process
Matt Hansen
 
Risk Assessment with a FMEA Tool
Risk Assessment with a FMEA ToolRisk Assessment with a FMEA Tool
Risk Assessment with a FMEA Tool
Matt Hansen
 
Prioritize Solutions with an Impact Matrix
Prioritize Solutions with an Impact MatrixPrioritize Solutions with an Impact Matrix
Prioritize Solutions with an Impact Matrix
Matt Hansen
 
Brainstorm Solutions with an Affinity Diagram
Brainstorm Solutions with an Affinity DiagramBrainstorm Solutions with an Affinity Diagram
Brainstorm Solutions with an Affinity Diagram
Matt Hansen
 
Brainstorm & Prioritize Solutions with a Workout
Brainstorm & Prioritize Solutions with a WorkoutBrainstorm & Prioritize Solutions with a Workout
Brainstorm & Prioritize Solutions with a Workout
Matt Hansen
 
Testing for Multicollinearity
Testing for MulticollinearityTesting for Multicollinearity
Testing for Multicollinearity
Matt Hansen
 
Compiling Analysis Results
Compiling Analysis ResultsCompiling Analysis Results
Compiling Analysis Results
Matt Hansen
 

More from Matt Hansen (20)

Getting Feedback with a Plus/Delta Tool
Getting Feedback with a Plus/Delta ToolGetting Feedback with a Plus/Delta Tool
Getting Feedback with a Plus/Delta Tool
 
Closing a Project
Closing a ProjectClosing a Project
Closing a Project
 
Documenting a New Process with SOPs
Documenting a New Process with SOPsDocumenting a New Process with SOPs
Documenting a New Process with SOPs
 
Building a Control Plan
Building a Control PlanBuilding a Control Plan
Building a Control Plan
 
Control Charts: Recalculating Control Limits
Control Charts: Recalculating Control LimitsControl Charts: Recalculating Control Limits
Control Charts: Recalculating Control Limits
 
Control Charts: U Chart
Control Charts: U ChartControl Charts: U Chart
Control Charts: U Chart
 
Control Charts: P Chart
Control Charts: P ChartControl Charts: P Chart
Control Charts: P Chart
 
Control Charts: Xbar-S Chart
Control Charts: Xbar-S ChartControl Charts: Xbar-S Chart
Control Charts: Xbar-S Chart
 
Control Charts: I-MR Chart
Control Charts: I-MR ChartControl Charts: I-MR Chart
Control Charts: I-MR Chart
 
Control Charts: Finding the Right Control Chart
Control Charts: Finding the Right Control ChartControl Charts: Finding the Right Control Chart
Control Charts: Finding the Right Control Chart
 
Building a Scorecard
Building a ScorecardBuilding a Scorecard
Building a Scorecard
 
Control Phase Roadmap (Level 3)
Control Phase Roadmap (Level 3)Control Phase Roadmap (Level 3)
Control Phase Roadmap (Level 3)
 
Piloting Solutions: Build the Pilot Plan
Piloting Solutions: Build the Pilot PlanPiloting Solutions: Build the Pilot Plan
Piloting Solutions: Build the Pilot Plan
 
Piloting Solutions: The Process
Piloting Solutions: The ProcessPiloting Solutions: The Process
Piloting Solutions: The Process
 
Risk Assessment with a FMEA Tool
Risk Assessment with a FMEA ToolRisk Assessment with a FMEA Tool
Risk Assessment with a FMEA Tool
 
Prioritize Solutions with an Impact Matrix
Prioritize Solutions with an Impact MatrixPrioritize Solutions with an Impact Matrix
Prioritize Solutions with an Impact Matrix
 
Brainstorm Solutions with an Affinity Diagram
Brainstorm Solutions with an Affinity DiagramBrainstorm Solutions with an Affinity Diagram
Brainstorm Solutions with an Affinity Diagram
 
Brainstorm & Prioritize Solutions with a Workout
Brainstorm & Prioritize Solutions with a WorkoutBrainstorm & Prioritize Solutions with a Workout
Brainstorm & Prioritize Solutions with a Workout
 
Testing for Multicollinearity
Testing for MulticollinearityTesting for Multicollinearity
Testing for Multicollinearity
 
Compiling Analysis Results
Compiling Analysis ResultsCompiling Analysis Results
Compiling Analysis Results
 

Recently uploaded

Skye Residences | Extended Stay Residences Near Toronto Airport
Skye Residences | Extended Stay Residences Near Toronto AirportSkye Residences | Extended Stay Residences Near Toronto Airport
Skye Residences | Extended Stay Residences Near Toronto Airport
marketingjdass
 
一比一原版加拿大渥太华大学毕业证(uottawa毕业证书)如何办理
一比一原版加拿大渥太华大学毕业证(uottawa毕业证书)如何办理一比一原版加拿大渥太华大学毕业证(uottawa毕业证书)如何办理
一比一原版加拿大渥太华大学毕业证(uottawa毕业证书)如何办理
taqyed
 
Project File Report BBA 6th semester.pdf
Project File Report BBA 6th semester.pdfProject File Report BBA 6th semester.pdf
Project File Report BBA 6th semester.pdf
RajPriye
 
Business Valuation Principles for Entrepreneurs
Business Valuation Principles for EntrepreneursBusiness Valuation Principles for Entrepreneurs
Business Valuation Principles for Entrepreneurs
Ben Wann
 
The-McKinsey-7S-Framework. strategic management
The-McKinsey-7S-Framework. strategic managementThe-McKinsey-7S-Framework. strategic management
The-McKinsey-7S-Framework. strategic management
Bojamma2
 
ModelingMarketingStrategiesMKS.CollumbiaUniversitypdf
ModelingMarketingStrategiesMKS.CollumbiaUniversitypdfModelingMarketingStrategiesMKS.CollumbiaUniversitypdf
ModelingMarketingStrategiesMKS.CollumbiaUniversitypdf
fisherameliaisabella
 
Meas_Dylan_DMBS_PB1_2024-05XX_Revised.pdf
Meas_Dylan_DMBS_PB1_2024-05XX_Revised.pdfMeas_Dylan_DMBS_PB1_2024-05XX_Revised.pdf
Meas_Dylan_DMBS_PB1_2024-05XX_Revised.pdf
dylandmeas
 
April 2024 Nostalgia Products Newsletter
April 2024 Nostalgia Products NewsletterApril 2024 Nostalgia Products Newsletter
April 2024 Nostalgia Products Newsletter
NathanBaughman3
 
Kseniya Leshchenko: Shared development support service model as the way to ma...
Kseniya Leshchenko: Shared development support service model as the way to ma...Kseniya Leshchenko: Shared development support service model as the way to ma...
Kseniya Leshchenko: Shared development support service model as the way to ma...
Lviv Startup Club
 
What are the main advantages of using HR recruiter services.pdf
What are the main advantages of using HR recruiter services.pdfWhat are the main advantages of using HR recruiter services.pdf
What are the main advantages of using HR recruiter services.pdf
HumanResourceDimensi1
 
5 Things You Need To Know Before Hiring a Videographer
5 Things You Need To Know Before Hiring a Videographer5 Things You Need To Know Before Hiring a Videographer
5 Things You Need To Know Before Hiring a Videographer
ofm712785
 
LA HUG - Video Testimonials with Chynna Morgan - June 2024
LA HUG - Video Testimonials with Chynna Morgan - June 2024LA HUG - Video Testimonials with Chynna Morgan - June 2024
LA HUG - Video Testimonials with Chynna Morgan - June 2024
Lital Barkan
 
Putting the SPARK into Virtual Training.pptx
Putting the SPARK into Virtual Training.pptxPutting the SPARK into Virtual Training.pptx
Putting the SPARK into Virtual Training.pptx
Cynthia Clay
 
Digital Transformation and IT Strategy Toolkit and Templates
Digital Transformation and IT Strategy Toolkit and TemplatesDigital Transformation and IT Strategy Toolkit and Templates
Digital Transformation and IT Strategy Toolkit and Templates
Aurelien Domont, MBA
 
ikea_woodgreen_petscharity_dog-alogue_digital.pdf
ikea_woodgreen_petscharity_dog-alogue_digital.pdfikea_woodgreen_petscharity_dog-alogue_digital.pdf
ikea_woodgreen_petscharity_dog-alogue_digital.pdf
agatadrynko
 
Memorandum Of Association Constitution of Company.ppt
Memorandum Of Association Constitution of Company.pptMemorandum Of Association Constitution of Company.ppt
Memorandum Of Association Constitution of Company.ppt
seri bangash
 
Buy Verified PayPal Account | Buy Google 5 Star Reviews
Buy Verified PayPal Account | Buy Google 5 Star ReviewsBuy Verified PayPal Account | Buy Google 5 Star Reviews
Buy Verified PayPal Account | Buy Google 5 Star Reviews
usawebmarket
 
Enterprise Excellence is Inclusive Excellence.pdf
Enterprise Excellence is Inclusive Excellence.pdfEnterprise Excellence is Inclusive Excellence.pdf
Enterprise Excellence is Inclusive Excellence.pdf
KaiNexus
 
20240425_ TJ Communications Credentials_compressed.pdf
20240425_ TJ Communications Credentials_compressed.pdf20240425_ TJ Communications Credentials_compressed.pdf
20240425_ TJ Communications Credentials_compressed.pdf
tjcomstrang
 
Exploring Patterns of Connection with Social Dreaming
Exploring Patterns of Connection with Social DreamingExploring Patterns of Connection with Social Dreaming
Exploring Patterns of Connection with Social Dreaming
Nicola Wreford-Howard
 

Recently uploaded (20)

Skye Residences | Extended Stay Residences Near Toronto Airport
Skye Residences | Extended Stay Residences Near Toronto AirportSkye Residences | Extended Stay Residences Near Toronto Airport
Skye Residences | Extended Stay Residences Near Toronto Airport
 
一比一原版加拿大渥太华大学毕业证(uottawa毕业证书)如何办理
一比一原版加拿大渥太华大学毕业证(uottawa毕业证书)如何办理一比一原版加拿大渥太华大学毕业证(uottawa毕业证书)如何办理
一比一原版加拿大渥太华大学毕业证(uottawa毕业证书)如何办理
 
Project File Report BBA 6th semester.pdf
Project File Report BBA 6th semester.pdfProject File Report BBA 6th semester.pdf
Project File Report BBA 6th semester.pdf
 
Business Valuation Principles for Entrepreneurs
Business Valuation Principles for EntrepreneursBusiness Valuation Principles for Entrepreneurs
Business Valuation Principles for Entrepreneurs
 
The-McKinsey-7S-Framework. strategic management
The-McKinsey-7S-Framework. strategic managementThe-McKinsey-7S-Framework. strategic management
The-McKinsey-7S-Framework. strategic management
 
ModelingMarketingStrategiesMKS.CollumbiaUniversitypdf
ModelingMarketingStrategiesMKS.CollumbiaUniversitypdfModelingMarketingStrategiesMKS.CollumbiaUniversitypdf
ModelingMarketingStrategiesMKS.CollumbiaUniversitypdf
 
Meas_Dylan_DMBS_PB1_2024-05XX_Revised.pdf
Meas_Dylan_DMBS_PB1_2024-05XX_Revised.pdfMeas_Dylan_DMBS_PB1_2024-05XX_Revised.pdf
Meas_Dylan_DMBS_PB1_2024-05XX_Revised.pdf
 
April 2024 Nostalgia Products Newsletter
April 2024 Nostalgia Products NewsletterApril 2024 Nostalgia Products Newsletter
April 2024 Nostalgia Products Newsletter
 
Kseniya Leshchenko: Shared development support service model as the way to ma...
Kseniya Leshchenko: Shared development support service model as the way to ma...Kseniya Leshchenko: Shared development support service model as the way to ma...
Kseniya Leshchenko: Shared development support service model as the way to ma...
 
What are the main advantages of using HR recruiter services.pdf
What are the main advantages of using HR recruiter services.pdfWhat are the main advantages of using HR recruiter services.pdf
What are the main advantages of using HR recruiter services.pdf
 
5 Things You Need To Know Before Hiring a Videographer
5 Things You Need To Know Before Hiring a Videographer5 Things You Need To Know Before Hiring a Videographer
5 Things You Need To Know Before Hiring a Videographer
 
LA HUG - Video Testimonials with Chynna Morgan - June 2024
LA HUG - Video Testimonials with Chynna Morgan - June 2024LA HUG - Video Testimonials with Chynna Morgan - June 2024
LA HUG - Video Testimonials with Chynna Morgan - June 2024
 
Putting the SPARK into Virtual Training.pptx
Putting the SPARK into Virtual Training.pptxPutting the SPARK into Virtual Training.pptx
Putting the SPARK into Virtual Training.pptx
 
Digital Transformation and IT Strategy Toolkit and Templates
Digital Transformation and IT Strategy Toolkit and TemplatesDigital Transformation and IT Strategy Toolkit and Templates
Digital Transformation and IT Strategy Toolkit and Templates
 
ikea_woodgreen_petscharity_dog-alogue_digital.pdf
ikea_woodgreen_petscharity_dog-alogue_digital.pdfikea_woodgreen_petscharity_dog-alogue_digital.pdf
ikea_woodgreen_petscharity_dog-alogue_digital.pdf
 
Memorandum Of Association Constitution of Company.ppt
Memorandum Of Association Constitution of Company.pptMemorandum Of Association Constitution of Company.ppt
Memorandum Of Association Constitution of Company.ppt
 
Buy Verified PayPal Account | Buy Google 5 Star Reviews
Buy Verified PayPal Account | Buy Google 5 Star ReviewsBuy Verified PayPal Account | Buy Google 5 Star Reviews
Buy Verified PayPal Account | Buy Google 5 Star Reviews
 
Enterprise Excellence is Inclusive Excellence.pdf
Enterprise Excellence is Inclusive Excellence.pdfEnterprise Excellence is Inclusive Excellence.pdf
Enterprise Excellence is Inclusive Excellence.pdf
 
20240425_ TJ Communications Credentials_compressed.pdf
20240425_ TJ Communications Credentials_compressed.pdf20240425_ TJ Communications Credentials_compressed.pdf
20240425_ TJ Communications Credentials_compressed.pdf
 
Exploring Patterns of Connection with Social Dreaming
Exploring Patterns of Connection with Social DreamingExploring Patterns of Connection with Social Dreaming
Exploring Patterns of Connection with Social Dreaming
 

MSA – Gage R&R Test

  • 1. Section & Lesson #: Pre-Requisite Lessons: Complex Tools + Clear Teaching = Powerful Results MSA – Gage R&R Test Six Sigma-Measure – Lesson 31 An extended review on the series on building a MSA, this covers the 3rd step of analyzing the results by using the Gage R&R test. Six Sigma-Measure #30 – MSA – Attribute ARR Test Copyright © 2011-2019 by Matthew J. Hansen. All Rights Reserved. No part of this publication may be reproduced, stored in a retrieval system, or transmitted by any means (electronic, mechanical, photographic, photocopying, recording or otherwise) without prior permission in writing by the author and/or publisher.
  • 2. Overview of Building the MSA o Remember, there are 4 general steps for building the MSA: Copyright © 2011-2019 by Matthew J. Hansen. All Rights Reserved. No part of this publication may be reproduced, stored in a retrieval system, or transmitted by any means (electronic, mechanical, photographic, photocopying, recording or otherwise) without prior permission in writing by the author and/or publisher. 2 1. Plan the MSA 2. Conduct the MSA 3. Analyze the Results 4. Improve measurement system This involves determining: • What needs to be measured • What MSA tools will be used • Who will be part of the study • What samples/master to use • How to conduct the study This involves: • Scheduling the study • Leading the study • Collecting data from the study This involves: • Compiling all collected data • Processing data in MSA tools • Interpreting analysis results This involves determining: • If MS needs improvement • How to improve the MS • Redoing MSA (as needed)
  • 3. 3. Analyze the Results o Compiling all collected data • As each trial of data is returned by each operator, be sure to clearly define and store them before compiling them. • Once all data is collected from each operator from each trial, begin to compile the data.  The method for compiling the data depends on the MSA tool to be used (based on below examples). o Processing data in MSA tools and Interpreting Analysis Results • There are two basic types of MSA tools we’ll review that depend on the data being analyzed:  Discrete Data = Attribute ARR  Continuous Data = Gage R & R • The next few slides will review the Gage R&R tool and how to interpret the results. Copyright © 2011-2019 by Matthew J. Hansen. All Rights Reserved. No part of this publication may be reproduced, stored in a retrieval system, or transmitted by any means (electronic, mechanical, photographic, photocopying, recording or otherwise) without prior permission in writing by the author and/or publisher. 3 1. Plan the MSA 2. Conduct the MSA 3. Analyze the Results 4. Improve measurement system
  • 4. 3. Analyze the Results: Gage R&R Tool o Gage (Variable) R&R • This MSA tool analyzes continuous data.  There are 2 types of Gage R&R studies; the difference depends on the parts used in the MSA: – Crossed Gage R&R Study – use this when the same parts are used by each operator for each trial. – Nested Gage R&R Study – use this when different parts are used by each operator for each trial.  Neither study analyzes accuracy; they only target precision (repeatability & reproducibility).  The below example is from the Minitab worksheet file “MSA Example 03.mtw”. – This tool is not available in Minitab 14 Student Version. Copyright © 2011-2019 by Matthew J. Hansen. All Rights Reserved. No part of this publication may be reproduced, stored in a retrieval system, or transmitted by any means (electronic, mechanical, photographic, photocopying, recording or otherwise) without prior permission in writing by the author and/or publisher. 4 1. Plan the MSA 2. Conduct the MSA 3. Analyze the Results 4. Improve measurement system Begin by setting up the data in a Minitab worksheet as illustrated below… …then go to Stat > Quality Tools > Gage Study > Gage R&R Study (Crossed) and select the columns shown. A reference for each item being reviewed. The “master” (correct answer) The answer from each operator A reference for each operator A reference for each trial run. Minitab doesn’t require this but it’s helpful to track it in the data.
  • 5. 3. Analyze the Results: Gage R&R Tool (cont’d) o Gage (Variable) R&R (cont’d) • Minitab outputs results in 2 forms:  Session Window – this descriptively displays the statistical results of the MSA.  Graphs Window – this visually displays the statistical results of the MSA. • We’ll examine how to interpret the results from both of these types of outputs. Copyright © 2011-2019 by Matthew J. Hansen. All Rights Reserved. No part of this publication may be reproduced, stored in a retrieval system, or transmitted by any means (electronic, mechanical, photographic, photocopying, recording or otherwise) without prior permission in writing by the author and/or publisher. 5 1. Plan the MSA 2. Conduct the MSA 3. Analyze the Results 4. Improve measurement system Session Window Graphs Window Part-to-PartReprodRepeatGage R&R 100 50 0 Percent % Contribution % Study Var 1.0 0.5 0.0 SampleRange _ R=0.080 UCL=0.206 LCL=0 1 2 3 78 75 72 SampleMean __ X=75.762UCL=75.844LCL=75.680 1 2 3 2019181716151413121110987654321 78 75 72 PartNum 321 78 75 72 Operator 2019181716151413121110987654321 78 75 72 PartNum Average 1 2 3 Operator Gage name: Date of study : Reported by : Tolerance: Misc: Components of Variation R Chart by Operator Xbar Chart by Operator Answer by PartNum Answer by Operator Operator * PartNum Interaction Gage R&R (ANOVA) for Answer
  • 6. 3. Analyze the Results: Gage R&R Tool (cont’d) o Gage (Variable) R&R (cont’d) • Below is how to interpret the descriptive display of the MSA’s results – shown in Minitab’s session window. Copyright © 2011-2019 by Matthew J. Hansen. All Rights Reserved. No part of this publication may be reproduced, stored in a retrieval system, or transmitted by any means (electronic, mechanical, photographic, photocopying, recording or otherwise) without prior permission in writing by the author and/or publisher. 6 1. Plan the MSA 2. Conduct the MSA 3. Analyze the Results 4. Improve measurement system P-Value < 0.05 means there is a statistical difference. For Operator to have 0.402 means there’s no statistical difference between operators (as also represented by the % Contribution). % Contribution identifies what factor(s) contributes to the precision (variation) for the MSA. In this example, the difference in parts make the greatest contribution. Acceptance: <1% 1% - 10% >10% % Study Variation & % Tolerance identify what % of a certain type of variability is accounted for by a particular source. This study should account for <30% of variation. Acceptance: <10% 10% - 30% >30%
  • 7. 3. Analyze the Results: Gage R&R Tool (cont’d) o Gage (Variable) R&R (cont’d) • Below is how to interpret the graphical display of the MSA’s results – shown in Minitab as a separate graph. o How do I interpret the results? Copyright © 2011-2019 by Matthew J. Hansen. All Rights Reserved. No part of this publication may be reproduced, stored in a retrieval system, or transmitted by any means (electronic, mechanical, photographic, photocopying, recording or otherwise) without prior permission in writing by the author and/or publisher. 7 1. Plan the MSA 2. Conduct the MSA 3. Analyze the Results 4. Improve measurement system Part-to-PartReprodRepeatGage R&R 100 50 0 Percent % Contribution % Study Var 1.0 0.5 0.0 SampleRange _ R=0.080 UCL=0.206 LCL=0 1 2 3 78 75 72 SampleMean __ X=75.762UCL=75.844LCL=75.680 1 2 3 2019181716151413121110987654321 78 75 72 PartNum 321 78 75 72 Operator 2019181716151413121110987654321 78 75 72 PartNum Average 1 2 3 Operator Gage name: Date of study : Reported by : Tolerance: Misc: Components of Variation R Chart by Operator Xbar Chart by Operator Answer by PartNum Answer by Operator Operator * PartNum Interaction Gage R&R (ANOVA) for Answer Stability Repeatability Product vs. Measurement Variation Reproducibility
  • 8. 3. Analyze the Results: Gage R&R Tool (cont’d) o Stability & Repeatability Range Chart • What does it do?  Identifies within operator variability.  Reflects variation between different measurements made by the same operator for the same part used by the same measurement tool/method. Copyright © 2011-2019 by Matthew J. Hansen. All Rights Reserved. No part of this publication may be reproduced, stored in a retrieval system, or transmitted by any means (electronic, mechanical, photographic, photocopying, recording or otherwise) without prior permission in writing by the author and/or publisher. 8 1. Plan the MSA 2. Conduct the MSA 3. Analyze the Results 4. Improve measurement system Part-to-PartReprodRepeatGage R&R 100 50 0 Percent % Contribution % Study Var 1.0 0.5 0.0 SampleRange _ R=0.080 UCL=0.206 LCL=0 1 2 3 78 75 72 SampleMean __ X=75.762UCL=75.844LCL=75.680 1 2 3 2019181716151413121110987654321 78 75 72 PartNum 321 78 75 72 Operator 2019181716151413121110987654321 78 75 72 PartNum Average 1 2 3 Operator Gage name: Date of study : Reported by : Tolerance: Misc: Components of Variation R Chart by Operator Xbar Chart by Operator Answer by PartNum Answer by Operator Operator * PartNum Interaction Gage R&R (ANOVA) for Answer Part-to-PartReprodRepeatGage R&R 100 50 0 Percent % Contribution % Study Var 1.0 0.5 0.0 SampleRange _ R=0.080 UCL=0.206 LCL=0 1 2 3 78 1 2 3 Gage name: Date of study : Report Toleran Misc: Components of Variation R Chart by Operator Xbar Chart by Operator Gage R&R (ANOVA) for Answer Any data points outside the red control limits indicate significant variation in that data point’s measurement. Compare the layout and shape of data points between each trial to observe any variation difference between the trials.
  • 9. 3. Analyze the Results: Gage R&R Tool (cont’d) o Part vs. Measurement Variation and Reproducibility Xbar Chart • What does it do?  Identifies measurement system variation as compared to part variation.  Also identifies the difference between the average measures of different operators. Copyright © 2011-2019 by Matthew J. Hansen. All Rights Reserved. No part of this publication may be reproduced, stored in a retrieval system, or transmitted by any means (electronic, mechanical, photographic, photocopying, recording or otherwise) without prior permission in writing by the author and/or publisher. 9 1. Plan the MSA 2. Conduct the MSA 3. Analyze the Results 4. Improve measurement system Part-to-PartReprodRepeatGage R&R 100 50 0 Percent % Contribution % Study Var 1.0 0.5 0.0 SampleRange _ R=0.080 UCL=0.206 LCL=0 1 2 3 78 75 72 SampleMean __ X=75.762UCL=75.844LCL=75.680 1 2 3 2019181716151413121110987654321 78 75 72 PartNum 321 78 75 72 Operator 2019181716151413121110987654321 78 75 72 PartNum Average 1 2 3 Operator Gage name: Date of study : Reported by : Tolerance: Misc: Components of Variation R Chart by Operator Xbar Chart by Operator Answer by PartNum Answer by Operator Operator * PartNum Interaction Gage R&R (ANOVA) for Answer Part-to-PartReprodRepeatGage R&R 100 50 0 Percent % Contribution % Study Var 1.0 0.5 0.0 SampleRange _ R=0.080 UCL=0.206 LCL=0 1 2 3 78 75 72 SampleMean __ X=75.762UCL=75.844LCL=75.680 1 2 3 Date of study : Misc: Components of Variation R Chart by Operator Xbar Chart by Operator The data points should reflect the same pattern between the different operators. The goal is to have 50% of the data points outside the control limits (red lines) in order to evaluate randomness.
  • 10. Practical Application o Open the “MSA Example 03.mtw” file in Minitab. • Run the Gage R&R Analysis in Minitab as instructed in this lesson.  Do your results look the same as those described in the lesson? • Randomly select at least 10 of the values in the “Answer” column and change their values.  Re-run the analysis and compare the results from that last set of results. How do they differ? Copyright © 2011-2019 by Matthew J. Hansen. All Rights Reserved. No part of this publication may be reproduced, stored in a retrieval system, or transmitted by any means (electronic, mechanical, photographic, photocopying, recording or otherwise) without prior permission in writing by the author and/or publisher. 10