Introduction to MSA
MeasurementSystem Analysis (MSA) is a robust methodology to assess the variability inherent within a measurement process. Its
primary goal is to ensure the reliability and integrity of data, which is crucial for informed decision-making in any quality-driven
environment.
Systematic Assessment
Analyzes measurement process
components.
Data Reliability
Confirms trustworthiness of
collected data.
Informed Decisions
Supports robust conclusions based
on valid data.
3.
Why MSA Matters
Inaccuratemeasurements lead to erroneous conclusions, undermining
process control, capability studies, and product acceptance. MSA is
pivotal for maintaining consistent product quality and avoiding costly
errors.
Poor measurement equals poor quality decisions. This directly impacts process control and product acceptance.
4.
Key Elements ofMSA
Accuracy (Bias)
How close measurements are to the true
value.
Precision
Consistency of repeated measurements.
Stability
Measurements consistent over time.
Linearity
Accuracy across the measurement range.
Resolution
Smallest detectable change.
5.
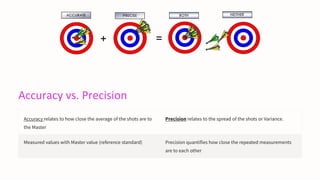
Accuracy vs. Precision
Accuracyrelates to how close the average of the shots are to
the Master
Precision relates to the spread of the shots or Variance.
Measured values with Master value (reference standard) Precision quantifies how close the repeated measurements
are to each other
6.
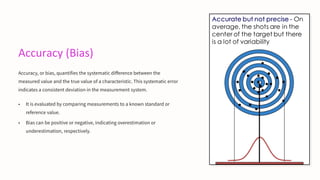
Accuracy (Bias)
Accuracy, orbias, quantifies the systematic difference between the
measured value and the true value of a characteristic. This systematic error
indicates a consistent deviation in the measurement system.
• It is evaluated by comparing measurements to a known standard or
reference value.
• Bias can be positive or negative, indicating overestimation or
underestimation, respectively.
7.
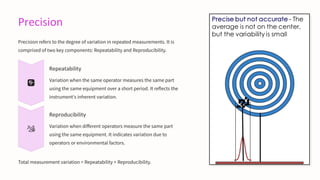
Precision
Precision refers tothe degree of variation in repeated measurements. It is
comprised of two key components: Repeatability and Reproducibility.
Repeatability
Variation when the same operator measures the same part
using the same equipment over a short period. It reflects the
instrument's inherent variation.
Reproducibility
Variation when different operators measure the same part
using the same equipment. It indicates variation due to
operators or environmental factors.
Total measurement variation = Repeatability + Reproducibility.
8.
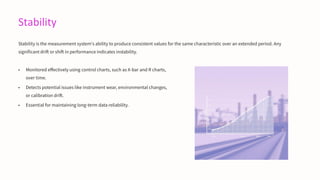
Stability
Stability is themeasurement system's ability to produce consistent values for the same characteristic over an extended period. Any
significant drift or shift in performance indicates instability.
• Monitored effectively using control charts, such as X-bar and R charts,
over time.
• Detects potential issues like instrument wear, environmental changes,
or calibration drift.
• Essential for maintaining long-term data reliability.
9.
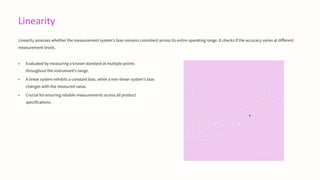
Linearity
Linearity assesses whetherthe measurement system's bias remains consistent across its entire operating range. It checks if the accuracy varies at different
measurement levels.
• Evaluated by measuring a known standard at multiple points
throughout the instrument's range.
• A linear system exhibits a constant bias, while a non-linear system's bias
changes with the measured value.
• Crucial for ensuring reliable measurements across all product
specifications.
10.
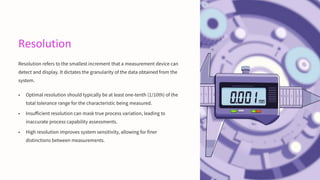
Resolution
Resolution refers tothe smallest increment that a measurement device can
detect and display. It dictates the granularity of the data obtained from the
system.
• Optimal resolution should typically be at least one-tenth (1/10th) of the
total tolerance range for the characteristic being measured.
• Insufficient resolution can mask true process variation, leading to
inaccurate process capability assessments.
• High resolution improves system sensitivity, allowing for finer
distinctions between measurements.
11.
Types of MSAStudies
Gage R& R (Variable data)
Assesses repeatability and reproducibility for continuous data.
Bias Study
Determines the systematic error relative to a known standard.
Linearity Study
Evaluates bias consistency across the measurement range.
Stability Study
Monitors measurement system performance over time using control charts.
Attribute Agreement Analysis (Attribute data)
Assesses agreement among appraisers for discrete or categorical data.
12.
Gauge R& ROverview
Gauge Repeatability and Reproducibility (R&R) is a crucial study within Measurement System Analysis (MSA) that quantifies the
variation attributed to the measurement system itself.
Quantifies Measurement
Variation
Identifies how much observed
variability in data is due to the
measurement system versus the
actual process or product.
Determines System
Acceptability
Helps decide if the measurement
system is adequate for its intended
application based on predefined
criteria.
Key Methodologies Used
Primarily analyzed using the Average
& Range method or the more robust
ANOVA method for a comprehensive
assessment.
13.
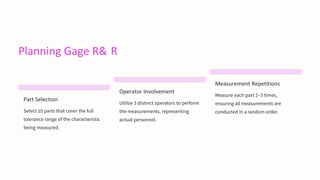
Planning Gage R&R
Part Selection
Select 10 parts that cover the full
tolerance range of the characteristic
being measured.
Operator Involvement
Utilize 3 distinct operators to perform
the measurements, representing
actual personnel.
Measurement Repetitions
Measure each part 2–3 times,
ensuring all measurements are
conducted in a random order.
14.
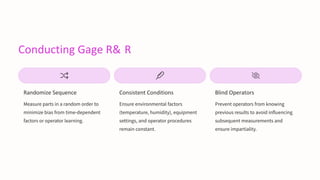
Conducting Gage R&R
Randomize Sequence
Measure parts in a random order to
minimize bias from time-dependent
factors or operator learning.
Consistent Conditions
Ensure environmental factors
(temperature, humidity), equipment
settings, and operator procedures
remain constant.
Blind Operators
Prevent operators from knowing
previous results to avoid influencing
subsequent measurements and
ensure impartiality.
15.
Analyzing Gage R&R
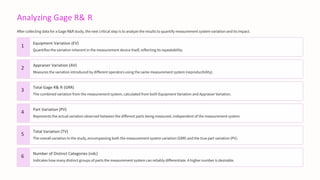
After collecting data for a Gage R&R study, the next critical step is to analyze the results to quantify measurement system variation and its impact.
1
Equipment Variation (EV)
Quantifies the variation inherent in the measurement device itself, reflecting its repeatability.
2
Appraiser Variation (AV)
Measures the variation introduced by different operators using the same measurement system (reproducibility).
3
Total Gage R& R (GRR)
The combined variation from the measurement system, calculated from both Equipment Variation and Appraiser Variation.
4
Part Variation (PV)
Represents the actual variation observed between the different parts being measured, independent of the measurement system.
5
Total Variation (TV)
The overall variation in the study, encompassing both the measurement system variation (GRR) and the true part variation (PV).
6
Number of Distinct Categories (ndc)
Indicates how many distinct groups of parts the measurement system can reliably differentiate. A higher number is desirable.
17.
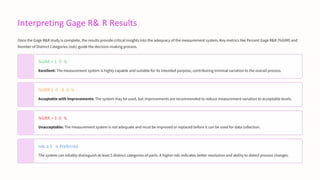
Interpreting Gage R&R Results
Once the Gage R&R study is complete, the results provide critical insights into the adequacy of the measurement system. Key metrics like Percent Gage R&R (%GRR) and
Number of Distinct Categories (ndc) guide the decision-making process.
%GRR < 1 0 %
Excellent: The measurement system is highly capable and suitable for its intended purpose, contributing minimal variation to the overall process.
%GRR 1 0 -3 0 %
Acceptable with Improvements: The system may be used, but improvements are recommended to reduce measurement variation to acceptable levels.
%GRR > 3 0 %
Unacceptable: The measurement system is not adequate and must be improved or replaced before it can be used for data collection.
ndc ≥ 5 is Preferred
The system can reliably distinguish at least 5 distinct categories of parts. A higher ndc indicates better resolution and ability to detect process changes.
18.
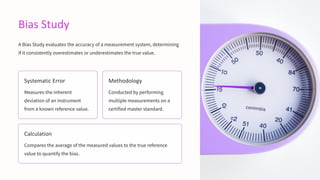
Bias Study
A BiasStudy evaluates the accuracy of a measurement system, determining
if it consistently overestimates or underestimates the true value.
Systematic Error
Measures the inherent
deviation of an instrument
from a known reference value.
Methodology
Conducted by performing
multiple measurements on a
certified master standard.
Calculation
Compares the average of the measured values to the true reference
value to quantify the bias.
19.
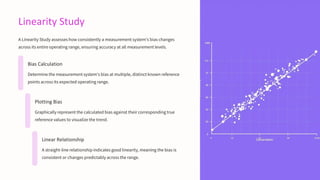
Linearity Study
A LinearityStudy assesses how consistently a measurement system's bias changes
across its entire operating range, ensuring accuracy at all measurement levels.
Bias Calculation
Determine the measurement system's bias at multiple, distinct known reference
points across its expected operating range.
Plotting Bias
Graphically represent the calculated bias against their corresponding true
reference values to visualize the trend.
Linear Relationship
A straight-line relationship indicates good linearity, meaning the bias is
consistent or changes predictably across the range.
20.
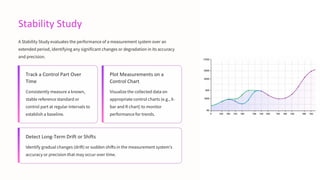
Stability Study
A StabilityStudy evaluates the performance of a measurement system over an
extended period, identifying any significant changes or degradation in its accuracy
and precision.
Track a Control Part Over
Time
Consistently measure a known,
stable reference standard or
control part at regular intervals to
establish a baseline.
Plot Measurements on a
Control Chart
Visualize the collected data on
appropriate control charts (e.g., X-
bar and R chart) to monitor
performance for trends.
Detect Long-Term Drift or Shifts
Identify gradual changes (drift) or sudden shifts in the measurement system's
accuracy or precision that may occur over time.
21.
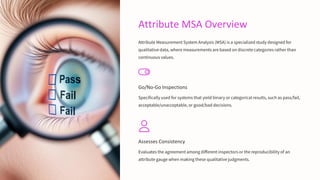
Attribute MSA Overview
AttributeMeasurement System Analysis (MSA) is a specialized study designed for
qualitative data, where measurements are based on discrete categories rather than
continuous values.
Go/No-Go Inspections
Specifically used for systems that yield binary or categorical results, such as pass/fail,
acceptable/unacceptable, or good/bad decisions.
Assesses Consistency
Evaluates the agreement among different inspectors or the reproducibility of an
attribute gauge when making these qualitative judgments.
22.
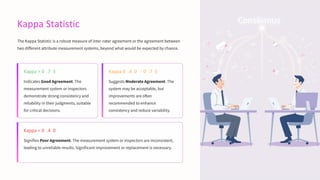
Kappa Statistic
The KappaStatistic is a robust measure of inter-rater agreement or the agreement between
two different attribute measurement systems, beyond what would be expected by chance.
Kappa > 0 .7 5
Indicates Good Agreement. The
measurement system or inspectors
demonstrate strong consistency and
reliability in their judgments, suitable
for critical decisions.
Kappa 0 .4 0 - 0 .7 5
Suggests Moderate Agreement. The
system may be acceptable, but
improvements are often
recommended to enhance
consistency and reduce variability.
Kappa < 0 .4 0
Signifies Poor Agreement. The measurement system or inspectors are inconsistent,
leading to unreliable results. Significant improvement or replacement is necessary.
23.
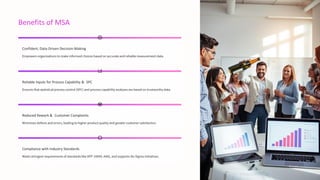
Benefits of MSA
Confident,Data-Driven Decision-Making
Empowers organizations to make informed choices based on accurate and reliable measurement data.
Reliable Inputs for Process Capability & SPC
Ensures that statistical process control (SPC) and process capability analyses are based on trustworthy data.
Reduced Rework & Customer Complaints
Minimizes defects and errors, leading to higher product quality and greater customer satisfaction.
Compliance with Industry Standards
Meets stringent requirements of standards like IATF 16949, AIAG, and supports Six Sigma initiatives.
24.
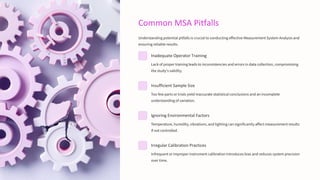
Common MSA Pitfalls
Understandingpotential pitfalls is crucial to conducting effective Measurement System Analysis and
ensuring reliable results.
Inadequate Operator Training
Lack of proper training leads to inconsistencies and errors in data collection, compromising
the study's validity.
Insufficient Sample Size
Too few parts or trials yield inaccurate statistical conclusions and an incomplete
understanding of variation.
Ignoring Environmental Factors
Temperature, humidity, vibrations, and lighting can significantly affect measurement results
if not controlled.
Irregular Calibration Practices
Infrequent or improper instrument calibration introduces bias and reduces system precision
over time.
25.
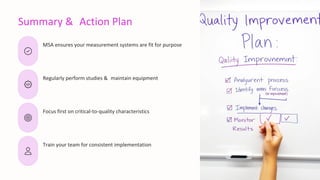
Summary & ActionPlan
MSA ensures your measurement systems are fit for purpose
Regularly perform studies & maintain equipment
Focus first on critical-to-quality characteristics
Train your team for consistent implementation
26.
Thank You!
“You can’timprove what you can’t measure — and you can’t trust a
measurement system that hasn’t been analyzed.”
Questions? Feel free to ask!