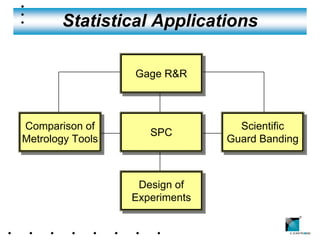
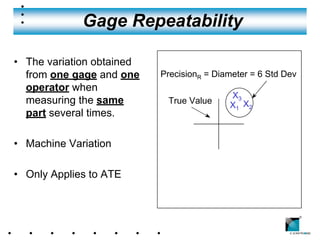
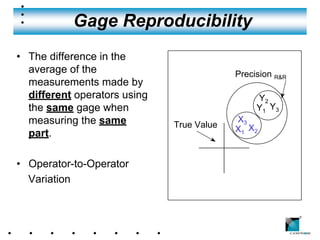
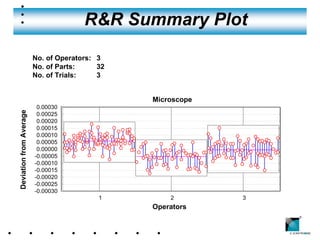
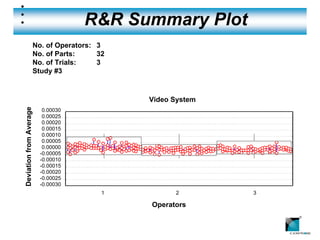
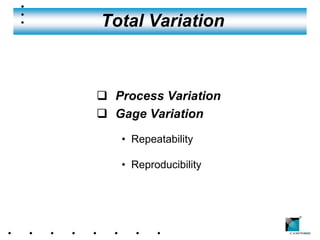
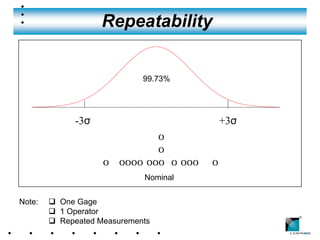
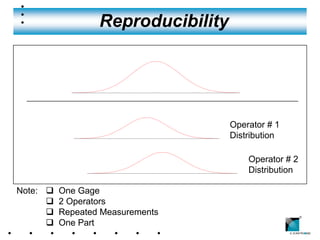
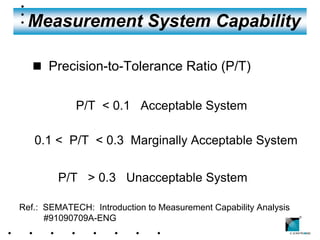
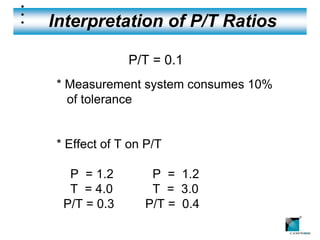
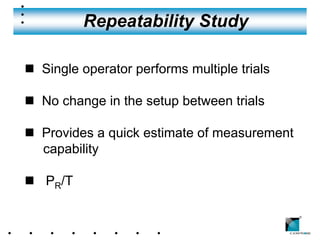
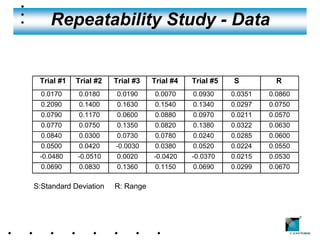
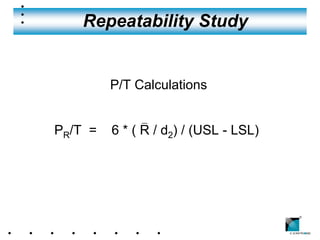
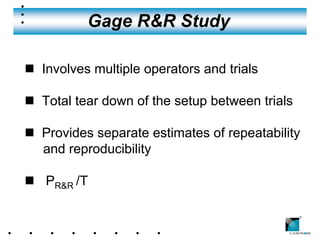
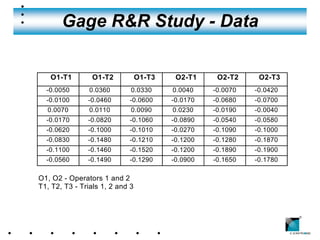
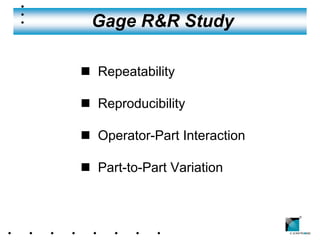
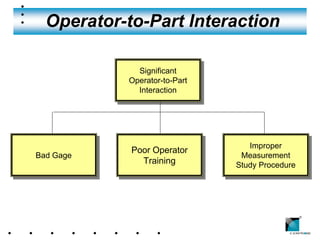
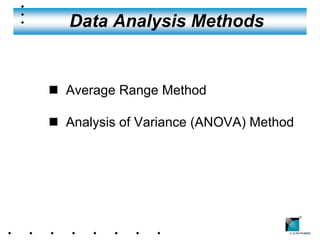
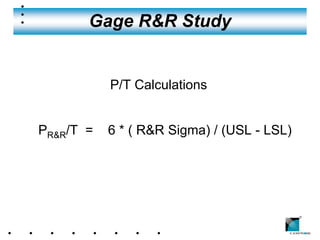
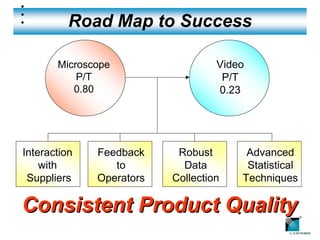
Southwest Test Conference


 Introduction to
Gage R&R Studies
  The Key to Understanding
   Measurement Systems

                     By
    Hank Scutoski & Chander Sekar, Ph.D.
       CERPROBE CORPORATION                ®

              Gilbert, Arizona
Speakers


q   Hank Scutoski                q   Chander Sekar, Ph.D.
– VP Quality                     – Corporate Statistician
– 30 Years Experience            – 23 Years Experience
– TI, Motorola, Cerprobe         – Professor of Statistics at
– Motorola University’s            the University of
  Six Sigma Research Institute     Madras, India
– Certified Quality Engineer     – 3 Degrees in Statistics
– Certified Quality Auditor      – Certified Quality Engineer


                                                            ®
Cerprobe’s Philosophy


We must determine the uncertainty of
our measurement systems before we
can compare, control or optimize our
     manufacturing processes.


                                       ®
Studies Completed

85 Studies to Date Including:

  –   Tip Diameter
  –   Tip Length
  –   Contact Force
  –   Probe Tip Alignment
  –   Planarity
  –   Contact Resistance
  –   Leakage

                                ®
Benefits
n   Validates consistent results between:
       q   Cerprobe’s many manufacturing facilities
       q   Cerprobe & customer sites

n   Provides for “Dock to Stock” certification

n   Provides feedback to Cerprobe’s suppliers.

n   Able to provide customer with quality products
    with statistical consulting support.
                                                      ®
Statistical Applications

                  Gage R&R
                  Gage R&R


Comparison of
 Comparison of                    Scientific
                                   Scientific
                     SPC
                     SPC
Metrology Tools
Metrology Tools                 Guard Banding
                                Guard Banding


                   Design of
                   Design of
                  Experiments
                  Experiments
                                            ®
Gage Repeatability

• The variation obtained
  from one gage and one    PrecisionR = Diameter = 6 Std Dev
  operator when
                                           X3
  measuring the same        True Value     X1 X2
  part several times.

• Machine Variation

• Only Applies to ATE


                                                               ®
Gage Reproducibility
• The difference in the
  average of the                           Precision R&R
  measurements made by
  different operators using                     Y2
  the same gage when                            Y1 Y3
  measuring the same                       X3
                              True Value   X1 X2
  part.

• Operator-to-Operator
  Variation


                                                           ®
R&R Summary Plot
                         No. of Operators: 3
                         No. of Parts:     32
                         No. of Trials:    3


                                                Microscope
                          0.00030
Deviation from Average


                          0.00025
                          0.00020
                          0.00015
                          0.00010
                          0.00005
                          0.00000
                         -0.00005
                         -0.00010
                         -0.00015
                         -0.00020
                         -0.00025
                         -0.00030
                                           1        2        3
                                                Operators
                                                                 ®
R&R Summary Plot
                         No. of Operators: 3
                         No. of Parts:     32
                         No. of Trials:    3
                         Study #3


                                                Video System
Deviation from Average


                            0.00030
                            0.00025
                            0.00020
                            0.00015
                            0.00010
                            0.00005
                            0.00000
                           -0.00005
                           -0.00010
                           -0.00015
                           -0.00020
                           -0.00025
                           -0.00030
                                            1         2        3

                                                Operators
                                                                   ®
Total Variation


q Process Variation
q Gage Variation
   • Repeatability

   • Reproducibility


                       ®
Repeatability


                             99.73%


              -3σ                          +3σ
                             o
                             o
                    o oooo ooo o ooo   o
                             Nominal


Note:   q One Gage
        q 1 Operator
                                                 ®
        q Repeated Measurements
Reproducibility


                                    Operator # 1
                                    Distribution

                                        Operator # 2
                                        Distribution

Note: q   One Gage
      q   2 Operators
      q   Repeated Measurements                        ®

      q   One Part
Measurement System Capability

   n Precision-to-Tolerance Ratio (P/T)


             P/T < 0.1 Acceptable System

   0.1 < P/T < 0.3 Marginally Acceptable System


         P/T > 0.3 Unacceptable System

Ref.: SEMATECH: Introduction to Measurement Capability Analysis
      #91090709A-ENG                                              ®
Interpretation of P/T Ratios

             P/T = 0.1
* Measurement system consumes 10%
  of tolerance


* Effect of T on P/T

  P = 1.2        P = 1.2
  T = 4.0        T = 3.0
 P/T = 0.3      P/T = 0.4
                                    ®
Repeatability Study

n Single operator performs multiple trials

n No change in the setup between trials

n Provides a quick estimate of measurement
  capability

n PR/T

                                             ®
Repeatability Study - Data

            Sample data on Align (x) from a repeatability study

 Trial #1   Trial #2   Trial #3   Trial #4   Trial #5   S           R
  0.0170     0.0180    0.0190     0.0070     0.0930     0.0351    0.0860
  0.2090     0.1400    0.1630     0.1540     0.1340     0.0297    0.0750
  0.0790     0.1170    0.0600     0.0880     0.0970     0.0211    0.0570
  0.0770     0.0750    0.1350     0.0820     0.1380     0.0322    0.0630
  0.0840     0.0300    0.0730     0.0780     0.0240     0.0285    0.0600
  0.0500     0.0420    -0.0030    0.0380     0.0520     0.0224    0.0550
 -0.0480    -0.0510    0.0020     -0.0420    -0.0370    0.0215    0.0530
  0.0690     0.0830    0.1360     0.1150     0.0690     0.0299    0.0670

S:Standard Deviation   R: Range


                                                                           ®
Repeatability Study


         P/T Calculations

              _
PR/T =   6 * ( R / d2) / (USL - LSL)


                                       ®
Gage R&R Study

n Involves multiple operators and trials

n Total tear down of the setup between trials

n Provides separate estimates of repeatability
  and reproducibility

n PR&R /T

                                                ®
Gage R&R Study - Data

        Sample data on Align (x) from a full gage R & R study

   O1-T1        O1-T2            O1-T3    O2-T1     O2-T2       O2-T3
  -0.0050       0.0360       0.0330      0.0040    -0.0070   -0.0420
  -0.0100      -0.0460      -0.0600      -0.0170   -0.0680   -0.0700
  0.0070        0.0110       0.0090      0.0230    -0.0190   -0.0040
  -0.0170      -0.0820      -0.1060      -0.0890   -0.0540   -0.0580
  -0.0620      -0.1000      -0.1010      -0.0270   -0.1090   -0.1000
  -0.0830      -0.1480      -0.1210      -0.1200   -0.1280   -0.1870
  -0.1100      -0.1460      -0.1520      -0.1200   -0.1890   -0.1900
  -0.0560      -0.1490      -0.1290      -0.0900   -0.1650   -0.1780

O1, O2 - Operators 1 and 2
T1, T2, T3 - Trials 1, 2 and 3


                                                                        ®
Gage R&R Study

n Repeatability

n Reproducibility

n Operator-Part Interaction

n Part-to-Part Variation


                              ®
Operator-to-Part Interaction

             Significant
              Significant
           Operator-to-Part
           Operator-to-Part
             Interaction
              Interaction


                                 Improper
                                  Improper
            Poor Operator
            Poor Operator
Bad Gage
Bad Gage                       Measurement
                                Measurement
              Training
               Training       Study Procedure
                              Study Procedure


                                                ®
Data Analysis Methods


n Average Range Method

n Analysis of Variance (ANOVA) Method


                                        ®
Gage R&R Study


           P/T Calculations


PR&R/T =   6 * ( R&R Sigma) / (USL - LSL)


                                            ®
Road Map to Success

       Microscope                  Video
           P/T                      P/T
          0.80                     0.23


Interaction   Feedback     Robust       Advanced
    with         to         Data        Statistical
 Suppliers    Operators   Collection   Techniques

Consistent Product Quality                            ®

Gage r&r

  • 1.
    Southwest Test Conference Introduction to Gage R&R Studies The Key to Understanding Measurement Systems By Hank Scutoski & Chander Sekar, Ph.D. CERPROBE CORPORATION ® Gilbert, Arizona
  • 2.
    Speakers q Hank Scutoski q Chander Sekar, Ph.D. – VP Quality – Corporate Statistician – 30 Years Experience – 23 Years Experience – TI, Motorola, Cerprobe – Professor of Statistics at – Motorola University’s the University of Six Sigma Research Institute Madras, India – Certified Quality Engineer – 3 Degrees in Statistics – Certified Quality Auditor – Certified Quality Engineer ®
  • 3.
    Cerprobe’s Philosophy We mustdetermine the uncertainty of our measurement systems before we can compare, control or optimize our manufacturing processes. ®
  • 4.
    Studies Completed 85 Studiesto Date Including: – Tip Diameter – Tip Length – Contact Force – Probe Tip Alignment – Planarity – Contact Resistance – Leakage ®
  • 5.
    Benefits n Validates consistent results between: q Cerprobe’s many manufacturing facilities q Cerprobe & customer sites n Provides for “Dock to Stock” certification n Provides feedback to Cerprobe’s suppliers. n Able to provide customer with quality products with statistical consulting support. ®
  • 6.
    Statistical Applications Gage R&R Gage R&R Comparison of Comparison of Scientific Scientific SPC SPC Metrology Tools Metrology Tools Guard Banding Guard Banding Design of Design of Experiments Experiments ®
  • 7.
    Gage Repeatability • Thevariation obtained from one gage and one PrecisionR = Diameter = 6 Std Dev operator when X3 measuring the same True Value X1 X2 part several times. • Machine Variation • Only Applies to ATE ®
  • 8.
    Gage Reproducibility • Thedifference in the average of the Precision R&R measurements made by different operators using Y2 the same gage when Y1 Y3 measuring the same X3 True Value X1 X2 part. • Operator-to-Operator Variation ®
  • 9.
    R&R Summary Plot No. of Operators: 3 No. of Parts: 32 No. of Trials: 3 Microscope 0.00030 Deviation from Average 0.00025 0.00020 0.00015 0.00010 0.00005 0.00000 -0.00005 -0.00010 -0.00015 -0.00020 -0.00025 -0.00030 1 2 3 Operators ®
  • 10.
    R&R Summary Plot No. of Operators: 3 No. of Parts: 32 No. of Trials: 3 Study #3 Video System Deviation from Average 0.00030 0.00025 0.00020 0.00015 0.00010 0.00005 0.00000 -0.00005 -0.00010 -0.00015 -0.00020 -0.00025 -0.00030 1 2 3 Operators ®
  • 11.
    Total Variation q ProcessVariation q Gage Variation • Repeatability • Reproducibility ®
  • 12.
    Repeatability 99.73% -3σ +3σ o o o oooo ooo o ooo o Nominal Note: q One Gage q 1 Operator ® q Repeated Measurements
  • 13.
    Reproducibility Operator # 1 Distribution Operator # 2 Distribution Note: q One Gage q 2 Operators q Repeated Measurements ® q One Part
  • 14.
    Measurement System Capability n Precision-to-Tolerance Ratio (P/T) P/T < 0.1 Acceptable System 0.1 < P/T < 0.3 Marginally Acceptable System P/T > 0.3 Unacceptable System Ref.: SEMATECH: Introduction to Measurement Capability Analysis #91090709A-ENG ®
  • 15.
    Interpretation of P/TRatios P/T = 0.1 * Measurement system consumes 10% of tolerance * Effect of T on P/T P = 1.2 P = 1.2 T = 4.0 T = 3.0 P/T = 0.3 P/T = 0.4 ®
  • 16.
    Repeatability Study n Singleoperator performs multiple trials n No change in the setup between trials n Provides a quick estimate of measurement capability n PR/T ®
  • 17.
    Repeatability Study -Data Sample data on Align (x) from a repeatability study Trial #1 Trial #2 Trial #3 Trial #4 Trial #5 S R 0.0170 0.0180 0.0190 0.0070 0.0930 0.0351 0.0860 0.2090 0.1400 0.1630 0.1540 0.1340 0.0297 0.0750 0.0790 0.1170 0.0600 0.0880 0.0970 0.0211 0.0570 0.0770 0.0750 0.1350 0.0820 0.1380 0.0322 0.0630 0.0840 0.0300 0.0730 0.0780 0.0240 0.0285 0.0600 0.0500 0.0420 -0.0030 0.0380 0.0520 0.0224 0.0550 -0.0480 -0.0510 0.0020 -0.0420 -0.0370 0.0215 0.0530 0.0690 0.0830 0.1360 0.1150 0.0690 0.0299 0.0670 S:Standard Deviation R: Range ®
  • 18.
    Repeatability Study P/T Calculations _ PR/T = 6 * ( R / d2) / (USL - LSL) ®
  • 19.
    Gage R&R Study nInvolves multiple operators and trials n Total tear down of the setup between trials n Provides separate estimates of repeatability and reproducibility n PR&R /T ®
  • 20.
    Gage R&R Study- Data Sample data on Align (x) from a full gage R & R study O1-T1 O1-T2 O1-T3 O2-T1 O2-T2 O2-T3 -0.0050 0.0360 0.0330 0.0040 -0.0070 -0.0420 -0.0100 -0.0460 -0.0600 -0.0170 -0.0680 -0.0700 0.0070 0.0110 0.0090 0.0230 -0.0190 -0.0040 -0.0170 -0.0820 -0.1060 -0.0890 -0.0540 -0.0580 -0.0620 -0.1000 -0.1010 -0.0270 -0.1090 -0.1000 -0.0830 -0.1480 -0.1210 -0.1200 -0.1280 -0.1870 -0.1100 -0.1460 -0.1520 -0.1200 -0.1890 -0.1900 -0.0560 -0.1490 -0.1290 -0.0900 -0.1650 -0.1780 O1, O2 - Operators 1 and 2 T1, T2, T3 - Trials 1, 2 and 3 ®
  • 21.
    Gage R&R Study nRepeatability n Reproducibility n Operator-Part Interaction n Part-to-Part Variation ®
  • 22.
    Operator-to-Part Interaction Significant Significant Operator-to-Part Operator-to-Part Interaction Interaction Improper Improper Poor Operator Poor Operator Bad Gage Bad Gage Measurement Measurement Training Training Study Procedure Study Procedure ®
  • 23.
    Data Analysis Methods nAverage Range Method n Analysis of Variance (ANOVA) Method ®
  • 24.
    Gage R&R Study P/T Calculations PR&R/T = 6 * ( R&R Sigma) / (USL - LSL) ®
  • 25.
    Road Map toSuccess Microscope Video P/T P/T 0.80 0.23 Interaction Feedback Robust Advanced with to Data Statistical Suppliers Operators Collection Techniques Consistent Product Quality ®