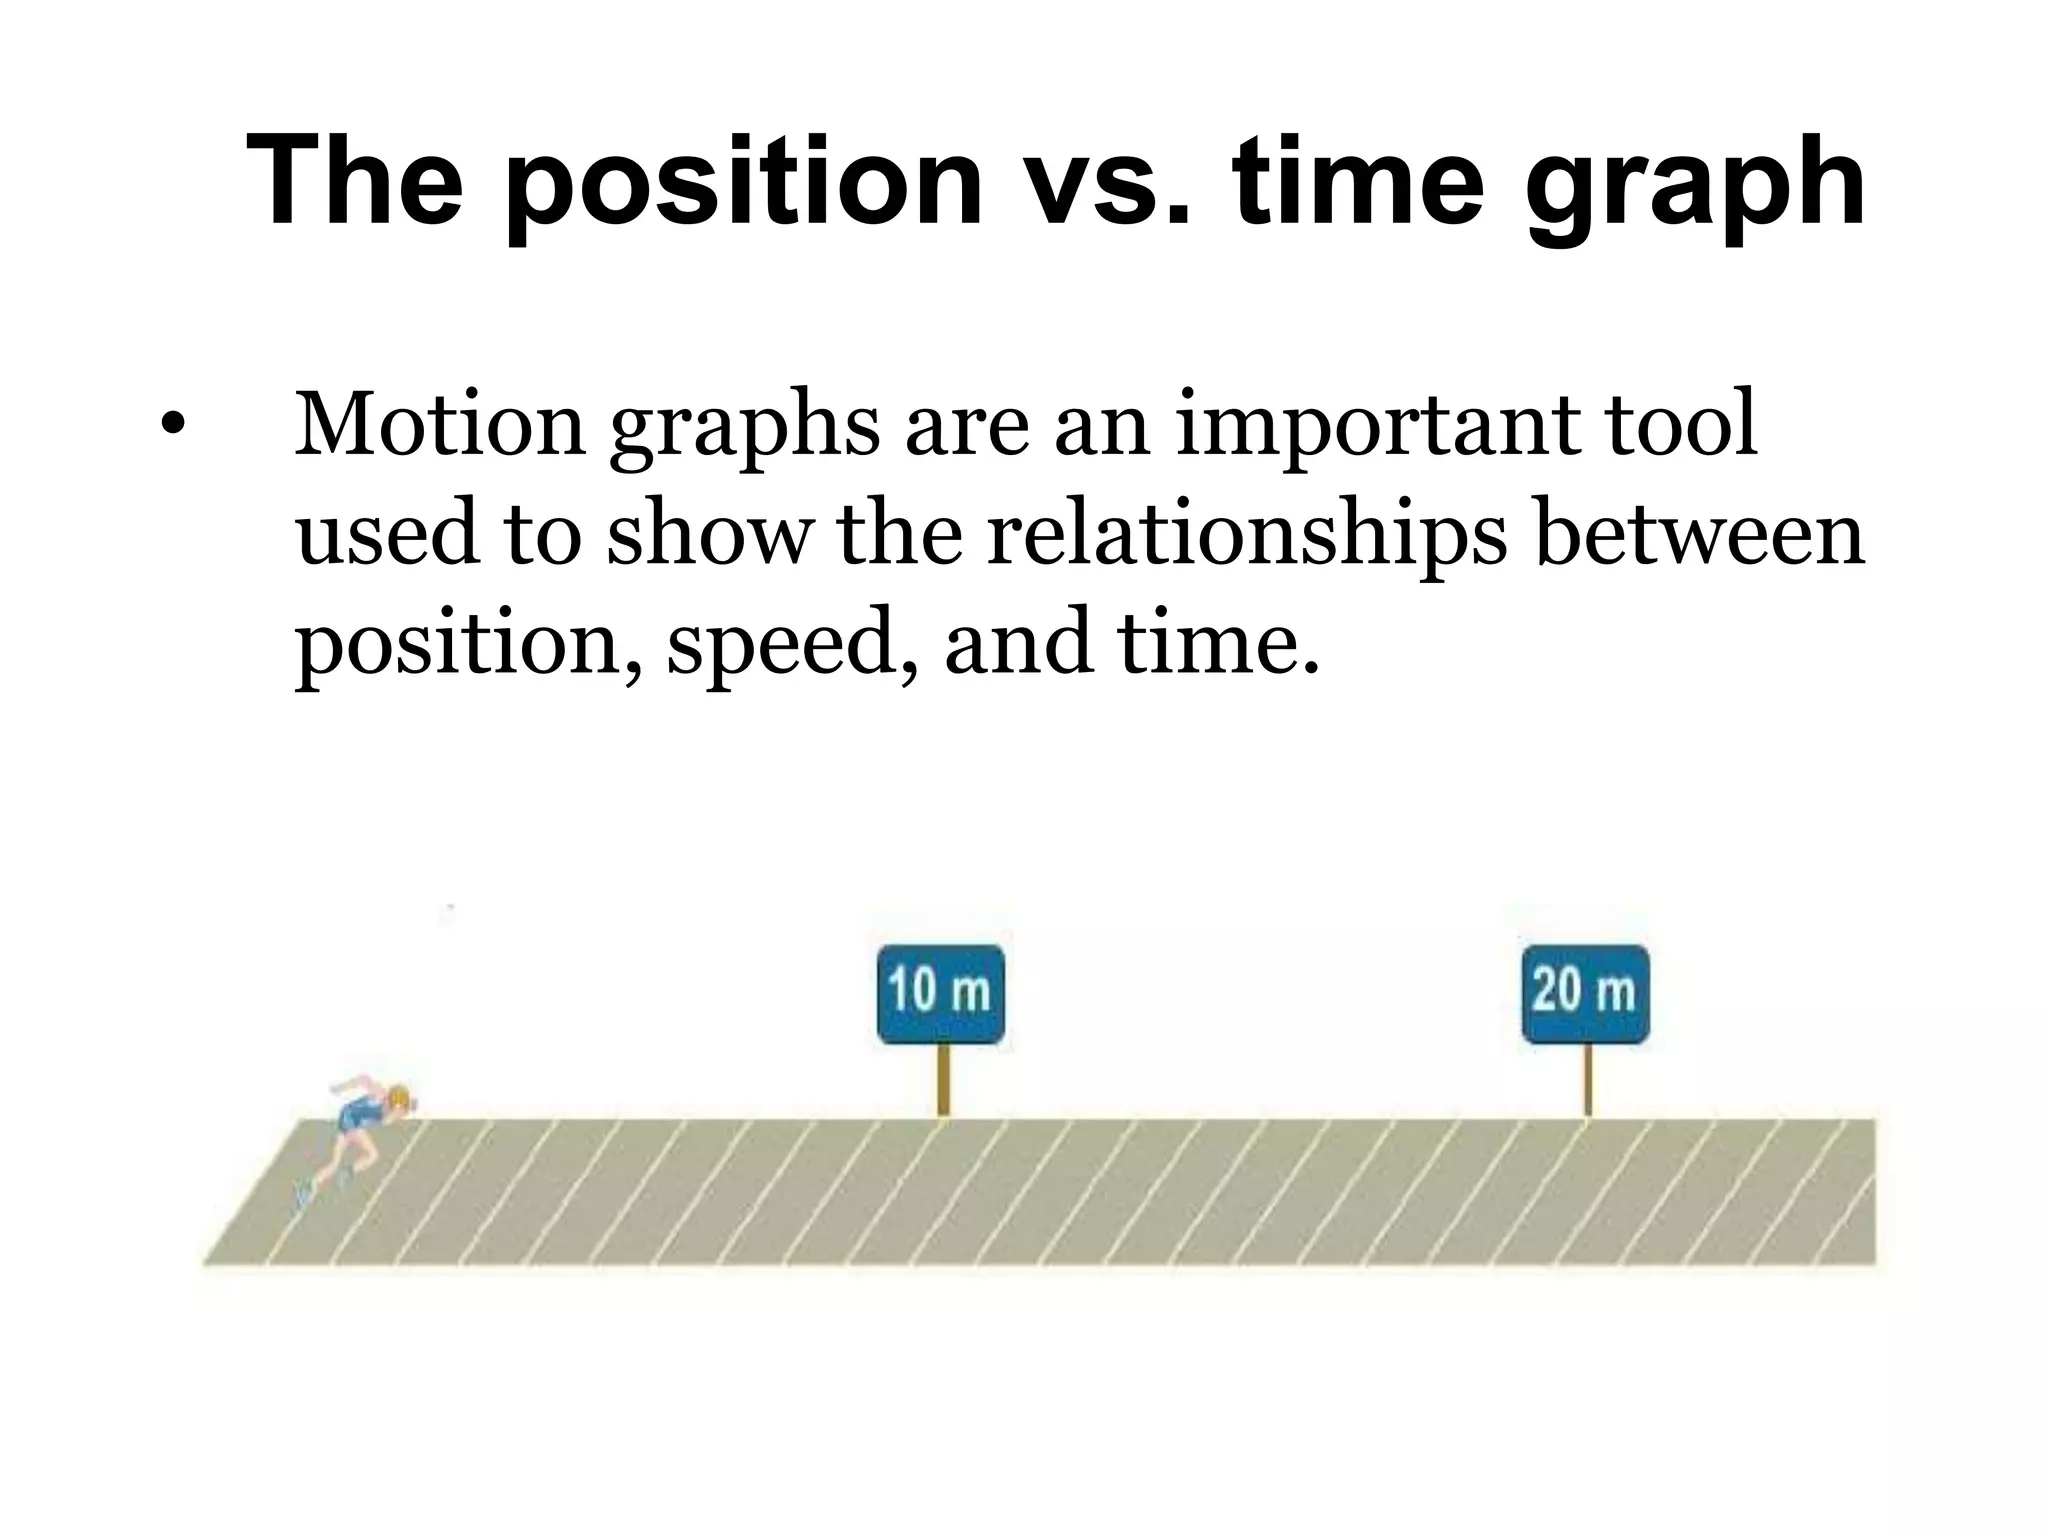
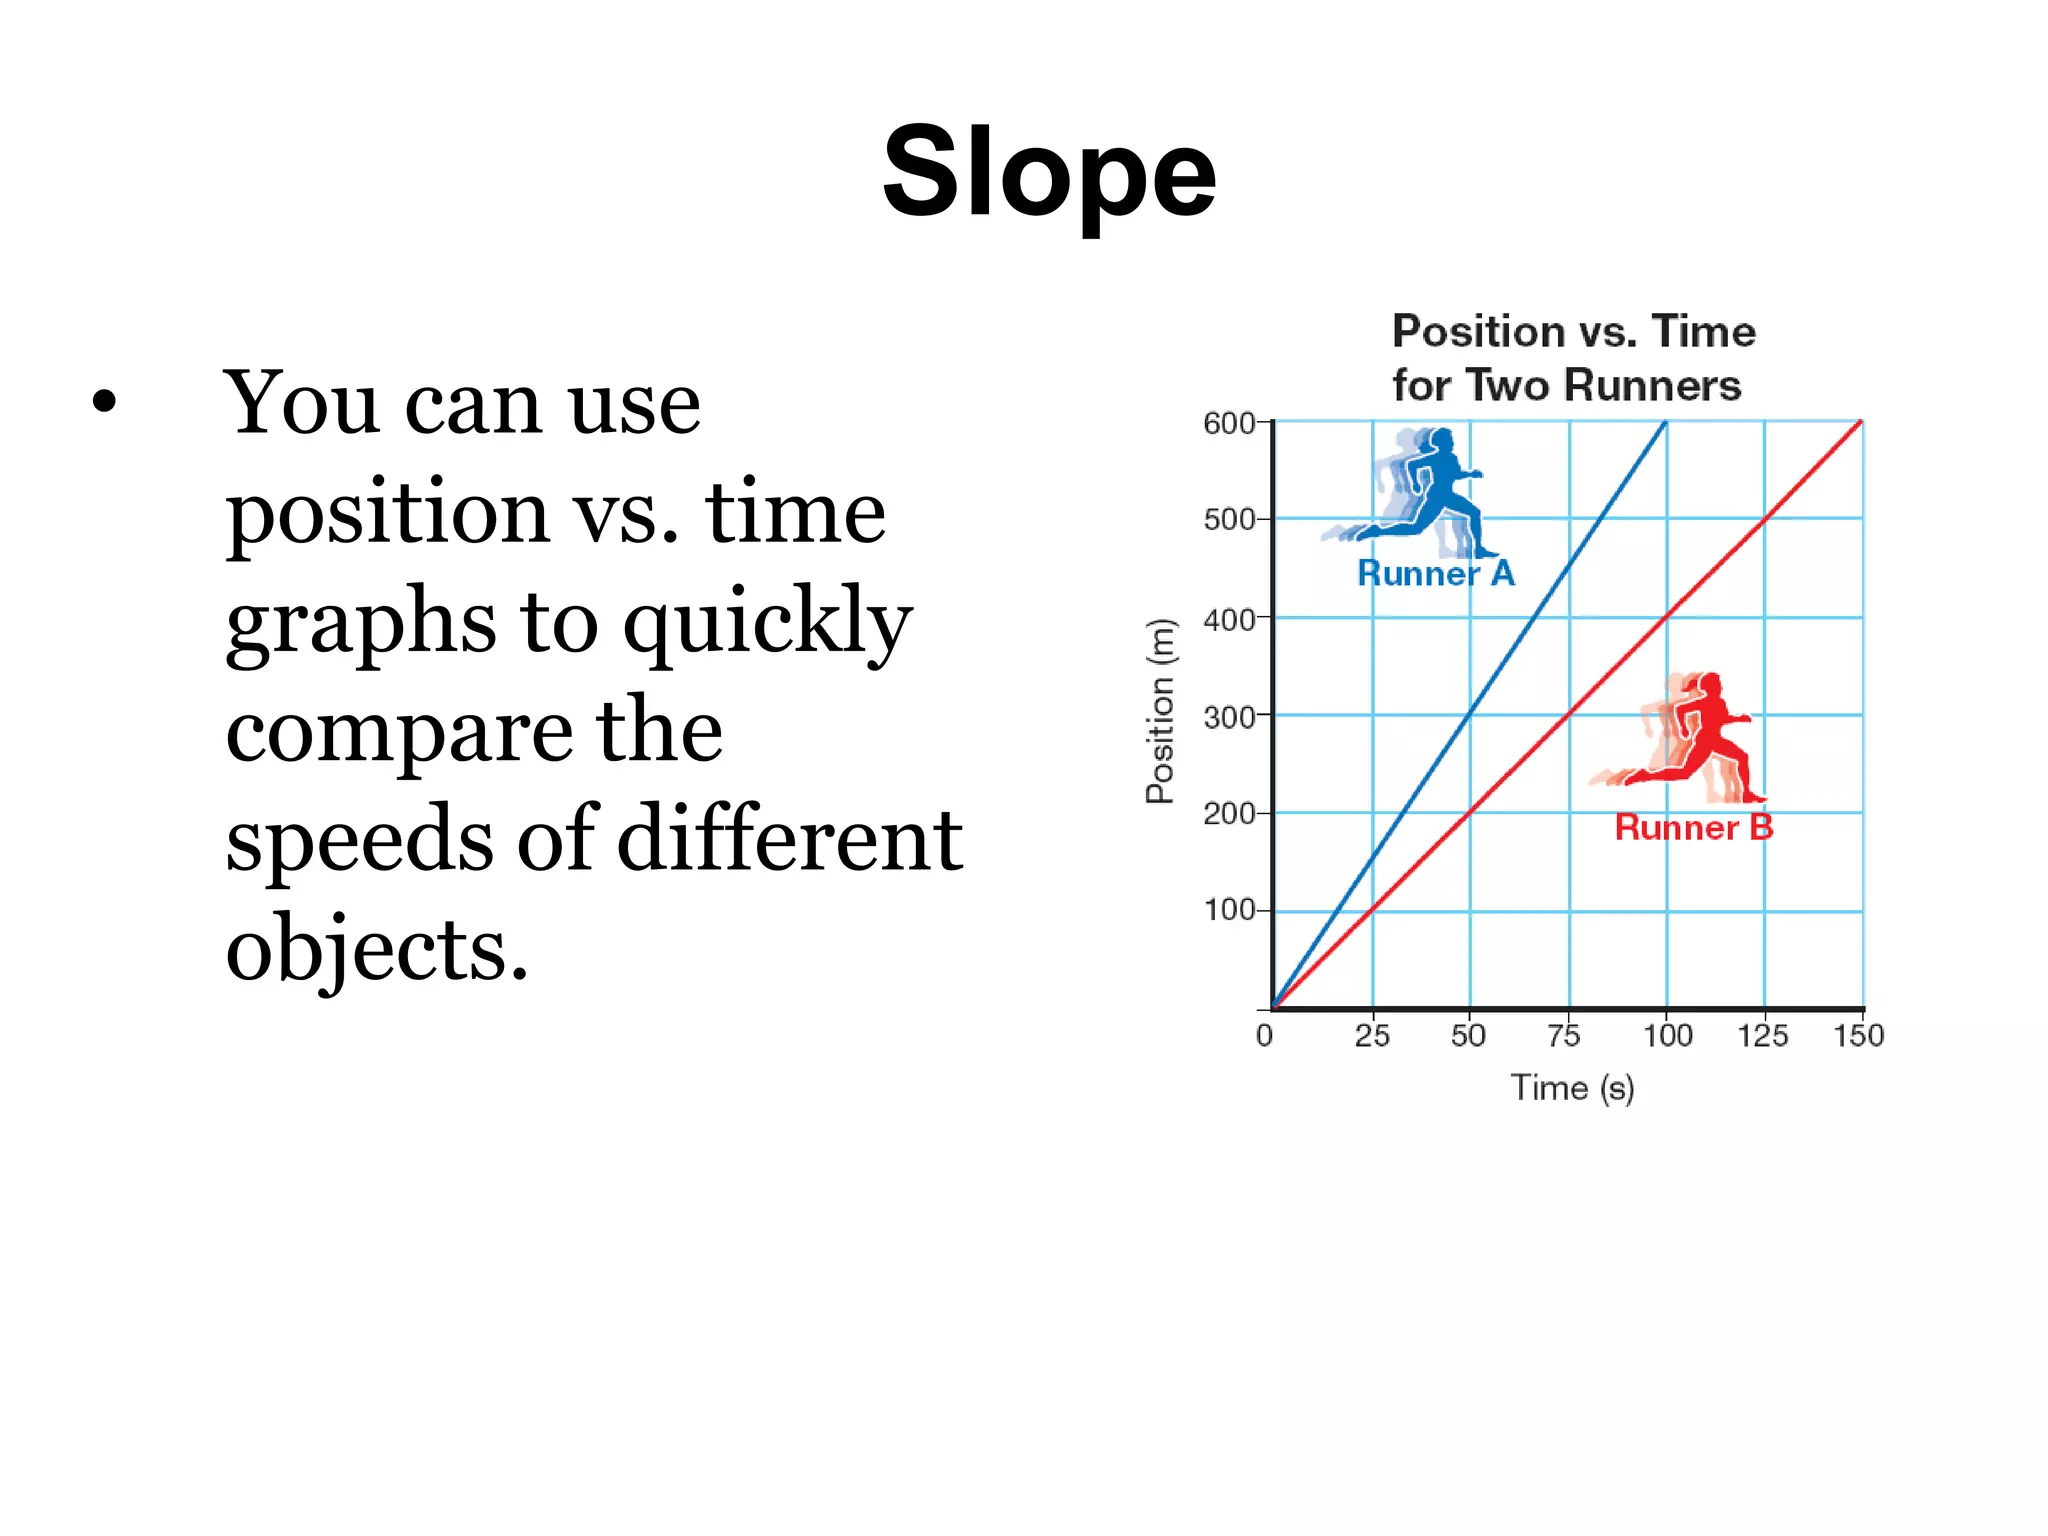
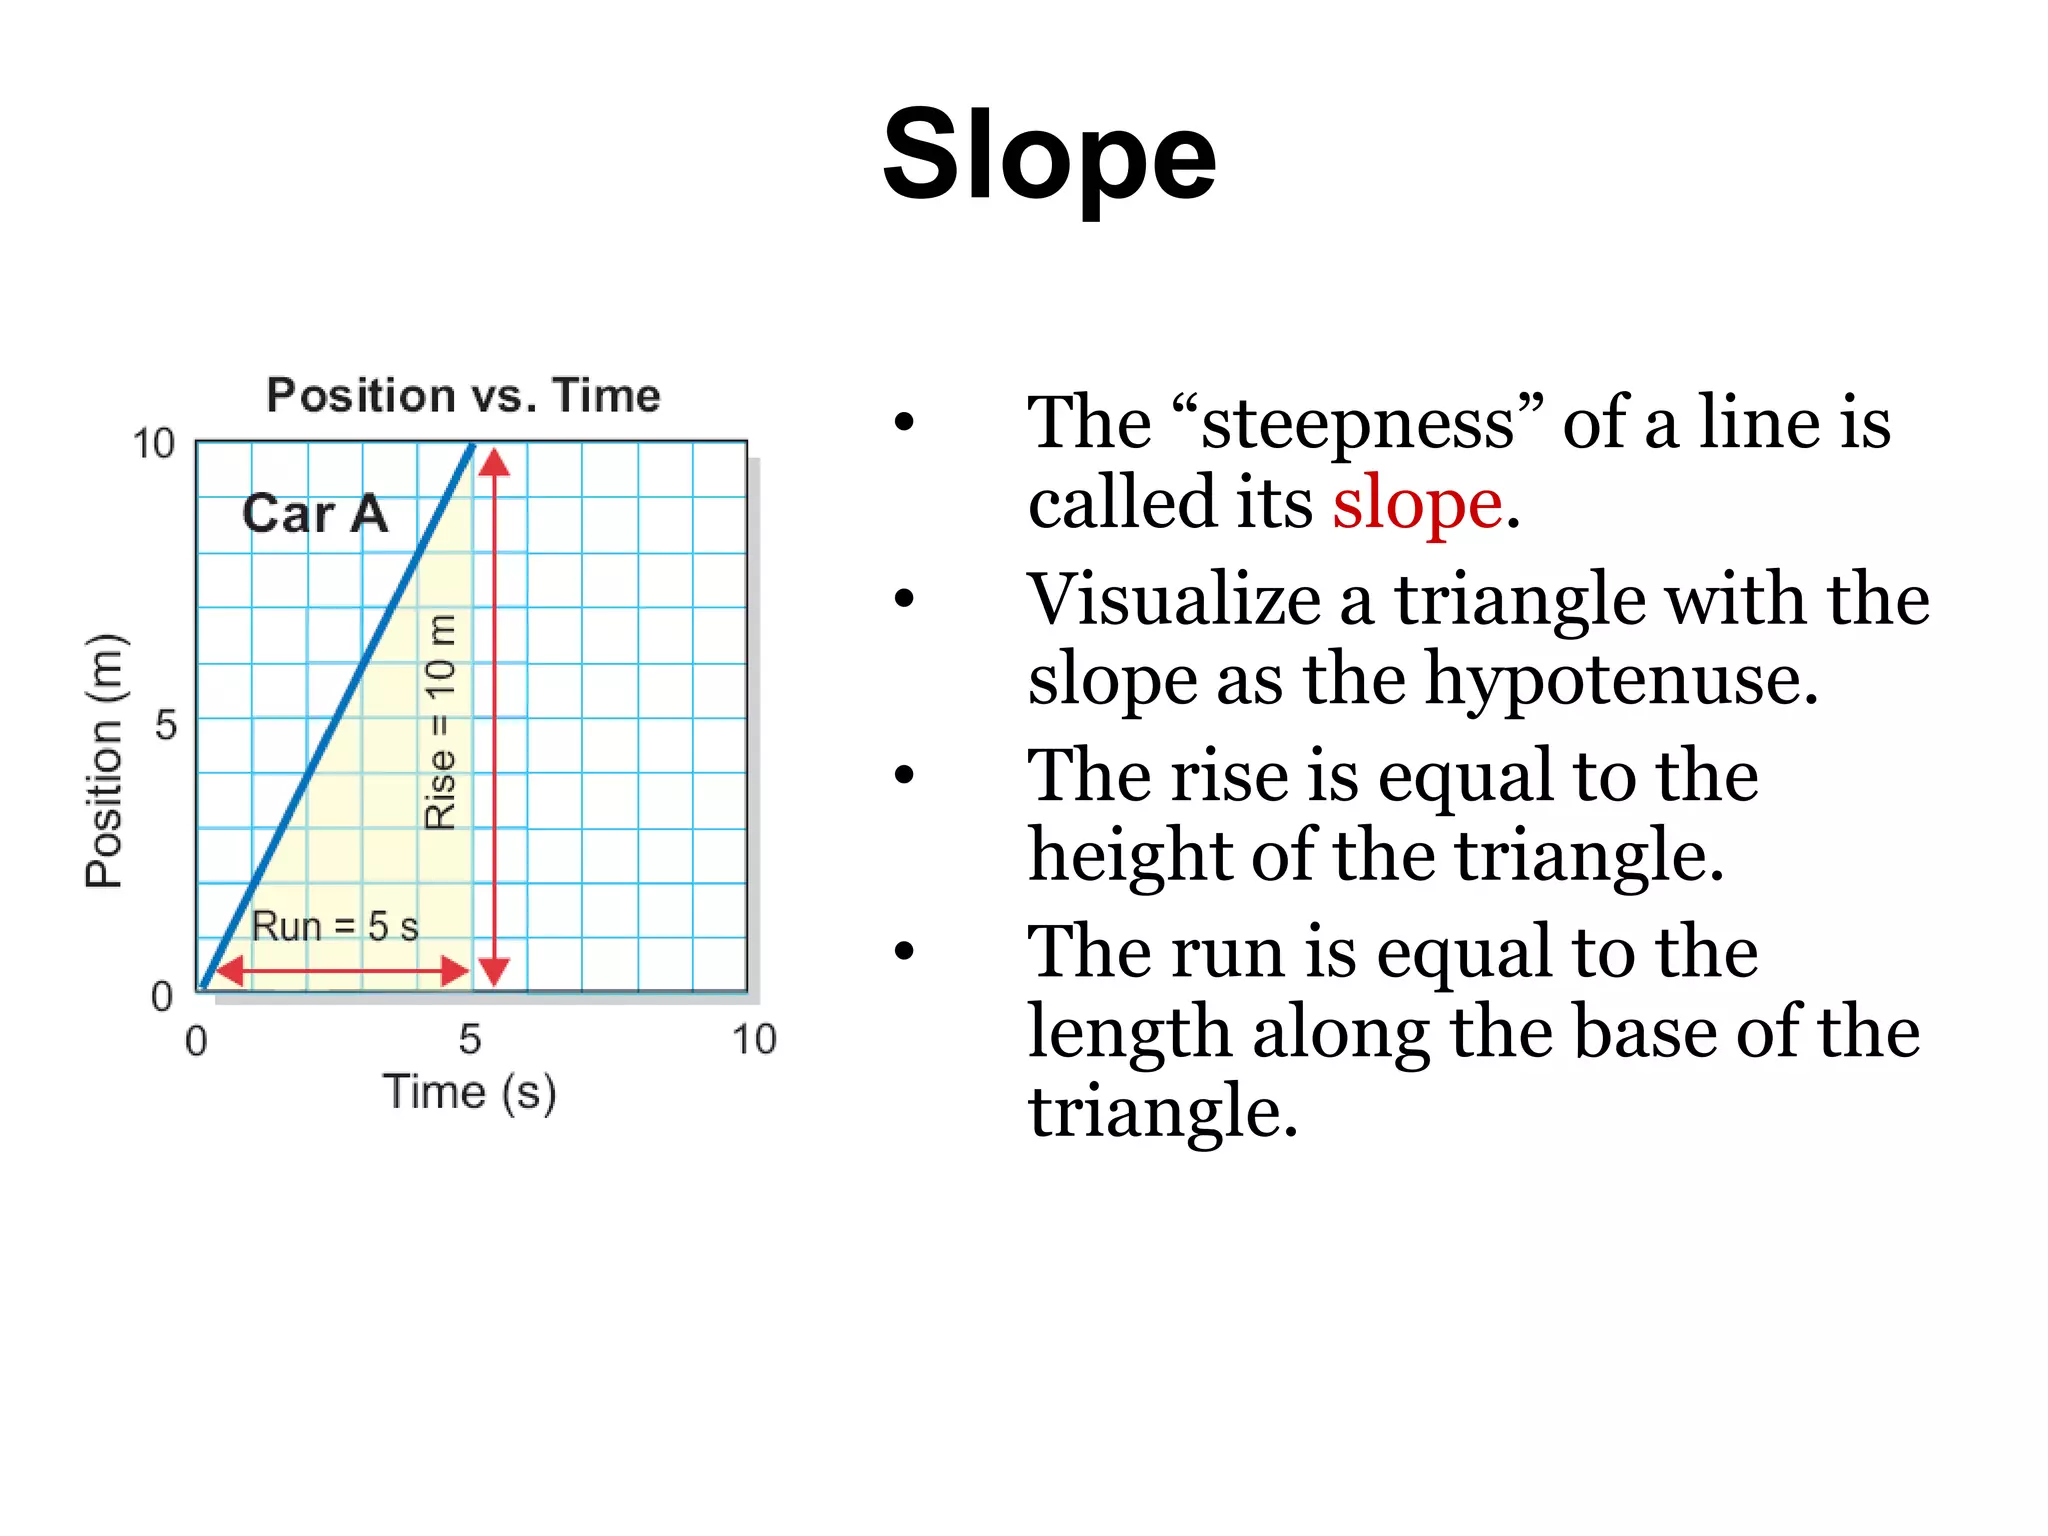
The position vs. time graph
• Motion graphs are an important tool
used to show the relationships between
position, speed, and time.
Graphs show relationships
• A good way to show a
relationship between two
variables is to use a
graph.
• A graph makes it easy to
see if changes in one
variable cause changes in
the other variable (the
effect).
The position vs. time graph
• To graph data, you
put position on the
vertical (y) axis .
• Time goes on the
horizontal (x) axis.
• Data are plotted
between x and y axis.
Copyright reserved. 2012 The E Tutor
The position vs. time graph
• An object moving
at a constant speed
always creates a
position vs. time
graph that is a
straight line.
The position vs. time graph
• Two variables may have:
– a strong relationship,
– a weak relationship,
– or no relationship at all.
Slope
• You can use
position vs. time
graphs to quickly
compare the
speeds of different
objects.
Slope
• The “steepness” of a line is
called its slope.
• Visualize a triangle with the
slope as the hypotenuse.
• The rise is equal to the
height of the triangle.
• The run is equal to the
length along the base of the
triangle.
Slope
• The slope is the ratio
of the “rise” (vertical
change) to the “run”
(horizontal change).
• The slope is
therefore a distance
divided by a
time, which equals
speed.
Speed vs. time graphs
• The position vs.
time graph has
position on the
y-axis and time
on the x-axis.
Which runner has the fastest constant speed?
Speed vs. time graphs
These graphs each show the same event.
What differences do you notice?
Do these graphs display the same data?
Calculating distance
• A speed vs. time graph can also be used to find
the distance the object has traveled.

GRAPHS OF MOTION.pptx

  • 2.
    The position vs.time graph • Motion graphs are an important tool used to show the relationships between position, speed, and time.
  • 3.
    Graphs show relationships •A good way to show a relationship between two variables is to use a graph. • A graph makes it easy to see if changes in one variable cause changes in the other variable (the effect).
  • 4.
    The position vs.time graph • To graph data, you put position on the vertical (y) axis . • Time goes on the horizontal (x) axis. • Data are plotted between x and y axis. Copyright reserved. 2012 The E Tutor
  • 5.
    The position vs.time graph • An object moving at a constant speed always creates a position vs. time graph that is a straight line.
  • 6.
    The position vs.time graph • Two variables may have: – a strong relationship, – a weak relationship, – or no relationship at all.
  • 12.
    Slope • You canuse position vs. time graphs to quickly compare the speeds of different objects.
  • 13.
    Slope • The “steepness”of a line is called its slope. • Visualize a triangle with the slope as the hypotenuse. • The rise is equal to the height of the triangle. • The run is equal to the length along the base of the triangle.
  • 14.
    Slope • The slopeis the ratio of the “rise” (vertical change) to the “run” (horizontal change). • The slope is therefore a distance divided by a time, which equals speed.
  • 15.
    Speed vs. timegraphs • The position vs. time graph has position on the y-axis and time on the x-axis. Which runner has the fastest constant speed?
  • 16.
    Speed vs. timegraphs These graphs each show the same event. What differences do you notice?
  • 17.
    Do these graphsdisplay the same data?
  • 18.
    Calculating distance • Aspeed vs. time graph can also be used to find the distance the object has traveled.