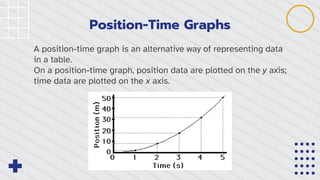
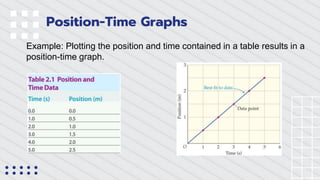
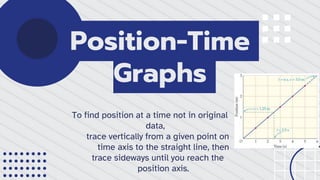
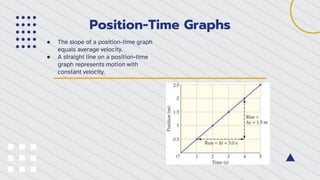
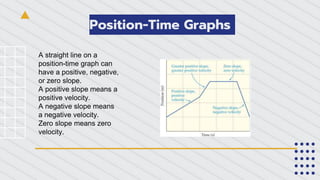
Position-Time
Graphs
BY: Wafi, Nawaf M, Nawaf D, Wessam,
Nawaf N
Grade: 11C
Position-Time Graphs
A position-time graph is an alternative way of representing data
in a table.
On a position-time graph, position data are plotted on the y axis;
time data are plotted on the x axis.
Position-Time Graphs
Example: Plotting the position and time contained in a table results in a
position-time graph.
Position-Time
Graphs
A best-fit line
drawn through
data points can
be used to
learn additional
information
about an
object's
motion.
Position-Time
Graphs
To find position at a time not in original
data,
trace vertically from a given point on
time axis to the straight line, then
trace sideways until you reach the
position axis.
Position-Time Graphs
The slope of a straight line is equal to its
rise over its run.
Any two points may be used to calculate
the slope of a straight line.
On a position-time graph the rise
corresponds to the an object's position
and the run to the elapsed time.
● The slope of a position-time graph
equals average velocity.
● A straight line on a position-time
graph represents motion with
constant velocity.
Position-Time Graphs
A straight line on a
position-time graph can
have a positive, negative,
or zero slope.
A positive slope means a
positive velocity.
A negative slope means
a negative velocity.
Zero slope means zero
velocity.
Position-Time Graphs
The greater the slope of a position-time graph,
the greater the velocity.
The slope of a tangent line to a position-time
graph at a given instant equals the
instantaneous velocity.
THANK YOU FOR WATCHING

Position_time_graph.pptx

  • 1.
    Position-Time Graphs BY: Wafi, NawafM, Nawaf D, Wessam, Nawaf N Grade: 11C
  • 2.
    Position-Time Graphs A position-timegraph is an alternative way of representing data in a table. On a position-time graph, position data are plotted on the y axis; time data are plotted on the x axis.
  • 3.
    Position-Time Graphs Example: Plottingthe position and time contained in a table results in a position-time graph.
  • 4.
    Position-Time Graphs A best-fit line drawnthrough data points can be used to learn additional information about an object's motion.
  • 5.
    Position-Time Graphs To find positionat a time not in original data, trace vertically from a given point on time axis to the straight line, then trace sideways until you reach the position axis.
  • 6.
    Position-Time Graphs The slopeof a straight line is equal to its rise over its run. Any two points may be used to calculate the slope of a straight line. On a position-time graph the rise corresponds to the an object's position and the run to the elapsed time.
  • 7.
    ● The slopeof a position-time graph equals average velocity. ● A straight line on a position-time graph represents motion with constant velocity. Position-Time Graphs
  • 8.
    Position-Time Graphs A straightline on a position-time graph can have a positive, negative, or zero slope. A positive slope means a positive velocity. A negative slope means a negative velocity. Zero slope means zero velocity.
  • 9.
    Position-Time Graphs The greaterthe slope of a position-time graph, the greater the velocity. The slope of a tangent line to a position-time graph at a given instant equals the instantaneous velocity.
  • 10.
    THANK YOU FORWATCHING