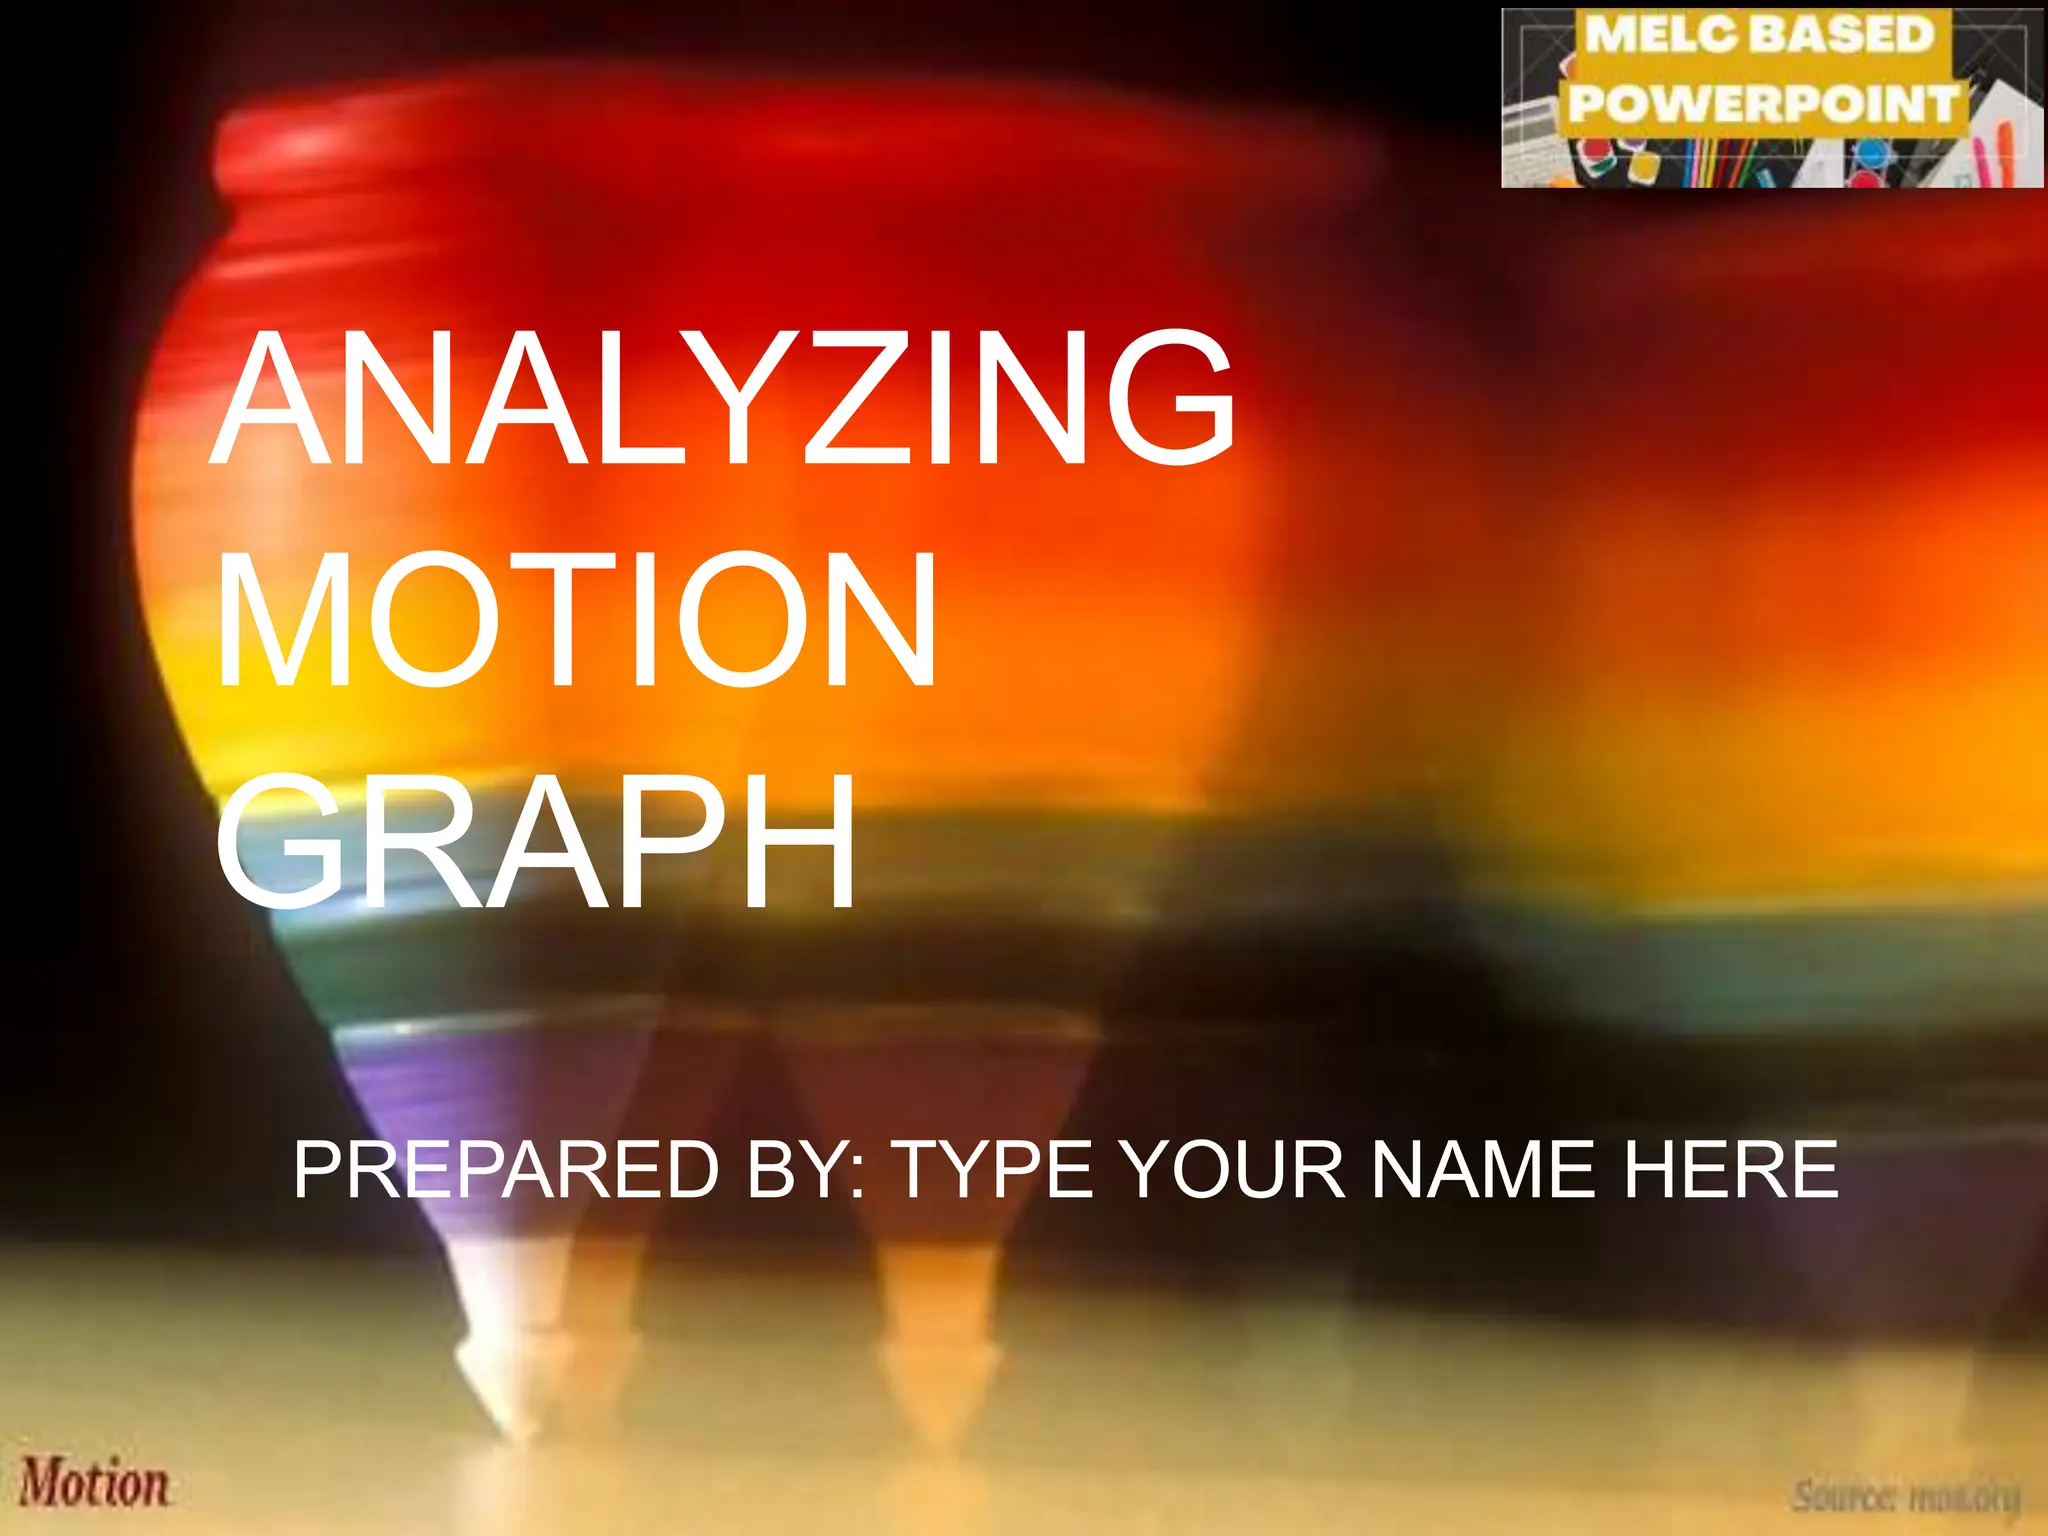
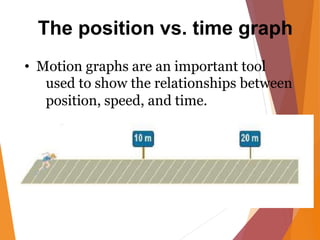
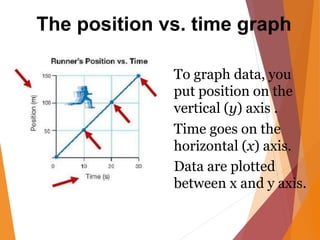
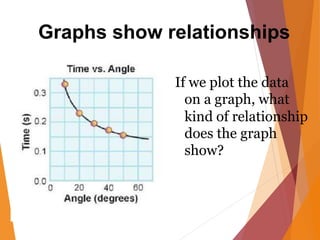
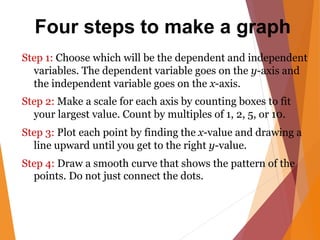
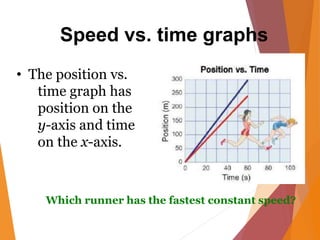
1. Motion graphs are used to show the relationships between position, speed, and time by plotting position on the y-axis versus time on the x-axis.
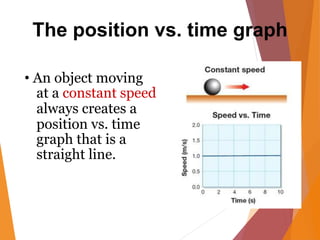
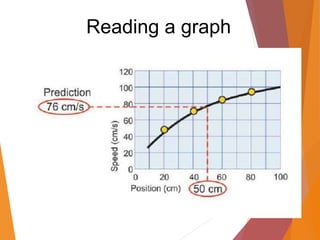
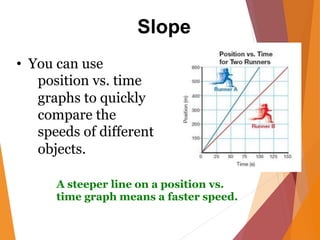
2. A straight line on a position vs. time graph indicates constant speed, while a steeper line means faster speed.
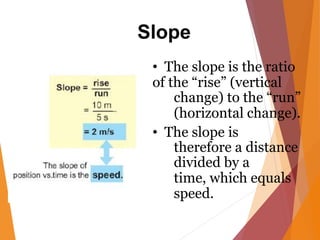
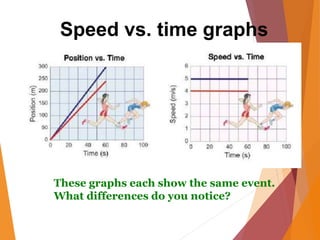
3. Slope represents speed, with a steeper positive slope corresponding to a higher speed. Slope is calculated as the rise over the run of a line on the graph.


![DISTANCE & DISPLACEMENT [Autosaved].pptx](https://cdn.slidesharecdn.com/ss_thumbnails/distancedisplacementautosaved-240205035054-d2154fe1-thumbnail.jpg?width=640&height=640&fit=bounds)