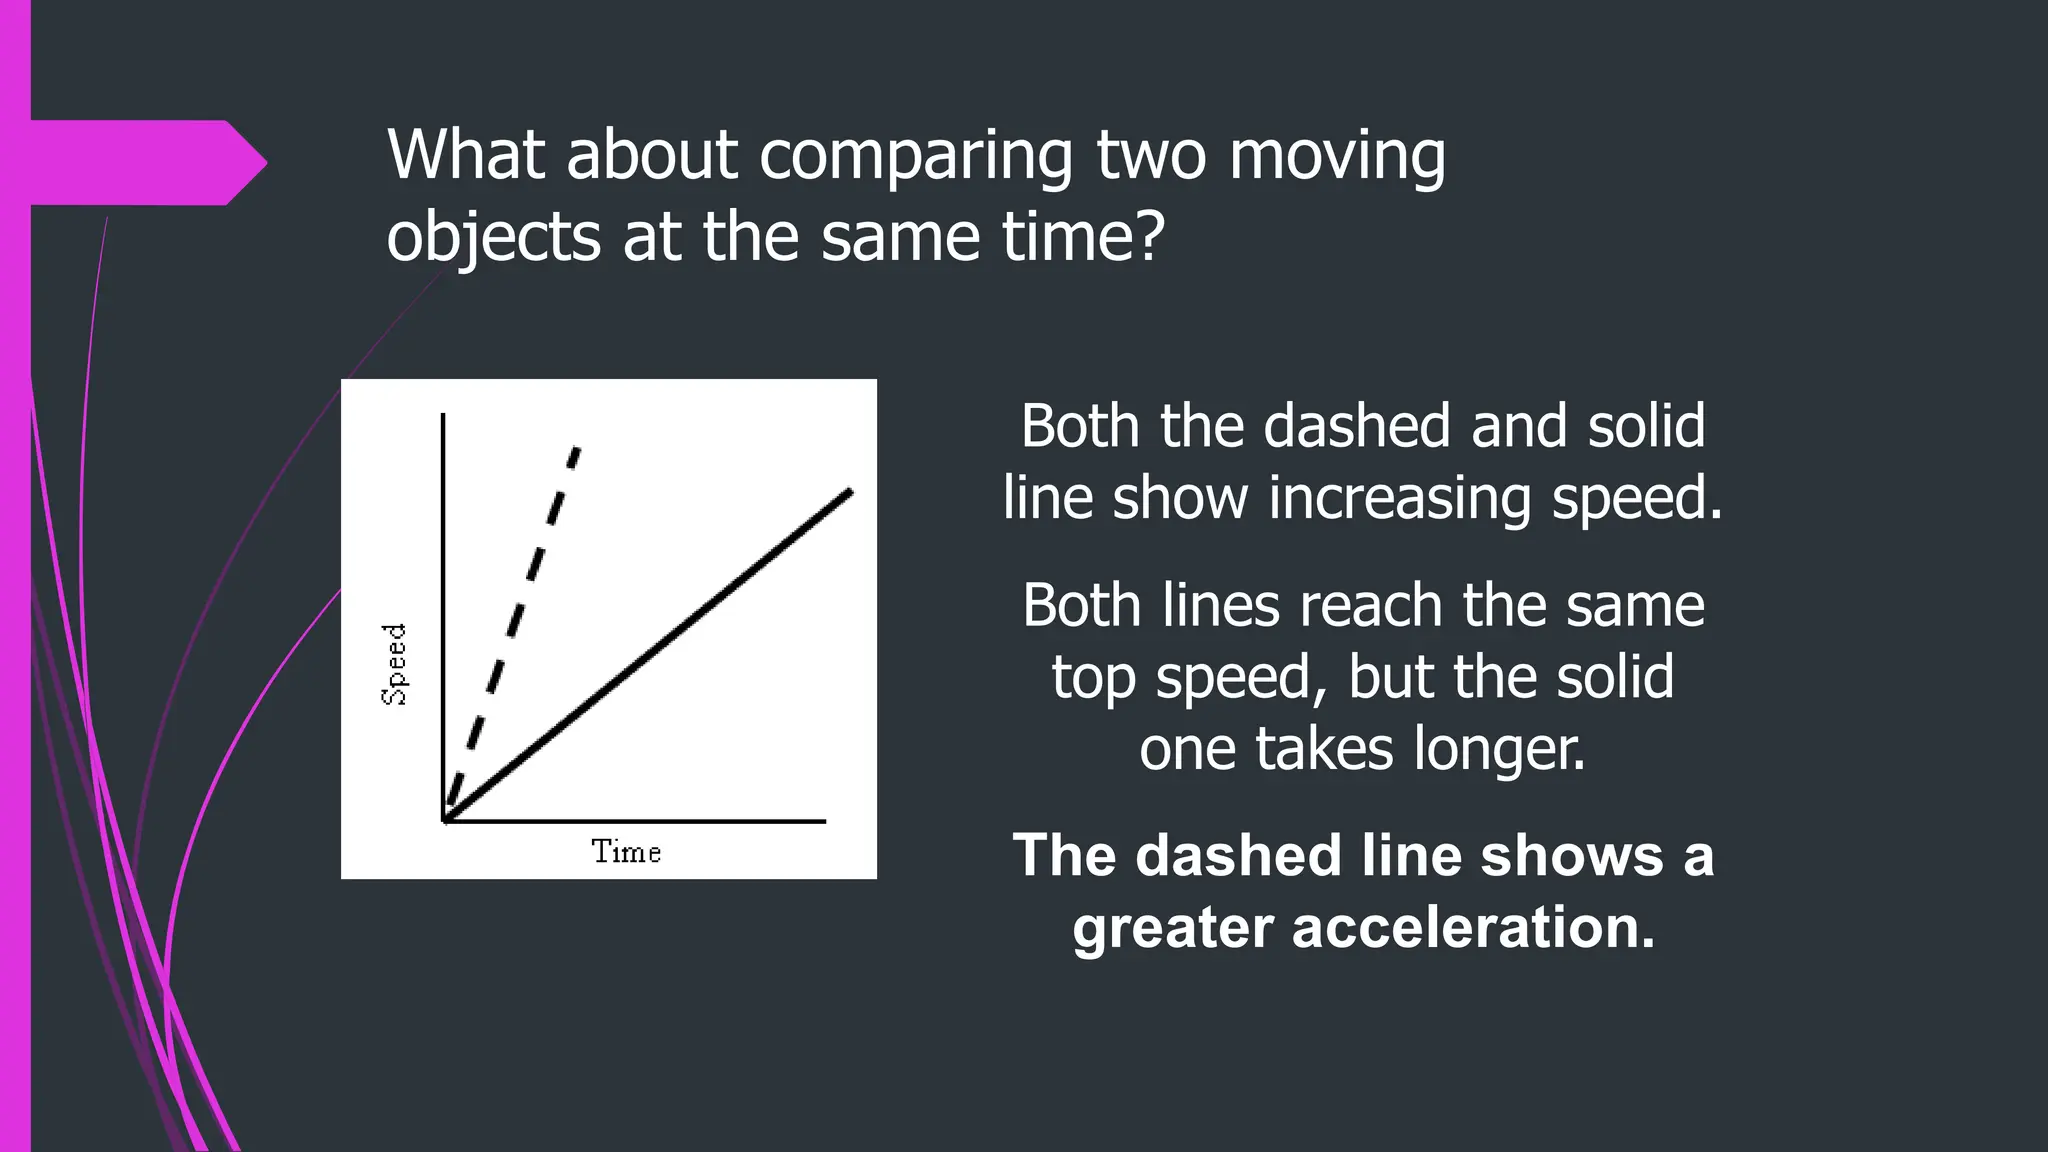
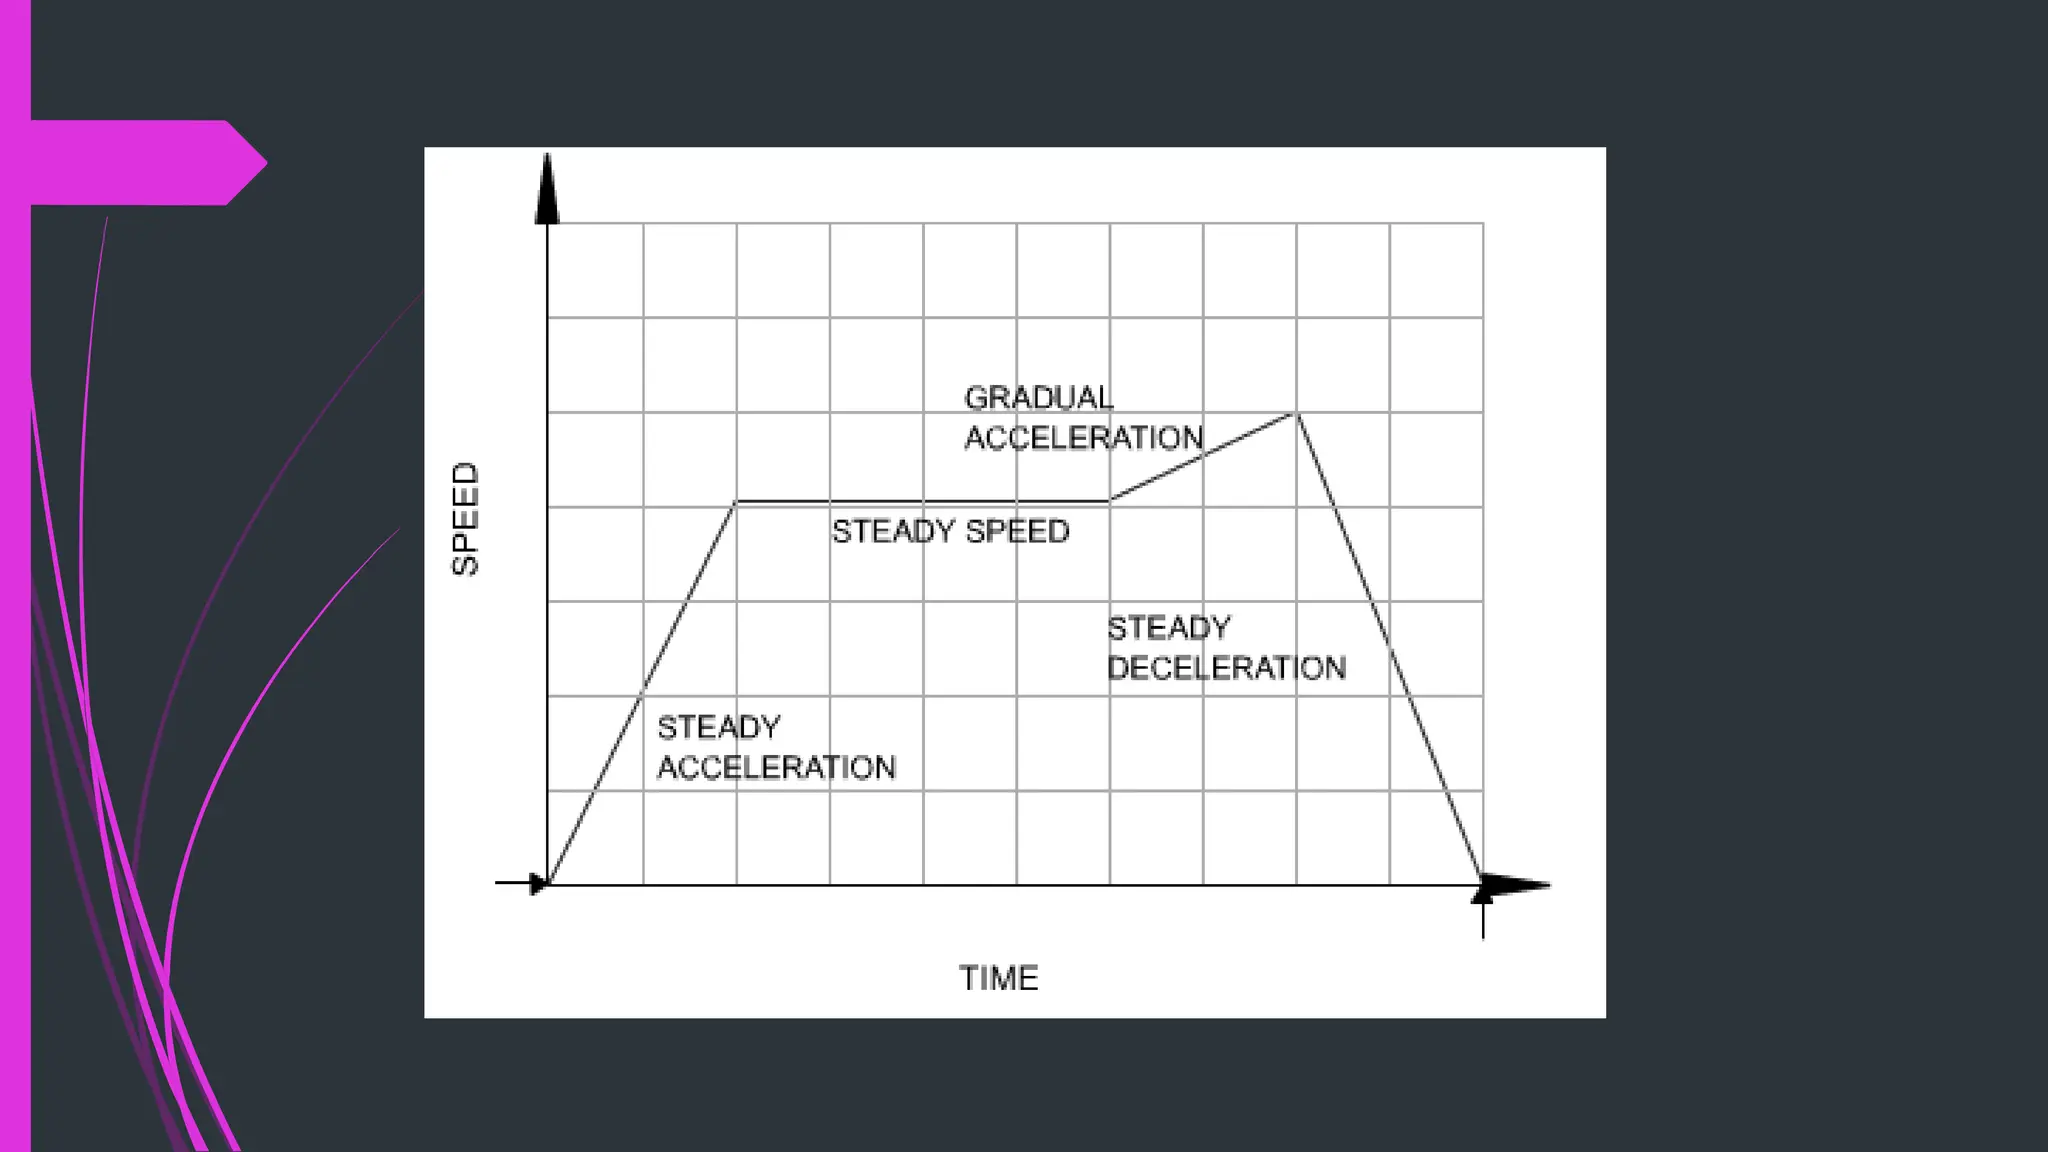
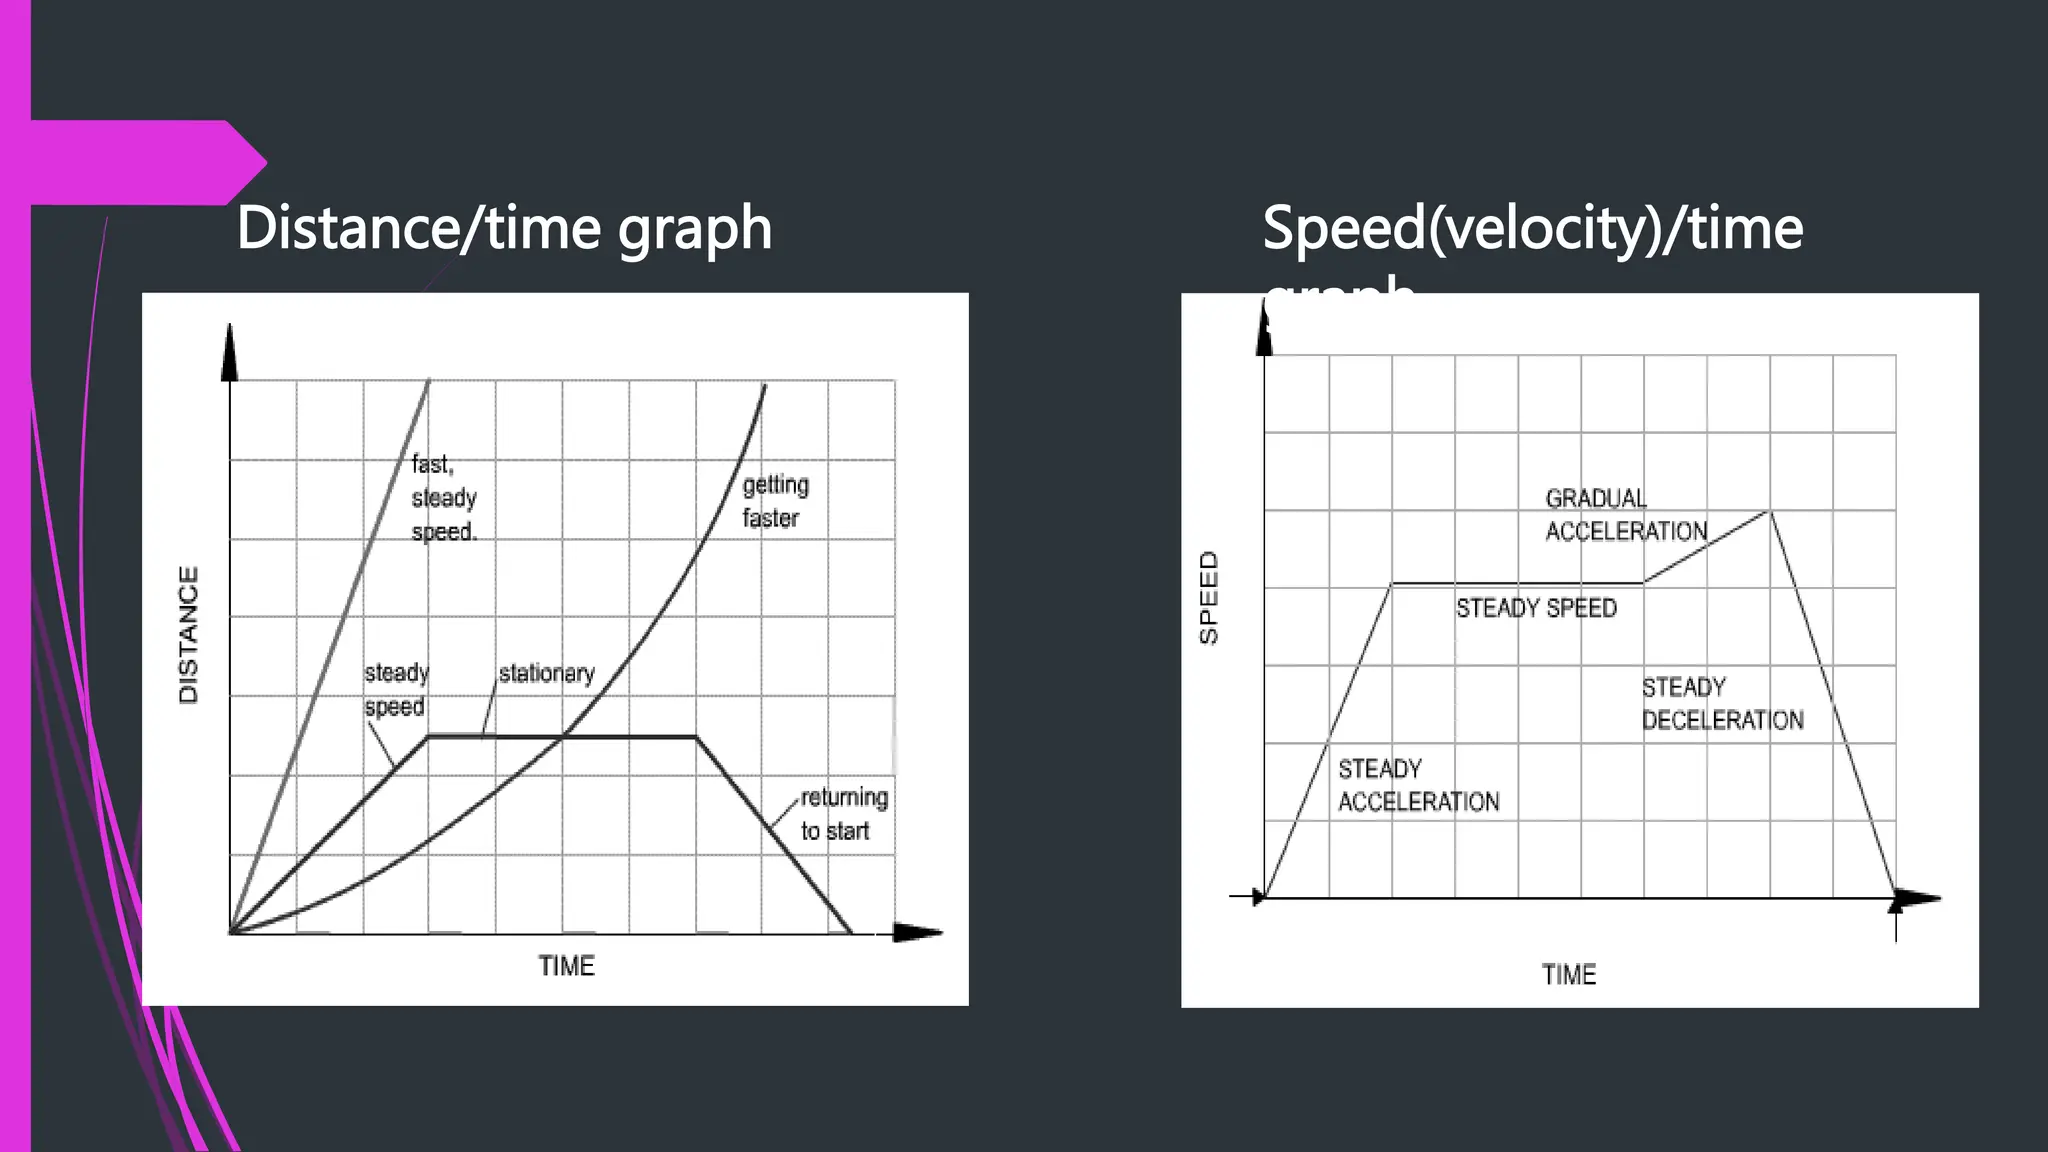
SlideShare a Scribd company logo
1 of 21
SPS8. Obtain, evaluate, and communicate
information to explain the relationships among
force, mass, and motion.
a. Plan and carry out an investigation to analyze
the motion of an object using mathematical and
graphical models.
(Clarification statement: Mathematical and
graphical models could include distance,
displacement, speed, velocity, time and
acceleration.)
How are speed, velocity,
and acceleration related and
how can they be interpreted
with the use of graphs?
YOU should understand how to to tell
the difference between a
speed/velocity and an acceleration
graph. (Hint: You can tell by how the
y-axis is labeled!)
YOU should understand the difference
between speed and velocity and how to
calculate it
YOU should understand what
acceleration is and how to calculate it
DISTANCE-TIME GRAPHS
Plotting distance against time can tell you a lot
about motion. Let's look at the axes:
Time is always plotted on the X-axis
(bottom of the graph).
The further to the right on the axis, the
longer the time from the start.
Distance is plotted on the Y-axis (side
of the graph). The higher up the
graph, the further from the start.
If an object is not moving, a horizontal line is
shown on a distance-time graph.
Time is increasing to the
right, but its
distance does not change.
It is not
moving. We say it is At
Rest.
If an object is moving at a constant speed, it means
it has the same increase in
distance in a given time:
Time is increasing to the right,
and distance is increasing
constantly with time. The object
moves at a constant speed.
Constant speed is shown by
straight lines on a graph.
Let’s look at two moving objects:
Both of the lines in the graph show that each object
moved the same distance, but the
steeper dashed line got there before the other one:
A steeper line indicates a larger
distance moved in a given time.
In other words, higher speed.
Both lines are straight, so both
speeds are constant.
Graphs that show acceleration look different from
those that show constant speed.
Time is increasing to the right, and distance
The line on this graph is curving
upwards. This shows an
increase in speed, since the
line is getting steeper:
In other words, in a given time,
the distance the object moves is
change (getting larger). It is
accelerating.
Summary:
A distance-time graph tells us how far an object
has moved with time.
• The steeper the graph, the faster the motion.
• A horizontal line means the object is not
changing its position - it is not moving, it is at
rest.
• A downward sloping line means the object is
returning to the start.
SPEED-TIME GRAPHS
Speed-Time graphs are also called Velocity Time graphs.
Speed-Time graphs look much like Distance-Time graphs. Be
sure to read the labels!! Time is plotted on the X-axis. Speed or
velocity is plotted on the Y-axis.
A straight horizontal line on a speed-time graph means that
speed is constant. It is not changing over time. A straight line
does not mean that the object is not moving!
This graph shows increasing speed.
The moving object is accelerating.
This graph shows decreasing speed.
The moving object is decelerating.
What about comparing two moving
objects at the same time?
Both the dashed and solid
line show increasing speed.
Both lines reach the same
top speed, but the solid
one takes longer.
The dashed line shows a
greater acceleration.
Summary:
A speed - time graph shows us how the
speed of a moving object changes with
time.
• The steeper the graph, the greater the
acceleration.
• A horizontal line means the object is
moving at a constant speed.
• A downward sloping line means the object
is slowing down.
Distance/time graph Speed(velocity)/time
graph
Answer the following questions in your notebook in complete sentences. Remember to restate the
questions.
1. When looking at speed (velocity)/ time graphs, which variable goes on the y-axis? Goes on the
x-axis?
2. Explain how #1 is different from distance/time graphs.
3. How does acceleration differ from distance/time graphs to speed/time graphs?
Create a Venn Diagram to show the similarities and differences:

More Related Content

Similar to motion graphs distance time graphs .pptx

Similar to motion graphs distance time graphs .pptx (20)

Sec.1 describing and measuring_motion
Sec.1 describing and measuring_motionSec.1 describing and measuring_motion
Sec.1 describing and measuring_motion
 
acceleration.ppt
acceleration.pptacceleration.ppt
acceleration.ppt
 
Pewr point
Pewr pointPewr point
Pewr point
 
Physics-Unit-1.pdf
Physics-Unit-1.pdfPhysics-Unit-1.pdf
Physics-Unit-1.pdf
 
GRAPHS OF MOTION.pptx
GRAPHS OF MOTION.pptxGRAPHS OF MOTION.pptx
GRAPHS OF MOTION.pptx
 
Forces and motion 2
Forces and motion 2Forces and motion 2
Forces and motion 2
 
Motion - Distance time graphs and speed time graphs.pptx
Motion - Distance time graphs and speed time graphs.pptxMotion - Distance time graphs and speed time graphs.pptx
Motion - Distance time graphs and speed time graphs.pptx
 
Chapter 2 Motion in a straight line
Chapter 2 Motion in a straight lineChapter 2 Motion in a straight line
Chapter 2 Motion in a straight line
 
2.1 motion 2015
2.1 motion 20152.1 motion 2015
2.1 motion 2015
 
Speed+velocity+acceleration
Speed+velocity+accelerationSpeed+velocity+acceleration
Speed+velocity+acceleration
 
Displacement and Velocity
Displacement and VelocityDisplacement and Velocity
Displacement and Velocity
 
Physics ppt
Physics pptPhysics ppt
Physics ppt
 
Kinematics
KinematicsKinematics
Kinematics
 
1 d motion
1 d motion1 d motion
1 d motion
 
Ap physics 12_-_graphical_analysis_of_motion
Ap physics 12_-_graphical_analysis_of_motionAp physics 12_-_graphical_analysis_of_motion
Ap physics 12_-_graphical_analysis_of_motion
 
Lecture13 motion
Lecture13 motionLecture13 motion
Lecture13 motion
 
Lecture13 motion
Lecture13 motionLecture13 motion
Lecture13 motion
 
Motion and You
Motion and YouMotion and You
Motion and You
 
CH-3Motion in a St Line.pdf
CH-3Motion in a St Line.pdfCH-3Motion in a St Line.pdf
CH-3Motion in a St Line.pdf
 
Kinematics
KinematicsKinematics
Kinematics
 

Recently uploaded

Arihant handbook biology for class 11 .pdf
Arihant handbook biology for class 11 .pdfArihant handbook biology for class 11 .pdf
Arihant handbook biology for class 11 .pdfchloefrazer622
 
The basics of sentences session 2pptx copy.pptx
The basics of sentences session 2pptx copy.pptxThe basics of sentences session 2pptx copy.pptx
The basics of sentences session 2pptx copy.pptxheathfieldcps1
 
Interactive Powerpoint_How to Master effective communication
Interactive Powerpoint_How to Master effective communicationInteractive Powerpoint_How to Master effective communication
Interactive Powerpoint_How to Master effective communicationnomboosow
 
Measures of Central Tendency: Mean, Median and Mode
Measures of Central Tendency: Mean, Median and ModeMeasures of Central Tendency: Mean, Median and Mode
Measures of Central Tendency: Mean, Median and ModeThiyagu K
 
Call Girls in Dwarka Mor Delhi Contact Us 9654467111
Call Girls in Dwarka Mor Delhi Contact Us 9654467111Call Girls in Dwarka Mor Delhi Contact Us 9654467111
Call Girls in Dwarka Mor Delhi Contact Us 9654467111Sapana Sha
 
microwave assisted reaction. General introduction
microwave assisted reaction. General introductionmicrowave assisted reaction. General introduction
microwave assisted reaction. General introductionMaksud Ahmed
 
Mastering the Unannounced Regulatory Inspection
Mastering the Unannounced Regulatory InspectionMastering the Unannounced Regulatory Inspection
Mastering the Unannounced Regulatory InspectionSafetyChain Software
 
CARE OF CHILD IN INCUBATOR..........pptx
CARE OF CHILD IN INCUBATOR..........pptxCARE OF CHILD IN INCUBATOR..........pptx
CARE OF CHILD IN INCUBATOR..........pptxGaneshChakor2
 
Activity 01 - Artificial Culture (1).pdf
Activity 01 - Artificial Culture (1).pdfActivity 01 - Artificial Culture (1).pdf
Activity 01 - Artificial Culture (1).pdfciinovamais
 
URLs and Routing in the Odoo 17 Website App
URLs and Routing in the Odoo 17 Website AppURLs and Routing in the Odoo 17 Website App
URLs and Routing in the Odoo 17 Website AppCeline George
 
Student login on Anyboli platform.helpin
Student login on Anyboli platform.helpinStudent login on Anyboli platform.helpin
Student login on Anyboli platform.helpinRaunakKeshri1
 
How to Make a Pirate ship Primary Education.pptx
How to Make a Pirate ship Primary Education.pptxHow to Make a Pirate ship Primary Education.pptx
How to Make a Pirate ship Primary Education.pptxmanuelaromero2013
 
Z Score,T Score, Percential Rank and Box Plot Graph
Z Score,T Score, Percential Rank and Box Plot GraphZ Score,T Score, Percential Rank and Box Plot Graph
Z Score,T Score, Percential Rank and Box Plot GraphThiyagu K
 
Introduction to AI in Higher Education_draft.pptx
Introduction to AI in Higher Education_draft.pptxIntroduction to AI in Higher Education_draft.pptx
Introduction to AI in Higher Education_draft.pptxpboyjonauth
 
Advanced Views - Calendar View in Odoo 17
Advanced Views - Calendar View in Odoo 17Advanced Views - Calendar View in Odoo 17
Advanced Views - Calendar View in Odoo 17Celine George
 
Hybridoma Technology ( Production , Purification , and Application )
Hybridoma Technology  ( Production , Purification , and Application  ) Hybridoma Technology  ( Production , Purification , and Application  )
Hybridoma Technology ( Production , Purification , and Application ) Sakshi Ghasle
 
POINT- BIOCHEMISTRY SEM 2 ENZYMES UNIT 5.pptx
POINT- BIOCHEMISTRY SEM 2 ENZYMES UNIT 5.pptxPOINT- BIOCHEMISTRY SEM 2 ENZYMES UNIT 5.pptx
POINT- BIOCHEMISTRY SEM 2 ENZYMES UNIT 5.pptxSayali Powar
 
Accessible design: Minimum effort, maximum impact
Accessible design: Minimum effort, maximum impactAccessible design: Minimum effort, maximum impact
Accessible design: Minimum effort, maximum impactdawncurless
 

Recently uploaded (20)

Arihant handbook biology for class 11 .pdf
Arihant handbook biology for class 11 .pdfArihant handbook biology for class 11 .pdf
Arihant handbook biology for class 11 .pdf
 
The basics of sentences session 2pptx copy.pptx
The basics of sentences session 2pptx copy.pptxThe basics of sentences session 2pptx copy.pptx
The basics of sentences session 2pptx copy.pptx
 
Interactive Powerpoint_How to Master effective communication
Interactive Powerpoint_How to Master effective communicationInteractive Powerpoint_How to Master effective communication
Interactive Powerpoint_How to Master effective communication
 
Measures of Central Tendency: Mean, Median and Mode
Measures of Central Tendency: Mean, Median and ModeMeasures of Central Tendency: Mean, Median and Mode
Measures of Central Tendency: Mean, Median and Mode
 
Call Girls in Dwarka Mor Delhi Contact Us 9654467111
Call Girls in Dwarka Mor Delhi Contact Us 9654467111Call Girls in Dwarka Mor Delhi Contact Us 9654467111
Call Girls in Dwarka Mor Delhi Contact Us 9654467111
 
microwave assisted reaction. General introduction
microwave assisted reaction. General introductionmicrowave assisted reaction. General introduction
microwave assisted reaction. General introduction
 
Mastering the Unannounced Regulatory Inspection
Mastering the Unannounced Regulatory InspectionMastering the Unannounced Regulatory Inspection
Mastering the Unannounced Regulatory Inspection
 
Staff of Color (SOC) Retention Efforts DDSD
Staff of Color (SOC) Retention Efforts DDSDStaff of Color (SOC) Retention Efforts DDSD
Staff of Color (SOC) Retention Efforts DDSD
 
Código Creativo y Arte de Software | Unidad 1
Código Creativo y Arte de Software | Unidad 1Código Creativo y Arte de Software | Unidad 1
Código Creativo y Arte de Software | Unidad 1
 
CARE OF CHILD IN INCUBATOR..........pptx
CARE OF CHILD IN INCUBATOR..........pptxCARE OF CHILD IN INCUBATOR..........pptx
CARE OF CHILD IN INCUBATOR..........pptx
 
Activity 01 - Artificial Culture (1).pdf
Activity 01 - Artificial Culture (1).pdfActivity 01 - Artificial Culture (1).pdf
Activity 01 - Artificial Culture (1).pdf
 
URLs and Routing in the Odoo 17 Website App
URLs and Routing in the Odoo 17 Website AppURLs and Routing in the Odoo 17 Website App
URLs and Routing in the Odoo 17 Website App
 
Student login on Anyboli platform.helpin
Student login on Anyboli platform.helpinStudent login on Anyboli platform.helpin
Student login on Anyboli platform.helpin
 
How to Make a Pirate ship Primary Education.pptx
How to Make a Pirate ship Primary Education.pptxHow to Make a Pirate ship Primary Education.pptx
How to Make a Pirate ship Primary Education.pptx
 
Z Score,T Score, Percential Rank and Box Plot Graph
Z Score,T Score, Percential Rank and Box Plot GraphZ Score,T Score, Percential Rank and Box Plot Graph
Z Score,T Score, Percential Rank and Box Plot Graph
 
Introduction to AI in Higher Education_draft.pptx
Introduction to AI in Higher Education_draft.pptxIntroduction to AI in Higher Education_draft.pptx
Introduction to AI in Higher Education_draft.pptx
 
Advanced Views - Calendar View in Odoo 17
Advanced Views - Calendar View in Odoo 17Advanced Views - Calendar View in Odoo 17
Advanced Views - Calendar View in Odoo 17
 
Hybridoma Technology ( Production , Purification , and Application )
Hybridoma Technology  ( Production , Purification , and Application  ) Hybridoma Technology  ( Production , Purification , and Application  )
Hybridoma Technology ( Production , Purification , and Application )
 
POINT- BIOCHEMISTRY SEM 2 ENZYMES UNIT 5.pptx
POINT- BIOCHEMISTRY SEM 2 ENZYMES UNIT 5.pptxPOINT- BIOCHEMISTRY SEM 2 ENZYMES UNIT 5.pptx
POINT- BIOCHEMISTRY SEM 2 ENZYMES UNIT 5.pptx
 
Accessible design: Minimum effort, maximum impact
Accessible design: Minimum effort, maximum impactAccessible design: Minimum effort, maximum impact
Accessible design: Minimum effort, maximum impact
 

motion graphs distance time graphs .pptx

  • 1.
  • 2. SPS8. Obtain, evaluate, and communicate information to explain the relationships among force, mass, and motion. a. Plan and carry out an investigation to analyze the motion of an object using mathematical and graphical models. (Clarification statement: Mathematical and graphical models could include distance, displacement, speed, velocity, time and acceleration.)
  • 3. How are speed, velocity, and acceleration related and how can they be interpreted with the use of graphs?
  • 4. YOU should understand how to to tell the difference between a speed/velocity and an acceleration graph. (Hint: You can tell by how the y-axis is labeled!)
  • 5. YOU should understand the difference between speed and velocity and how to calculate it YOU should understand what acceleration is and how to calculate it
  • 6. DISTANCE-TIME GRAPHS Plotting distance against time can tell you a lot about motion. Let's look at the axes:
  • 7. Time is always plotted on the X-axis (bottom of the graph). The further to the right on the axis, the longer the time from the start. Distance is plotted on the Y-axis (side of the graph). The higher up the graph, the further from the start.
  • 8. If an object is not moving, a horizontal line is shown on a distance-time graph. Time is increasing to the right, but its distance does not change. It is not moving. We say it is At Rest.
  • 9. If an object is moving at a constant speed, it means it has the same increase in distance in a given time: Time is increasing to the right, and distance is increasing constantly with time. The object moves at a constant speed. Constant speed is shown by straight lines on a graph.
  • 10. Let’s look at two moving objects: Both of the lines in the graph show that each object moved the same distance, but the steeper dashed line got there before the other one: A steeper line indicates a larger distance moved in a given time. In other words, higher speed. Both lines are straight, so both speeds are constant.
  • 11. Graphs that show acceleration look different from those that show constant speed. Time is increasing to the right, and distance The line on this graph is curving upwards. This shows an increase in speed, since the line is getting steeper: In other words, in a given time, the distance the object moves is change (getting larger). It is accelerating.
  • 12. Summary: A distance-time graph tells us how far an object has moved with time. • The steeper the graph, the faster the motion. • A horizontal line means the object is not changing its position - it is not moving, it is at rest. • A downward sloping line means the object is returning to the start.
  • 13.
  • 14. SPEED-TIME GRAPHS Speed-Time graphs are also called Velocity Time graphs. Speed-Time graphs look much like Distance-Time graphs. Be sure to read the labels!! Time is plotted on the X-axis. Speed or velocity is plotted on the Y-axis. A straight horizontal line on a speed-time graph means that speed is constant. It is not changing over time. A straight line does not mean that the object is not moving!
  • 15. This graph shows increasing speed. The moving object is accelerating.
  • 16. This graph shows decreasing speed. The moving object is decelerating.
  • 17. What about comparing two moving objects at the same time? Both the dashed and solid line show increasing speed. Both lines reach the same top speed, but the solid one takes longer. The dashed line shows a greater acceleration.
  • 18. Summary: A speed - time graph shows us how the speed of a moving object changes with time. • The steeper the graph, the greater the acceleration. • A horizontal line means the object is moving at a constant speed. • A downward sloping line means the object is slowing down.
  • 19.
  • 21. Answer the following questions in your notebook in complete sentences. Remember to restate the questions. 1. When looking at speed (velocity)/ time graphs, which variable goes on the y-axis? Goes on the x-axis? 2. Explain how #1 is different from distance/time graphs. 3. How does acceleration differ from distance/time graphs to speed/time graphs? Create a Venn Diagram to show the similarities and differences: