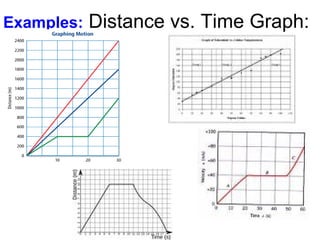
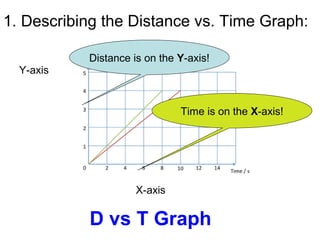
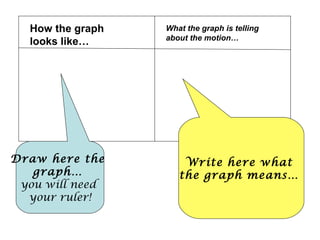
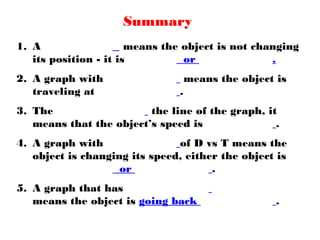
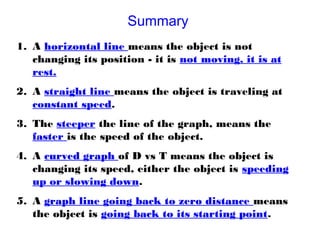
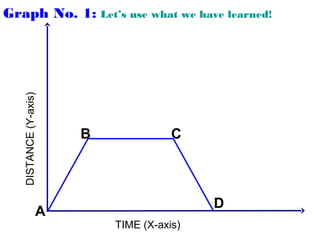
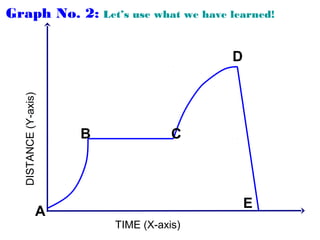
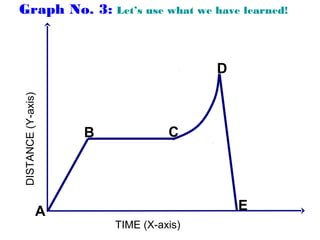
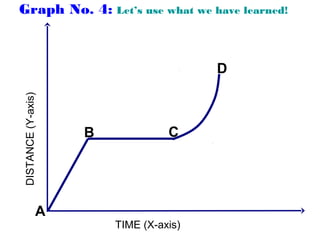
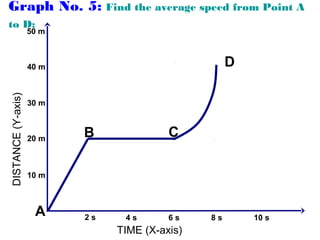
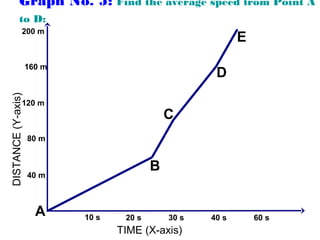
1. The document discusses distance vs time graphs and how to interpret them to understand an object's motion.
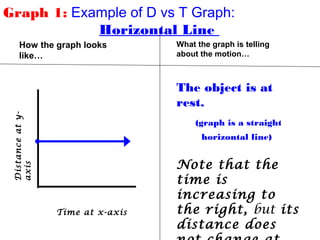
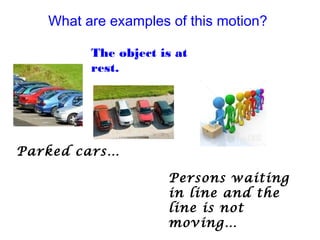
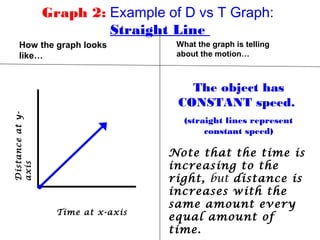
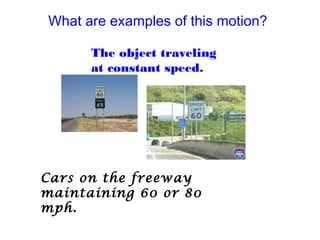
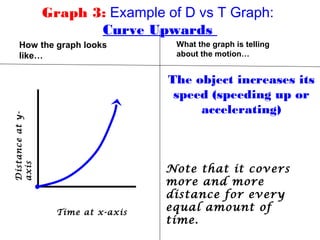
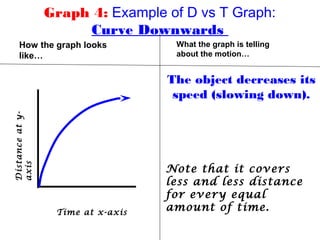
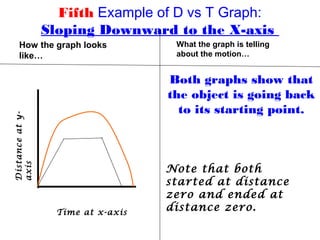
2. A horizontal line on the graph represents constant speed, a straight uphill line represents accelerating speed, and a downhill line represents decelerating speed.
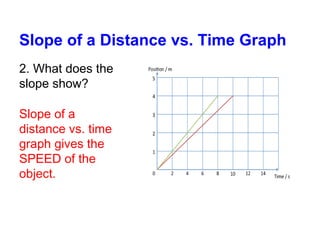
3. The slope of the distance vs time graph directly corresponds to the object's speed, with steeper lines representing faster speeds.