TOPIC 2.3 – POSITION-
TIME GRAPHS FOR
CONSTANT
ACCELERATION
GRADE 9 PHYSICS
Lesson Objectives:
Position-Time Graphs for Constant
Acceleration
 The Position-time
graph for a uniformly
accelerated object is
a parabola.
 The greater the
curvature of the
parabola, the
greater the
magnitude of the
acceleration
© 2014 Pearson Education, Inc.
Position-Time Graphs for Constant
Acceleration
 Constant acceleration produces a parabolic
position-time graph.
 The sign of the acceleration determines
whether the parabola has an upward or
downward curvature.
© 2014 Pearson Education,
Inc.
Position-Time Graphs for Constant
Acceleration
 The magnitude of the acceleration is related to
how sharply a position-time graph curves. In
general, the greater the curvature of the
parabola, the greater the magnitude of the
acceleration.
© 2014 Pearson Education,
Inc.
Position-Time Graphs for Constant
Acceleration
 Each term in the equation
has graphical meaning.
 The vertical intercept is equal to the initial position
xi.
 The initial slope is equal to the initial velocity.
 The sharpness of the curvature indicates the
magnitude of the acceleration.
Position-Time Graphs for Constant
Acceleration
 Thus, considerable information can be
obtained from a position-time graph.
© 2014 Pearson Education,
Inc.
Position-Time Graphs for Constant
Acceleration
 A single parabola in a
position-time graph
can show both
deceleration and
acceleration.
 A constant curvature
indicates a constant
acceleration. A ball
thrown upward is an
example of motion
with constant
acceleration.
© 2014 Pearson Education, Inc.
V-t graph and d-t graph
a-t
AFL
https://phet.colorado.edu/sims/cheerpj/moving-man/latest/moving-man.html?simulation=moving-man
Velocity – Time Graph
describe
motion by
vt – graph
velocity-time graph could have different shapes, three of them are:
Time (s)
velocity
(m/s)
Time (s)
velocity
(m/s)
Time (s)
velocity
(m/s)
Acceleration is obtained from velocity-time graph by calculating the
slope:
𝑎 = 𝑠𝑙𝑜𝑝𝑒 =
𝑟𝑖𝑠𝑒
𝑟𝑢𝑛
=
Δ𝑣
Δ𝑡
Displacement is obtained from velocity-time graph by calculating the
area under graph:
∆𝑥 = 𝑎𝑟𝑒𝑎 𝑢𝑛𝑑𝑒𝑟 𝑔𝑟𝑎𝑝ℎ
Velocity – Time Graph
Remember:
When velocity line
above x – axis its
positive velocity.
When velocity line
below x – axis its
negative velocity.
Speeding up:
a and v same dir.
Slowing down:
a and v opposite dir.
positive velocity
negative velocity
positive
acceleration
negative
acceleration
no
acceleration
describe
motion by
vt – graph
Positive and negative constant velocity
Positive and negative velocities
Speeding up and slowing down
Positive and negative acceleration
Velocity – Time Graph
describe
motion by
vt – graph
Describe the motion for the figure beside:
EX
The object is speeding up with constant
acceleration.
The acceleration is positive and the
velocity is positive.
The opposite graph represents the motion of
two objects A and B. Which of the two objects
have more acceleration. Explain why.
EX
Object B has more acceleration.
because the slope of its line is steeper
(has more slope).
AFL
Velocity – Time Graph
describe
motion by
vt – graph
Describe the motion for the figure beside:
EX
The object is slowing down (retarding)
with constant acceleration.
The acceleration is negative but the
velocity is positive.
The opposite graph represents the motion of
two objects A and B. Which of the two objects
have more acceleration. Explain why.
EX
Object B has more acceleration.
because the slope of its line is steeper
(has more slope).
AFL
Velocity – Time Graph
describe
motion by
vt – graph
Describe the motion for the figure beside:
EX
moving with constant positive velocity,
acceleration = 0
or slope = 0
Don’t confuse between
velocity – time graph and
position – time graph!!!
slope = a slope = v
AFL
Velocity – Time Graph
obtain the
acceleration
from vt –
graph
The opposite graph represents the
motion of running horse.
a- Find the acceleration of the horse.
Is the horse speeding up or slowing
down? Justify your answer.
EX
2
0
4
6
8
10
12
Velocity
(m/s)
Rise
Run
𝑎 = 𝑠𝑙𝑜𝑝𝑒 =
𝑟𝑖𝑠𝑒
𝑟𝑢𝑛
=
Δ𝑣
Δ𝑡
=
10 − 2
5 − 1
= + 2 𝑚/𝑠2
the acceleration (slope) is positive and velocity is positive
⇒ they are in the same direction.
⇒ The horse is speeding up
∆𝑥 = 𝑎𝑟𝑒𝑎 𝑢𝑛𝑑𝑒𝑟 𝑔𝑟𝑎𝑝ℎ = 𝑎𝑟𝑒𝑎 𝑜𝑓 𝑡𝑟𝑖𝑎𝑛𝑔𝑙𝑒
b- find the displacement travelled by the horse after 5 seconds.
=
1
2
× 𝑏𝑎𝑠𝑒 × ℎ𝑒𝑖𝑔ℎ𝑡 =
1
2
× 5 × 10 = 25 𝑚.
AFL
Velocity – Time Graph
obtain the
acceleration
from vt –
graph
The opposite graph represents the
motion of running horse.
Find the acceleration of the horse. Is
the horse speeding up or slowing
down? Justify your answer.
EX
𝑎 = 𝑠𝑙𝑜𝑝𝑒 =
𝑟𝑖𝑠𝑒
𝑟𝑢𝑛
=
Δ𝑣
Δ𝑡
=
80 − 40
2 −6
= ‒ 10 𝑚/𝑠2
Velocity
(m/s)
Run
Rise
the acceleration (slope) is negative and velocity is positive.
⇒ they are in the opposite direction.
⇒ The plane is slowing down
∆𝑥 = 𝑎𝑟𝑒𝑎 𝑢𝑛𝑑𝑒𝑟 𝑔𝑟𝑎𝑝ℎ = 𝑎𝑟𝑒𝑎 𝑜𝑓 𝑡𝑟𝑖𝑎𝑛𝑔𝑙𝑒 + 𝑎𝑟𝑒𝑎 𝑜𝑓 𝑟𝑒𝑐𝑡𝑎𝑛𝑔𝑙𝑒
b- find the displacement travelled by the horse after 6 seconds.
=
1
2
× 𝑏𝑎𝑠𝑒 × ℎ𝑒𝑖𝑔ℎ𝑡 + 𝑙𝑒𝑛𝑔𝑡ℎ × 𝑤𝑖𝑑𝑡ℎ =
1
2
× 6 × (100 − 40) + 6 × 40
= 420 𝑚.
AFL
Motion graphs
Motion graphs
The opposite graph represents
the motion of an object, describe
the motion of this object.
Use the simulation of the
Moving man to obtain some
experimental graphs of motion.
Xi vi(m/s) a (m/s2)
0 0 3
0 12 -3
5 0 3
0 -12 3
0 -12 -3
-5 0 -3
AFL
Guided example
CW
Centripetal acceleration always points to the
of the circle.
A. back
B. center
C. front
D. outer edge
CW
CW
Assessment
Assessment
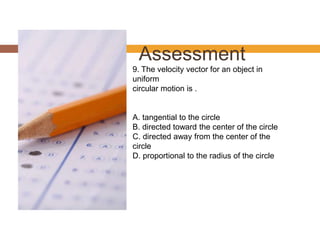
9. The velocity vector for an object in
uniform
circular motion is .
A. tangential to the circle
B. directed toward the center of the circle
C. directed away from the center of the
circle
D. proportional to the radius of the circle

G9 asp. 2.3 position time graph

  • 1.
    TOPIC 2.3 –POSITION- TIME GRAPHS FOR CONSTANT ACCELERATION GRADE 9 PHYSICS
  • 2.
  • 4.
    Position-Time Graphs forConstant Acceleration  The Position-time graph for a uniformly accelerated object is a parabola.  The greater the curvature of the parabola, the greater the magnitude of the acceleration © 2014 Pearson Education, Inc.
  • 5.
    Position-Time Graphs forConstant Acceleration  Constant acceleration produces a parabolic position-time graph.  The sign of the acceleration determines whether the parabola has an upward or downward curvature. © 2014 Pearson Education, Inc.
  • 6.
    Position-Time Graphs forConstant Acceleration  The magnitude of the acceleration is related to how sharply a position-time graph curves. In general, the greater the curvature of the parabola, the greater the magnitude of the acceleration. © 2014 Pearson Education, Inc.
  • 7.
    Position-Time Graphs forConstant Acceleration  Each term in the equation has graphical meaning.  The vertical intercept is equal to the initial position xi.  The initial slope is equal to the initial velocity.  The sharpness of the curvature indicates the magnitude of the acceleration.
  • 8.
    Position-Time Graphs forConstant Acceleration  Thus, considerable information can be obtained from a position-time graph. © 2014 Pearson Education, Inc.
  • 9.
    Position-Time Graphs forConstant Acceleration  A single parabola in a position-time graph can show both deceleration and acceleration.  A constant curvature indicates a constant acceleration. A ball thrown upward is an example of motion with constant acceleration. © 2014 Pearson Education, Inc.
  • 10.
    V-t graph andd-t graph
  • 11.
    V-t graph andd-t graph
  • 12.
    V-t graph andd-t graph
  • 13.
    V-t graph andd-t graph
  • 14.
    V-t graph andd-t graph a-t AFL https://phet.colorado.edu/sims/cheerpj/moving-man/latest/moving-man.html?simulation=moving-man
  • 15.
    Velocity – TimeGraph describe motion by vt – graph velocity-time graph could have different shapes, three of them are: Time (s) velocity (m/s) Time (s) velocity (m/s) Time (s) velocity (m/s) Acceleration is obtained from velocity-time graph by calculating the slope: 𝑎 = 𝑠𝑙𝑜𝑝𝑒 = 𝑟𝑖𝑠𝑒 𝑟𝑢𝑛 = Δ𝑣 Δ𝑡 Displacement is obtained from velocity-time graph by calculating the area under graph: ∆𝑥 = 𝑎𝑟𝑒𝑎 𝑢𝑛𝑑𝑒𝑟 𝑔𝑟𝑎𝑝ℎ
  • 16.
    Velocity – TimeGraph Remember: When velocity line above x – axis its positive velocity. When velocity line below x – axis its negative velocity. Speeding up: a and v same dir. Slowing down: a and v opposite dir. positive velocity negative velocity positive acceleration negative acceleration no acceleration describe motion by vt – graph
  • 17.
    Positive and negativeconstant velocity
  • 18.
  • 19.
    Speeding up andslowing down
  • 20.
  • 21.
    Velocity – TimeGraph describe motion by vt – graph Describe the motion for the figure beside: EX The object is speeding up with constant acceleration. The acceleration is positive and the velocity is positive. The opposite graph represents the motion of two objects A and B. Which of the two objects have more acceleration. Explain why. EX Object B has more acceleration. because the slope of its line is steeper (has more slope). AFL
  • 22.
    Velocity – TimeGraph describe motion by vt – graph Describe the motion for the figure beside: EX The object is slowing down (retarding) with constant acceleration. The acceleration is negative but the velocity is positive. The opposite graph represents the motion of two objects A and B. Which of the two objects have more acceleration. Explain why. EX Object B has more acceleration. because the slope of its line is steeper (has more slope). AFL
  • 23.
    Velocity – TimeGraph describe motion by vt – graph Describe the motion for the figure beside: EX moving with constant positive velocity, acceleration = 0 or slope = 0 Don’t confuse between velocity – time graph and position – time graph!!! slope = a slope = v AFL
  • 24.
    Velocity – TimeGraph obtain the acceleration from vt – graph The opposite graph represents the motion of running horse. a- Find the acceleration of the horse. Is the horse speeding up or slowing down? Justify your answer. EX 2 0 4 6 8 10 12 Velocity (m/s) Rise Run 𝑎 = 𝑠𝑙𝑜𝑝𝑒 = 𝑟𝑖𝑠𝑒 𝑟𝑢𝑛 = Δ𝑣 Δ𝑡 = 10 − 2 5 − 1 = + 2 𝑚/𝑠2 the acceleration (slope) is positive and velocity is positive ⇒ they are in the same direction. ⇒ The horse is speeding up ∆𝑥 = 𝑎𝑟𝑒𝑎 𝑢𝑛𝑑𝑒𝑟 𝑔𝑟𝑎𝑝ℎ = 𝑎𝑟𝑒𝑎 𝑜𝑓 𝑡𝑟𝑖𝑎𝑛𝑔𝑙𝑒 b- find the displacement travelled by the horse after 5 seconds. = 1 2 × 𝑏𝑎𝑠𝑒 × ℎ𝑒𝑖𝑔ℎ𝑡 = 1 2 × 5 × 10 = 25 𝑚. AFL
  • 25.
    Velocity – TimeGraph obtain the acceleration from vt – graph The opposite graph represents the motion of running horse. Find the acceleration of the horse. Is the horse speeding up or slowing down? Justify your answer. EX 𝑎 = 𝑠𝑙𝑜𝑝𝑒 = 𝑟𝑖𝑠𝑒 𝑟𝑢𝑛 = Δ𝑣 Δ𝑡 = 80 − 40 2 −6 = ‒ 10 𝑚/𝑠2 Velocity (m/s) Run Rise the acceleration (slope) is negative and velocity is positive. ⇒ they are in the opposite direction. ⇒ The plane is slowing down ∆𝑥 = 𝑎𝑟𝑒𝑎 𝑢𝑛𝑑𝑒𝑟 𝑔𝑟𝑎𝑝ℎ = 𝑎𝑟𝑒𝑎 𝑜𝑓 𝑡𝑟𝑖𝑎𝑛𝑔𝑙𝑒 + 𝑎𝑟𝑒𝑎 𝑜𝑓 𝑟𝑒𝑐𝑡𝑎𝑛𝑔𝑙𝑒 b- find the displacement travelled by the horse after 6 seconds. = 1 2 × 𝑏𝑎𝑠𝑒 × ℎ𝑒𝑖𝑔ℎ𝑡 + 𝑙𝑒𝑛𝑔𝑡ℎ × 𝑤𝑖𝑑𝑡ℎ = 1 2 × 6 × (100 − 40) + 6 × 40 = 420 𝑚. AFL
  • 26.
  • 27.
    Motion graphs The oppositegraph represents the motion of an object, describe the motion of this object. Use the simulation of the Moving man to obtain some experimental graphs of motion. Xi vi(m/s) a (m/s2) 0 0 3 0 12 -3 5 0 3 0 -12 3 0 -12 -3 -5 0 -3 AFL
  • 28.
  • 29.
    CW Centripetal acceleration alwayspoints to the of the circle. A. back B. center C. front D. outer edge
  • 30.
  • 31.
  • 32.
  • 33.
    Assessment 9. The velocityvector for an object in uniform circular motion is . A. tangential to the circle B. directed toward the center of the circle C. directed away from the center of the circle D. proportional to the radius of the circle