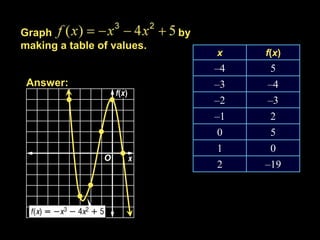
1. Graph by
making a table of values.
x f(x)
–4 5
Answer: –3 –4
–2 –3
–1 2
0 5
1 0
2 –19
2. Determine consecutive values of x between which
each real zero of the function
is located. Then draw the graph.
change in signs means
x f (x) the x-axis was crossed
–2 9
change in signs
–1 –1
change in signs
0 1
change in signs
1 –3
2 –7
change in signs
3 19
There are zeros between x = –2 and –1, x = –1
and 0, x = 0 and 1, and x = 2 and 3.
4. Graph Estimate the
x-coordinates at which the relative maximum and
relative minimum occur.
x f (x)
–2 –19
–1 0
0 5
1 2
2 –3
3 –4
4 5
5 30
relative maximum at about x = 0
relative minimum at about x = 3