
Recommended
More Related Content
What's hot
What's hot (20)
Viewers also liked
Viewers also liked (19)
Similar to Integration worksheet.
Similar to Integration worksheet. (20)
Recently uploaded
Recently uploaded (20)
Integration worksheet.
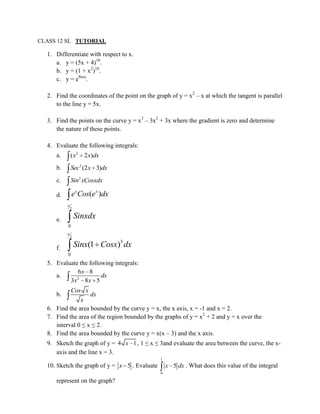
- 1. CLASS 12 SL TUTORIAL 1. Differentiate with respect to x. a. y = (5x + 4)10. b. y = (1 + x2)10. c. y = eSinx. 2. Find the coordinates of the point on the graph of y = x2 – x at which the tangent is parallel to the line y = 5x. 3. Find the points on the curve y = x3 – 3x2 + 3x where the gradient is zero and determine the nature of these points. 4. Evaluate the following integrals: a. ( x2 2 x)dx b. Sec2 (2 x 3)dx c. Sin2 xCosxdx d. e xCos(e x )dx 2 e. Sinxdx 0 2 f. Sinx(1 Cosx)3 dx 0 5. Evaluate the following integrals: 6x 8 a. 2 dx 3x 8 x 5 Cos x b. dx x 6. Find the area bounded by the curve y = x, the x axis, x = -1 and x = 2. 7. Find the area of the region bounded by the graphs of y = x2 + 2 and y = x over the interval 0 ≤ x ≤ 2. 8. Find the area bounded by the curve y = x(x – 3) and the x axis. 9. Sketch the graph of y = 4 x 1 , 1 ≤ x ≤ 3and evaluate the area between the curve, the x- axis and the line x = 3. 1 10. Sketch the graph of y = x 5 . Evaluate x 5 dx . What does this value of the integral 0 represent on the graph?
- 2. 11. Find the equation of the normal to the curve with equation y = x3 + 1 at the point (1, 2). 12. The function f is such that f ( x) 2 x 2 . When the graph of f is drawn, it has a minimum point at (3, -7). a. Show that f ( x) x 2 2 x 3 and hence find f ( x) . b. Find f (0), f ( 1), f ( 1) c. Hence sketch the graph of f , labeling it with the information obtained in part (b). 13. The diagram shows part of the graph of y = 12x2(1 – x). y 0 x (a) Write down an integral which represents the area of the shaded region. (b) Find the area of the shaded region. 14. The diagram shows part of the graph of y = 1 . The area of the shaded region is 2 units. x y 0 1 a x Find the exact value of a.