As electric field, that is, force per unit charge is a vector quantity; it can be used to represent overall effect of electric field in system of electric charges. Similarly electric field can be used in pictorial form to describe the overall intensity of the field. Copy the link given below and paste it in new browser window to get more information on Electric Field Lines www.askiitians.com/iit-jee-electrostatics/electric-field-lines/
Alessandro Volta invented electric battery. It was first named as Voltaic Pile. For his contributions to science, the unit of electric potential is named as Volt. John Frederic Daniell developed Daniell cell. Copy the link given below and paste it in new browser window to get more information on Cells in Series and in Parallel www.askiitians.com/iit-jee-electric-current/cells-in-series-and-in-parallel/
The calculation of a Triangle Voltage Stability Index (TVSI) for monitored alternating-current circuits using voltage data from a PSSE load flow study. The analysis provides TVSI values for monitored transmission circuits in the Bulk Electric System under varying power transfers and contingencies.
TVSI provides an indication of the closeness of the load voltage to potential voltage collapse. To provide situational awareness to system operators, AEP proposes monitoring the phase angle across a low loss EHV overhead circuit operating in a system environment and comparing the angle to an established phase angle loci as a proxy for TVSI.
This monitoring could be independent of the line loading or the associated line impedance.
Ekeeda Provides Online Video Lectures, Tutorials & Engineering Courses Available for Top-Tier Universities in India. Lectures from Highly Trained & Experienced Faculty!
Ekeeda - First Year Enginering - Basic Electrical EngineeringEkeedaPvtLtd
The First Year engineering course seems more like an extension of the subjects that students have learned in their 12th class. Subjects like Engineering Physics, Chemistry, and Mathematics, are incorporated into the curriculum. Students will learn about some of the engineering subjects in this first year, and these subjects are similar to all the branches. Everyone will learn some basics related to the other streams in their first year. Ekeeda offers Online First Year Engineering Courses for all the Subjects as per the Syllabus.
Experiment #{Experiment Title}Date Performed .docxrhetttrevannion
Experiment #
{Experiment Title}
Date Performed:
Date Report Submitted:
Report Author:
Lab Partner[s]:
Instructor’s Name:
Section Number:
I. Introduction
Three sentences are fine for the introduction. State what you measured, what you calculated, and what you are comparing your results to. Avoid using first person in the report. This section is 5 points. Refer to Appendix B and your Lab 1 Report for full instructions.
II. Data
This section is worth 20 points.
All measurements must be included and have proper unites and significant figures.
Data needs to be neat and understandable with explanations or equations.
Put in-lab data sheets signed behind this page when submitting the paper copy of your report.
The “data” heading can stay on the same page as the introduction or be hand written on top of the data sheet.
Refer to Appendix B and your Lab 1 Report for full instructions and how to achieve full points.
III. Data Analysis
This section is worth 30 points. It contains the calculations, graphs, and sample calculations if one was performed repeatedly. Always calculate a percent difference between experimental and theoretical vales. There are directions on how to set up graphs in Appendix B.
You can use Word to type equations by clicking “Equation” on the “Insert” Tab or by clicking Alt and = simultaneously. Word lets you use Latex or Unicode to type equations. It also has buttons to press to insert symbols under the new “Design” tab if you do not know Latex or Unicode. If you hover over button, it will tell you how to type it using Latex or Unicode (whatever is selected)
The hypotenuse length can be found using the side lengths:
Refer to Appendix B and your Lab 1 Report for full instructions and how to achieve full points.
IV. Discussion
This section will contain a table of summary results and paragraphs discussing the accuracy of results, the sources of errors, and the physics or answers to questions. Below is a sample summary table. Please be sure to update it or replace it with a table for the correct information.
Table 1 : Summary of Results
Measured Diameter [m]
Error in Measured
Theoretical Diameter [m]
%Difference
It is important to discuss types of error and largest error in your experiment. Refer to Section D of Appendix B and the Discussion from Lab 1 for more information.
V. Conclusion
You only need two sentences minimum and this section is worth 5 points. Refer to Appendix B and your Lab 1 Report for full instructions and how to achieve full points.
2
Experiment 2
Electric Potential and Field Mapping
Introduction
In this experiment, you use a voltage probe and a computer data acquisition system to
measure the electric potential between two metal electrodes. The electrodes are placed in a tray,
which contains a shallow layer of water. The electrodes are connected to a D.C. power supply,
which maintains a constant potential difference. The water allows an electric current to flow
fr.
Experiment #{Experiment Title}Date Performed .docxnealwaters20034
Experiment #
{Experiment Title}
Date Performed:
Date Report Submitted:
Report Author:
Lab Partner[s]:
Instructor’s Name:
Section Number:
I. Introduction
Three sentences are fine for the introduction. State what you measured, what you calculated, and what you are comparing your results to. Avoid using first person in the report. This section is 5 points. Refer to Appendix B and your Lab 1 Report for full instructions.
II. Data
This section is worth 20 points.
All measurements must be included and have proper unites and significant figures.
Data needs to be neat and understandable with explanations or equations.
Put in-lab data sheets signed behind this page when submitting the paper copy of your report.
The “data” heading can stay on the same page as the introduction or be hand written on top of the data sheet.
Refer to Appendix B and your Lab 1 Report for full instructions and how to achieve full points.
III. Data Analysis
This section is worth 30 points. It contains the calculations, graphs, and sample calculations if one was performed repeatedly. Always calculate a percent difference between experimental and theoretical vales. There are directions on how to set up graphs in Appendix B.
You can use Word to type equations by clicking “Equation” on the “Insert” Tab or by clicking Alt and = simultaneously. Word lets you use Latex or Unicode to type equations. It also has buttons to press to insert symbols under the new “Design” tab if you do not know Latex or Unicode. If you hover over button, it will tell you how to type it using Latex or Unicode (whatever is selected)
The hypotenuse length can be found using the side lengths:
Refer to Appendix B and your Lab 1 Report for full instructions and how to achieve full points.
IV. Discussion
This section will contain a table of summary results and paragraphs discussing the accuracy of results, the sources of errors, and the physics or answers to questions. Below is a sample summary table. Please be sure to update it or replace it with a table for the correct information.
Table 1 : Summary of Results
Measured Diameter [m]
Error in Measured
Theoretical Diameter [m]
%Difference
It is important to discuss types of error and largest error in your experiment. Refer to Section D of Appendix B and the Discussion from Lab 1 for more information.
V. Conclusion
You only need two sentences minimum and this section is worth 5 points. Refer to Appendix B and your Lab 1 Report for full instructions and how to achieve full points.
2
Experiment 2
Electric Potential and Field Mapping
Introduction
In this experiment, you use a voltage probe and a computer data acquisition system to
measure the electric potential between two metal electrodes. The electrodes are placed in a tray,
which contains a shallow layer of water. The electrodes are connected to a D.C. power supply,
which maintains a constant potential difference. The water allows an electric current to flow
fr.
Acetabularia Information For Class 9 .docxvaibhavrinwa19
Acetabularia acetabulum is a single-celled green alga that in its vegetative state is morphologically differentiated into a basal rhizoid and an axially elongated stalk, which bears whorls of branching hairs. The single diploid nucleus resides in the rhizoid.
Macroeconomics- Movie Location
This will be used as part of your Personal Professional Portfolio once graded.
Objective:
Prepare a presentation or a paper using research, basic comparative analysis, data organization and application of economic information. You will make an informed assessment of an economic climate outside of the United States to accomplish an entertainment industry objective.
A Strategic Approach: GenAI in EducationPeter Windle
Artificial Intelligence (AI) technologies such as Generative AI, Image Generators and Large Language Models have had a dramatic impact on teaching, learning and assessment over the past 18 months. The most immediate threat AI posed was to Academic Integrity with Higher Education Institutes (HEIs) focusing their efforts on combating the use of GenAI in assessment. Guidelines were developed for staff and students, policies put in place too. Innovative educators have forged paths in the use of Generative AI for teaching, learning and assessments leading to pockets of transformation springing up across HEIs, often with little or no top-down guidance, support or direction.
This Gasta posits a strategic approach to integrating AI into HEIs to prepare staff, students and the curriculum for an evolving world and workplace. We will highlight the advantages of working with these technologies beyond the realm of teaching, learning and assessment by considering prompt engineering skills, industry impact, curriculum changes, and the need for staff upskilling. In contrast, not engaging strategically with Generative AI poses risks, including falling behind peers, missed opportunities and failing to ensure our graduates remain employable. The rapid evolution of AI technologies necessitates a proactive and strategic approach if we are to remain relevant.
The Roman Empire A Historical Colossus.pdfkaushalkr1407
The Roman Empire, a vast and enduring power, stands as one of history's most remarkable civilizations, leaving an indelible imprint on the world. It emerged from the Roman Republic, transitioning into an imperial powerhouse under the leadership of Augustus Caesar in 27 BCE. This transformation marked the beginning of an era defined by unprecedented territorial expansion, architectural marvels, and profound cultural influence.
The empire's roots lie in the city of Rome, founded, according to legend, by Romulus in 753 BCE. Over centuries, Rome evolved from a small settlement to a formidable republic, characterized by a complex political system with elected officials and checks on power. However, internal strife, class conflicts, and military ambitions paved the way for the end of the Republic. Julius Caesar’s dictatorship and subsequent assassination in 44 BCE created a power vacuum, leading to a civil war. Octavian, later Augustus, emerged victorious, heralding the Roman Empire’s birth.
Under Augustus, the empire experienced the Pax Romana, a 200-year period of relative peace and stability. Augustus reformed the military, established efficient administrative systems, and initiated grand construction projects. The empire's borders expanded, encompassing territories from Britain to Egypt and from Spain to the Euphrates. Roman legions, renowned for their discipline and engineering prowess, secured and maintained these vast territories, building roads, fortifications, and cities that facilitated control and integration.
The Roman Empire’s society was hierarchical, with a rigid class system. At the top were the patricians, wealthy elites who held significant political power. Below them were the plebeians, free citizens with limited political influence, and the vast numbers of slaves who formed the backbone of the economy. The family unit was central, governed by the paterfamilias, the male head who held absolute authority.
Culturally, the Romans were eclectic, absorbing and adapting elements from the civilizations they encountered, particularly the Greeks. Roman art, literature, and philosophy reflected this synthesis, creating a rich cultural tapestry. Latin, the Roman language, became the lingua franca of the Western world, influencing numerous modern languages.
Roman architecture and engineering achievements were monumental. They perfected the arch, vault, and dome, constructing enduring structures like the Colosseum, Pantheon, and aqueducts. These engineering marvels not only showcased Roman ingenuity but also served practical purposes, from public entertainment to water supply.
How to Make a Field invisible in Odoo 17Celine George
It is possible to hide or invisible some fields in odoo. Commonly using “invisible” attribute in the field definition to invisible the fields. This slide will show how to make a field invisible in odoo 17.
Francesca Gottschalk - How can education support child empowerment.pptxEduSkills OECD
Francesca Gottschalk from the OECD’s Centre for Educational Research and Innovation presents at the Ask an Expert Webinar: How can education support child empowerment?
Instructions for Submissions thorugh G- Classroom.pptxJheel Barad
This presentation provides a briefing on how to upload submissions and documents in Google Classroom. It was prepared as part of an orientation for new Sainik School in-service teacher trainees. As a training officer, my goal is to ensure that you are comfortable and proficient with this essential tool for managing assignments and fostering student engagement.
BÀI TẬP BỔ TRỢ TIẾNG ANH GLOBAL SUCCESS LỚP 3 - CẢ NĂM (CÓ FILE NGHE VÀ ĐÁP Á...
Grade 11, U3 L1-Review of CCT's
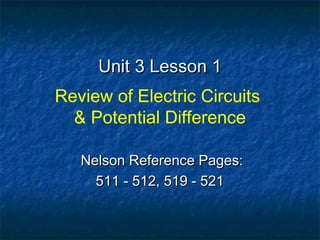
1. Unit 3 Lesson 1Unit 3 Lesson 1
Review of Electric Circuits
& Potential Difference
Nelson Reference Pages:Nelson Reference Pages:
511 - 512, 519 - 521511 - 512, 519 - 521
2. S e r ie s C ir c u it
( O n e L o o p )
In Grade 9 Science, you were introduced to twoIn Grade 9 Science, you were introduced to two
types of circuits: _________ & ____________ .types of circuits: _________ & ____________ .
These are shown above.These are shown above.
Label the symbols used in the two diagramsLabel the symbols used in the two diagrams
above. Your textbook has more symbols listedabove. Your textbook has more symbols listed
on page 520.on page 520.
P a r a lle l C ir c u it
( T w o o r M o r e L o o p s )
3. Electric Potential Difference (PD)
Often calledOften called potential difference, or, or
justjust voltage, there are various, there are various
ways we can define this quantity.ways we can define this quantity.
Consider the diagram on the right.Consider the diagram on the right.
The voltmeter will measure the PDThe voltmeter will measure the PD
across the light which is turnedacross the light which is turned
___ . The reading (in Volts) would___ . The reading (in Volts) would
be equal to:be equal to:
1.) V = ΔEQ/Q oror 2.) V = W/Q
The first equation hasThe first equation has V, or PD,, or PD,
equal to the energy difference (inequal to the energy difference (in
Joules) before and after aJoules) before and after a load
divided by the amount of chargedivided by the amount of charge
((Q) that went through the load.) that went through the load.
V
4. TheThe second equation uses the work required (inuses the work required (in
Joules) to move charge through the load divided byJoules) to move charge through the load divided by
the amount of charge moved. Charge (Q) isthe amount of charge moved. Charge (Q) is
measured in __________ .measured in __________ .
All loads (motors, lights, resistors) haveAll loads (motors, lights, resistors) have electrical
resistance, which resists (or opposes) the flow of, which resists (or opposes) the flow of
current. As such, it takes work to move electriccurrent. As such, it takes work to move electric
charge through a load. We usually assume thatcharge through a load. We usually assume that
connecting wires have no resistance, so the voltageconnecting wires have no resistance, so the voltage
across a wire in a “live” circuit would be ________ .across a wire in a “live” circuit would be ________ .
Also, from slide 2, we can see that a voltmeter mustAlso, from slide 2, we can see that a voltmeter must
be connected in _________ with a load.be connected in _________ with a load.
From the equations, we see thatFrom the equations, we see that 1 Volt == 1 __ /__ ..
5. Measuring PD in a
Series Circuit
InIn Fig A, there is one, there is one
light bulb. Here,light bulb. Here,
the relationshipthe relationship
betweenbetween V1 andand V2
is: ________is: ________
InIn Fig B, there are, there are
two identical lighttwo identical light
bulbs. Thebulbs. The
relationshiprelationship
betweenbetween V1 ,, V2 andand
V3 is: ____is: ____
________________________
F ig u r e A
V 1
V 2
V 1
V 3
V 2
F ig u r e B
6. The PD across the battery is calledThe PD across the battery is called
the source PD orthe source PD or VS . The rule. The rule
for afor a series circuit is:is:
VS = V1 + V2 +…+ VN , where
there are N loads in series.
The diagram shows threeThe diagram shows three
voltmeters on the parallel cct.voltmeters on the parallel cct.
The relationship between theThe relationship between the
three valuesthree values V1 ,, V2 andand V3 is:is:
___________________ .___________________ .
The rule for a parallel circuit is PDThe rule for a parallel circuit is PD
is equal across ais equal across a branch of the
circuit.
V 2
V 1
V 3
7. In the following diagram, allIn the following diagram, all
lights are identical. Thelights are identical. The
relationship between therelationship between the
voltages (PD’s) acrossvoltages (PD’s) across
each bulb is:each bulb is:
__________________________________________ V 1
V S
V 2
V 3