Power Circuits and Transforers-Unit 5 Labvolt Student Manual
* Active power (P) = 3 kW = 3,000 W
* Inductive reactive power (Q) = 4 kvar
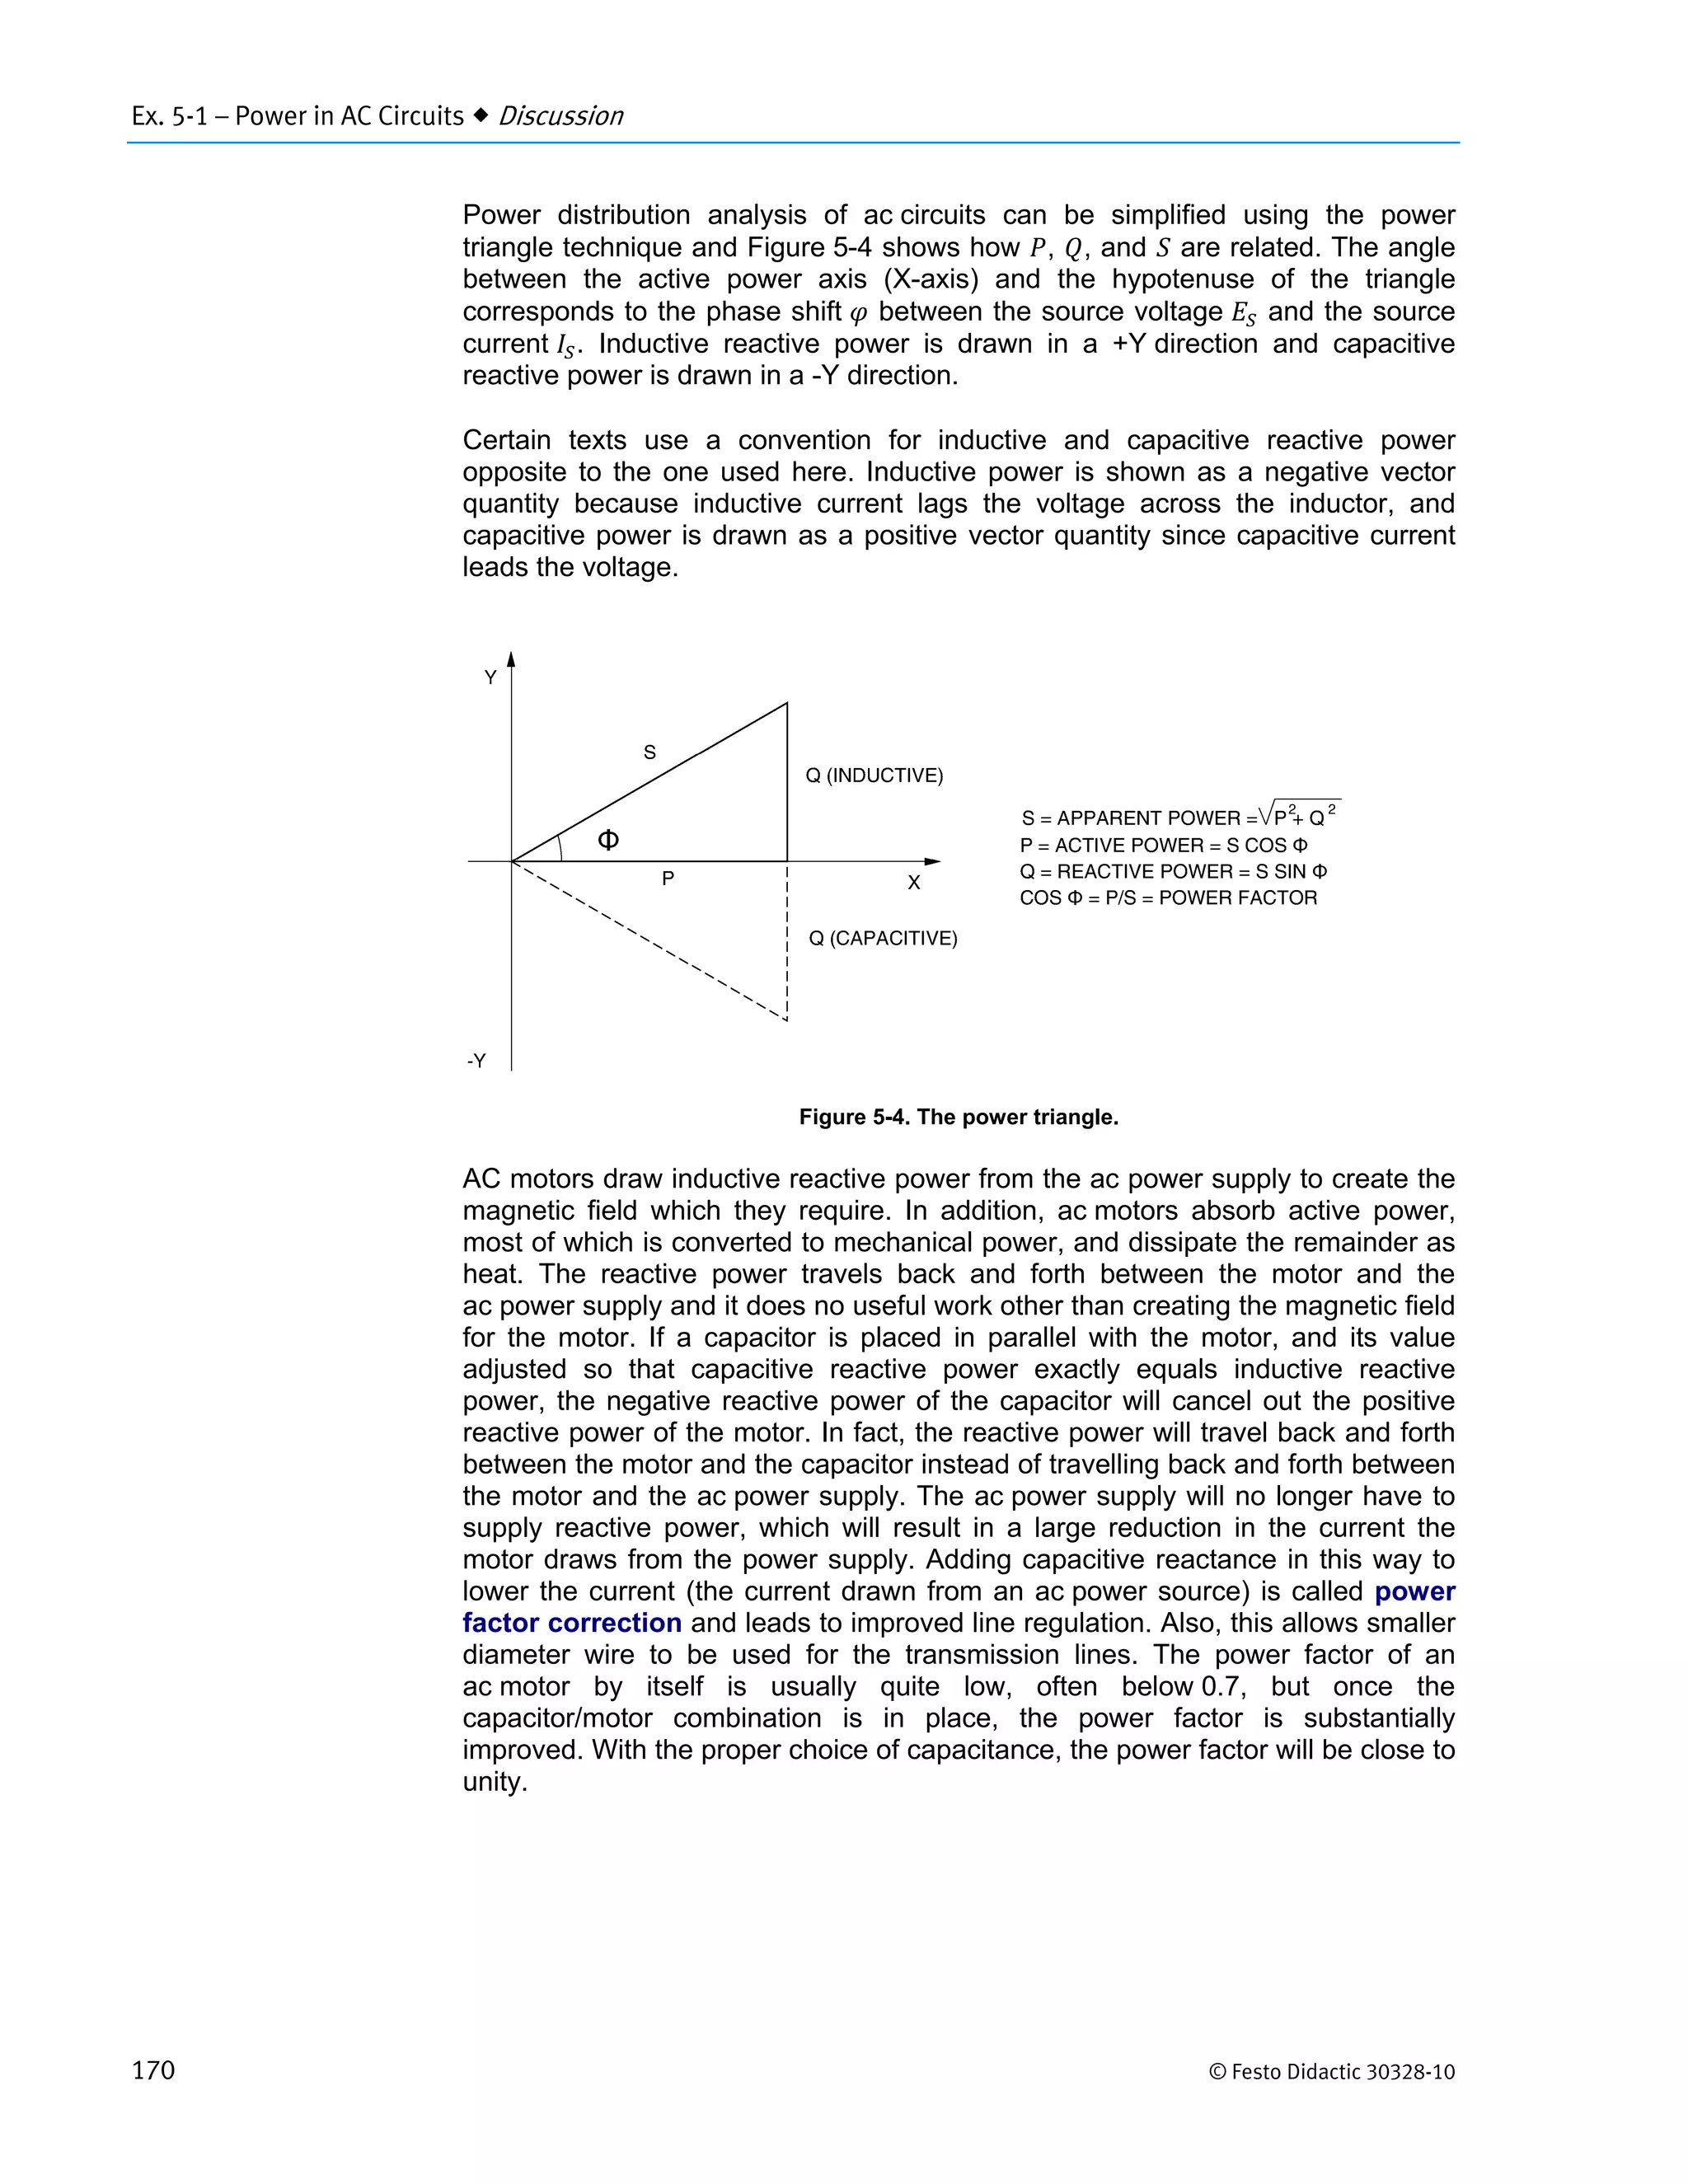
* Using the power triangle:
* Apparent power (S) = √(P^2 + Q^2)
* = √(3,000^2 + 4,000^2)
* = √(9,000,000 + 16,000,000)
* = √25,000,000
* = 5,000 VA = 5 kVA
The apparent power is 5 kVA. The answer is b.
Introduction to active, reactive, and apparent power in AC circuits. Vector diagrams simplify understanding phase relationships and impedance.
Methods to calculate active, reactive, and apparent power in AC circuits. Introduction to power factor and the power triangle concept.
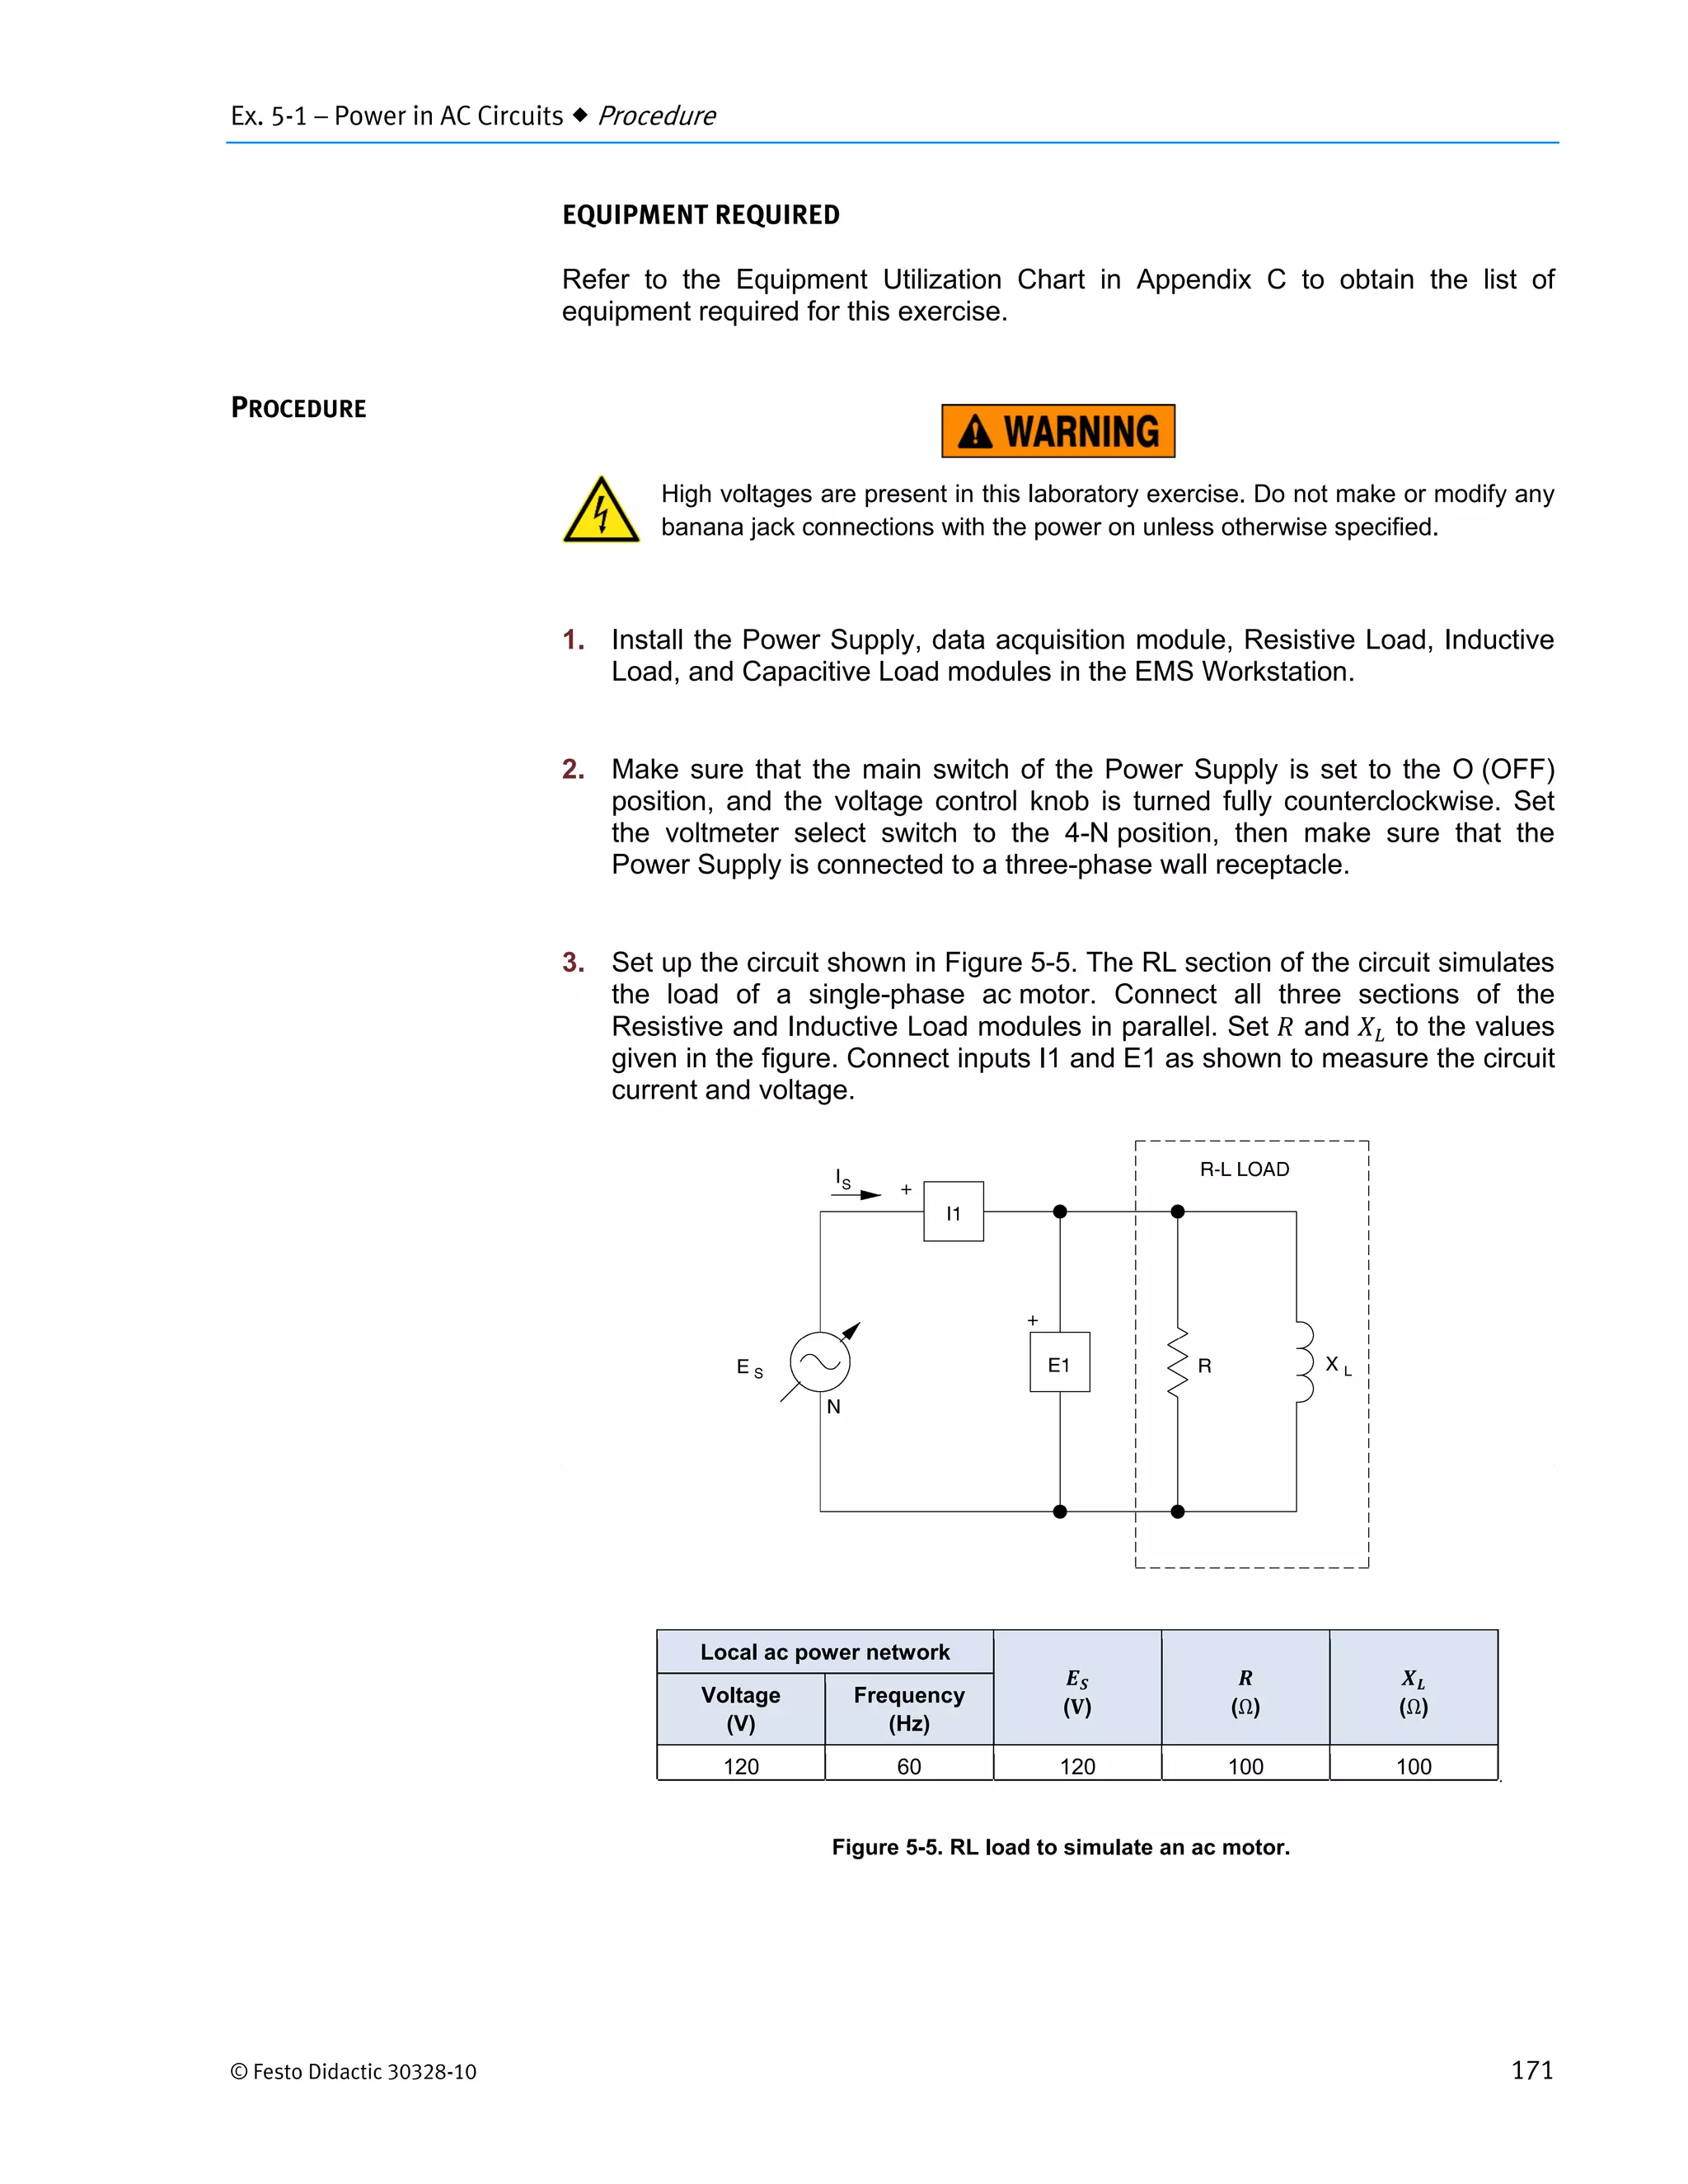
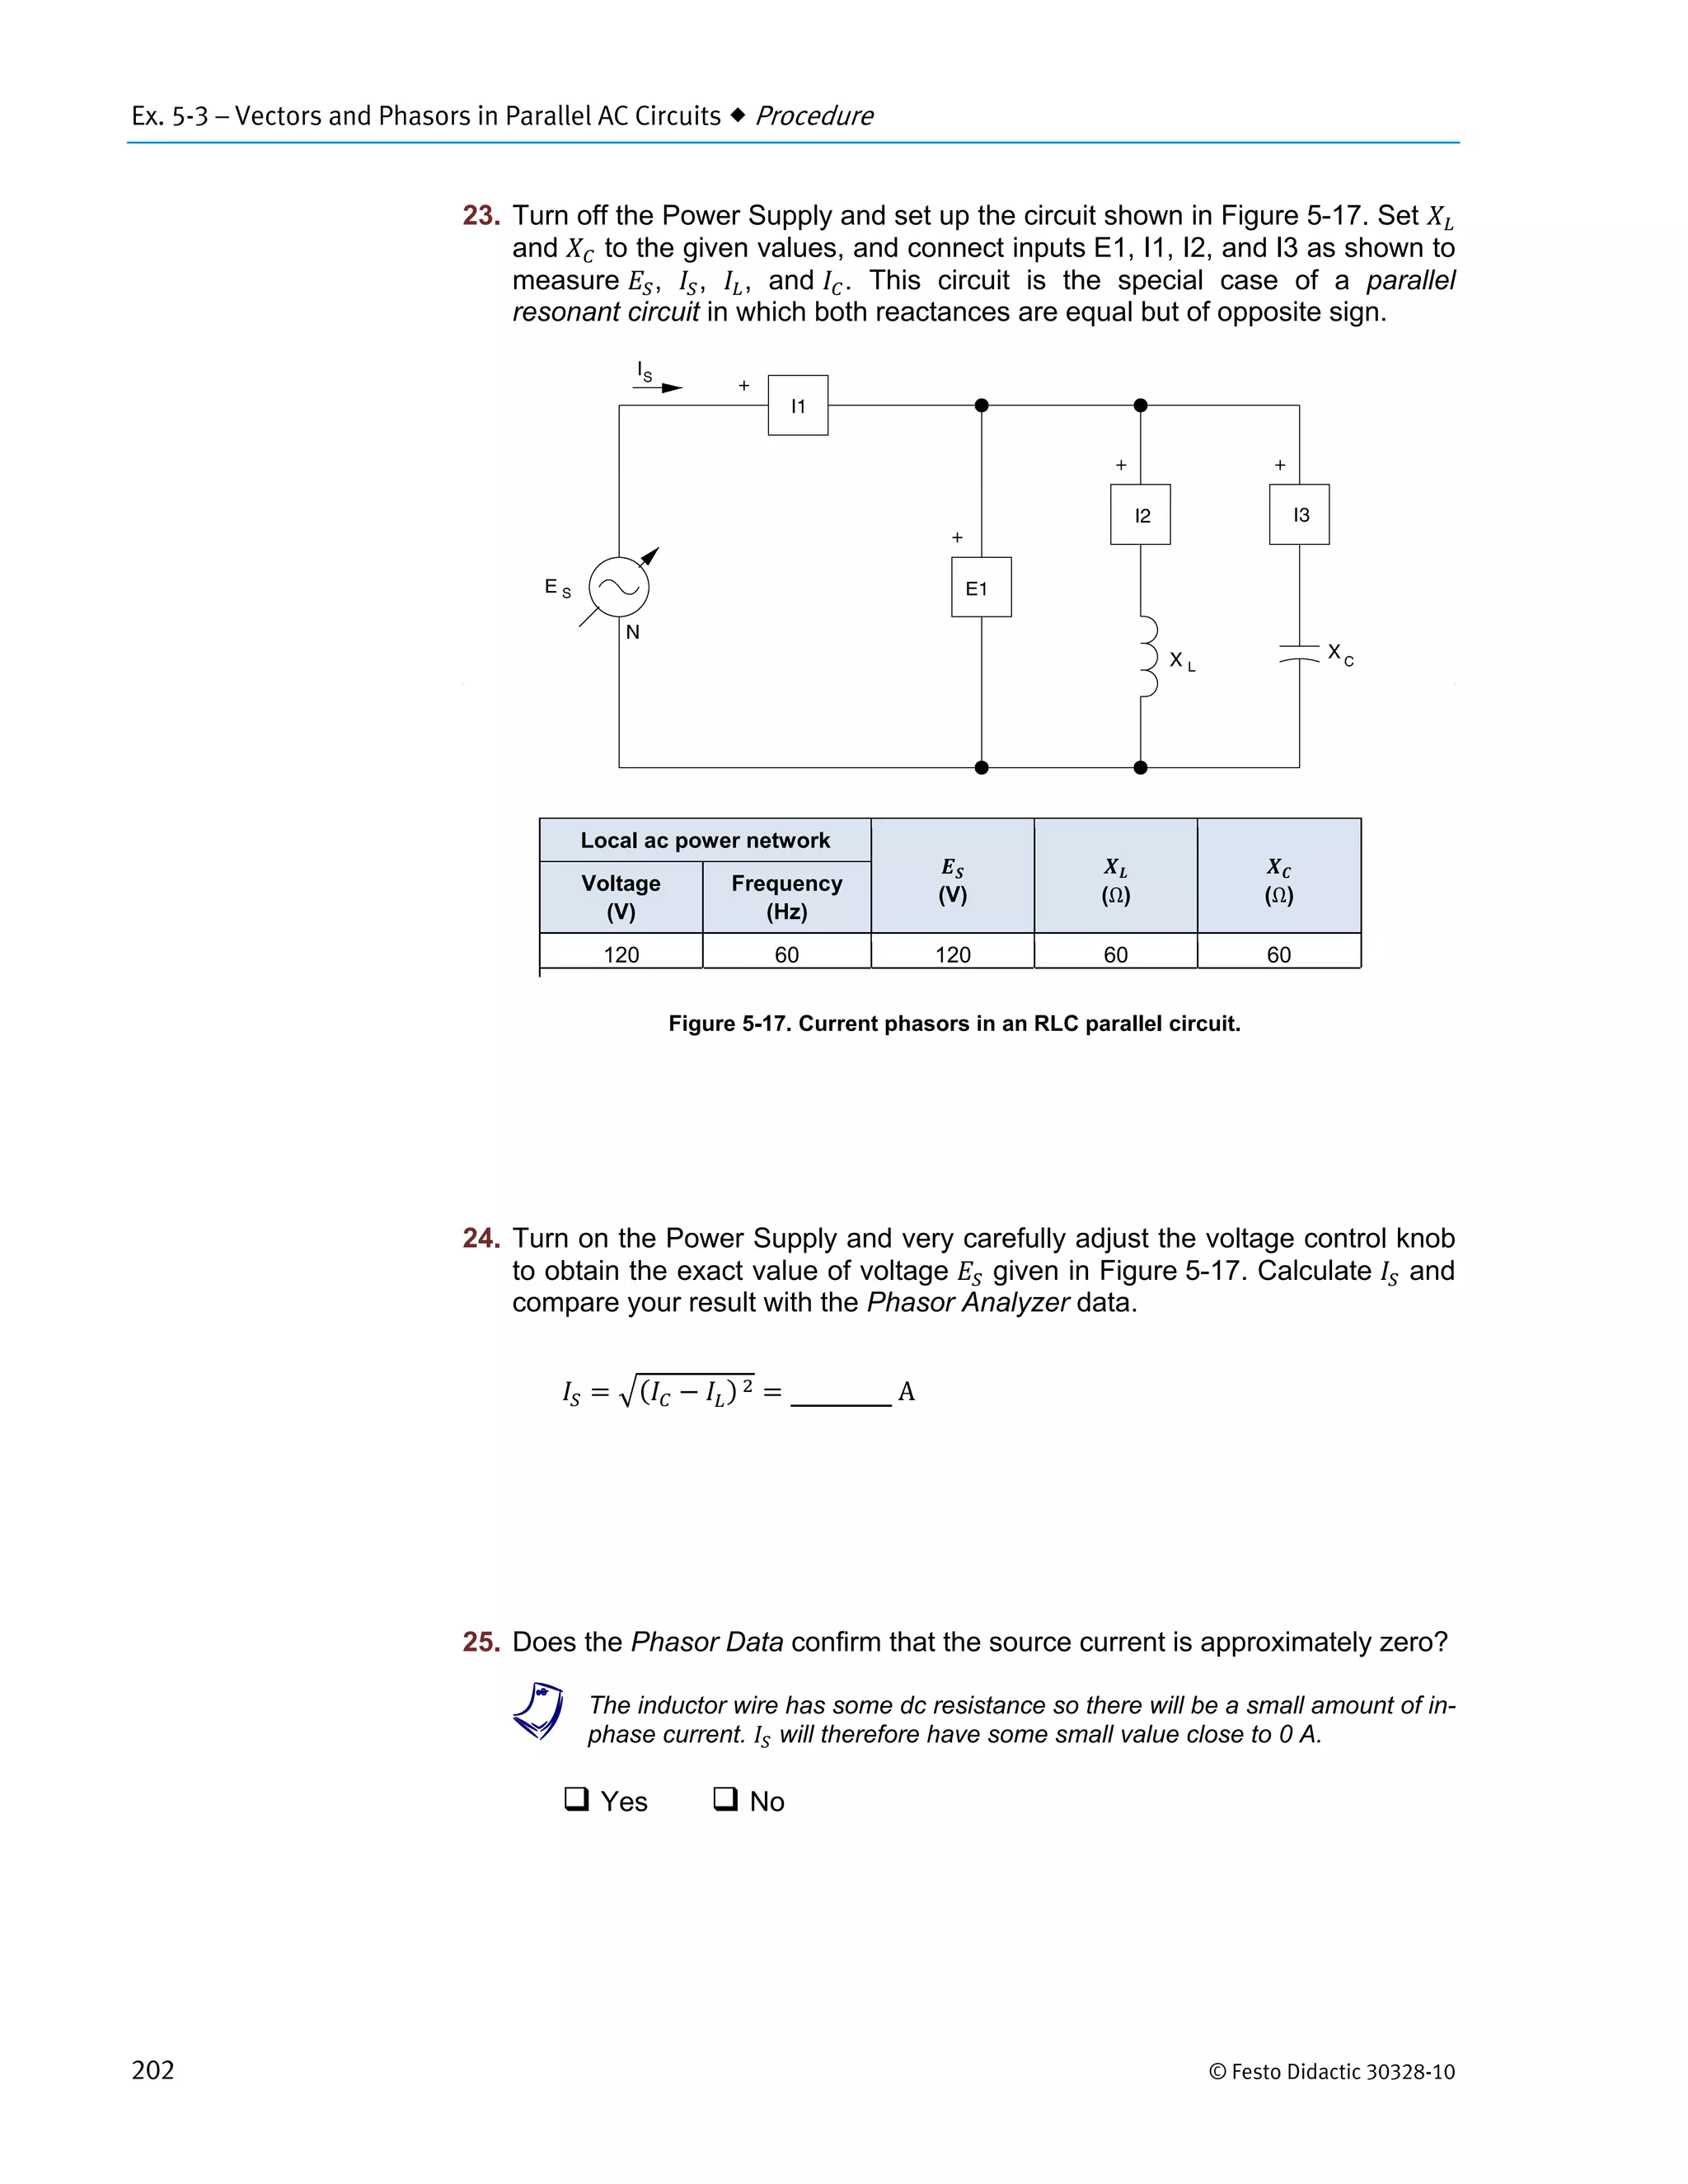
Step-by-step procedure for an exercise to determine power characteristics in AC circuits, including calculations of apparent power, power factor, and reactive power adjustments.
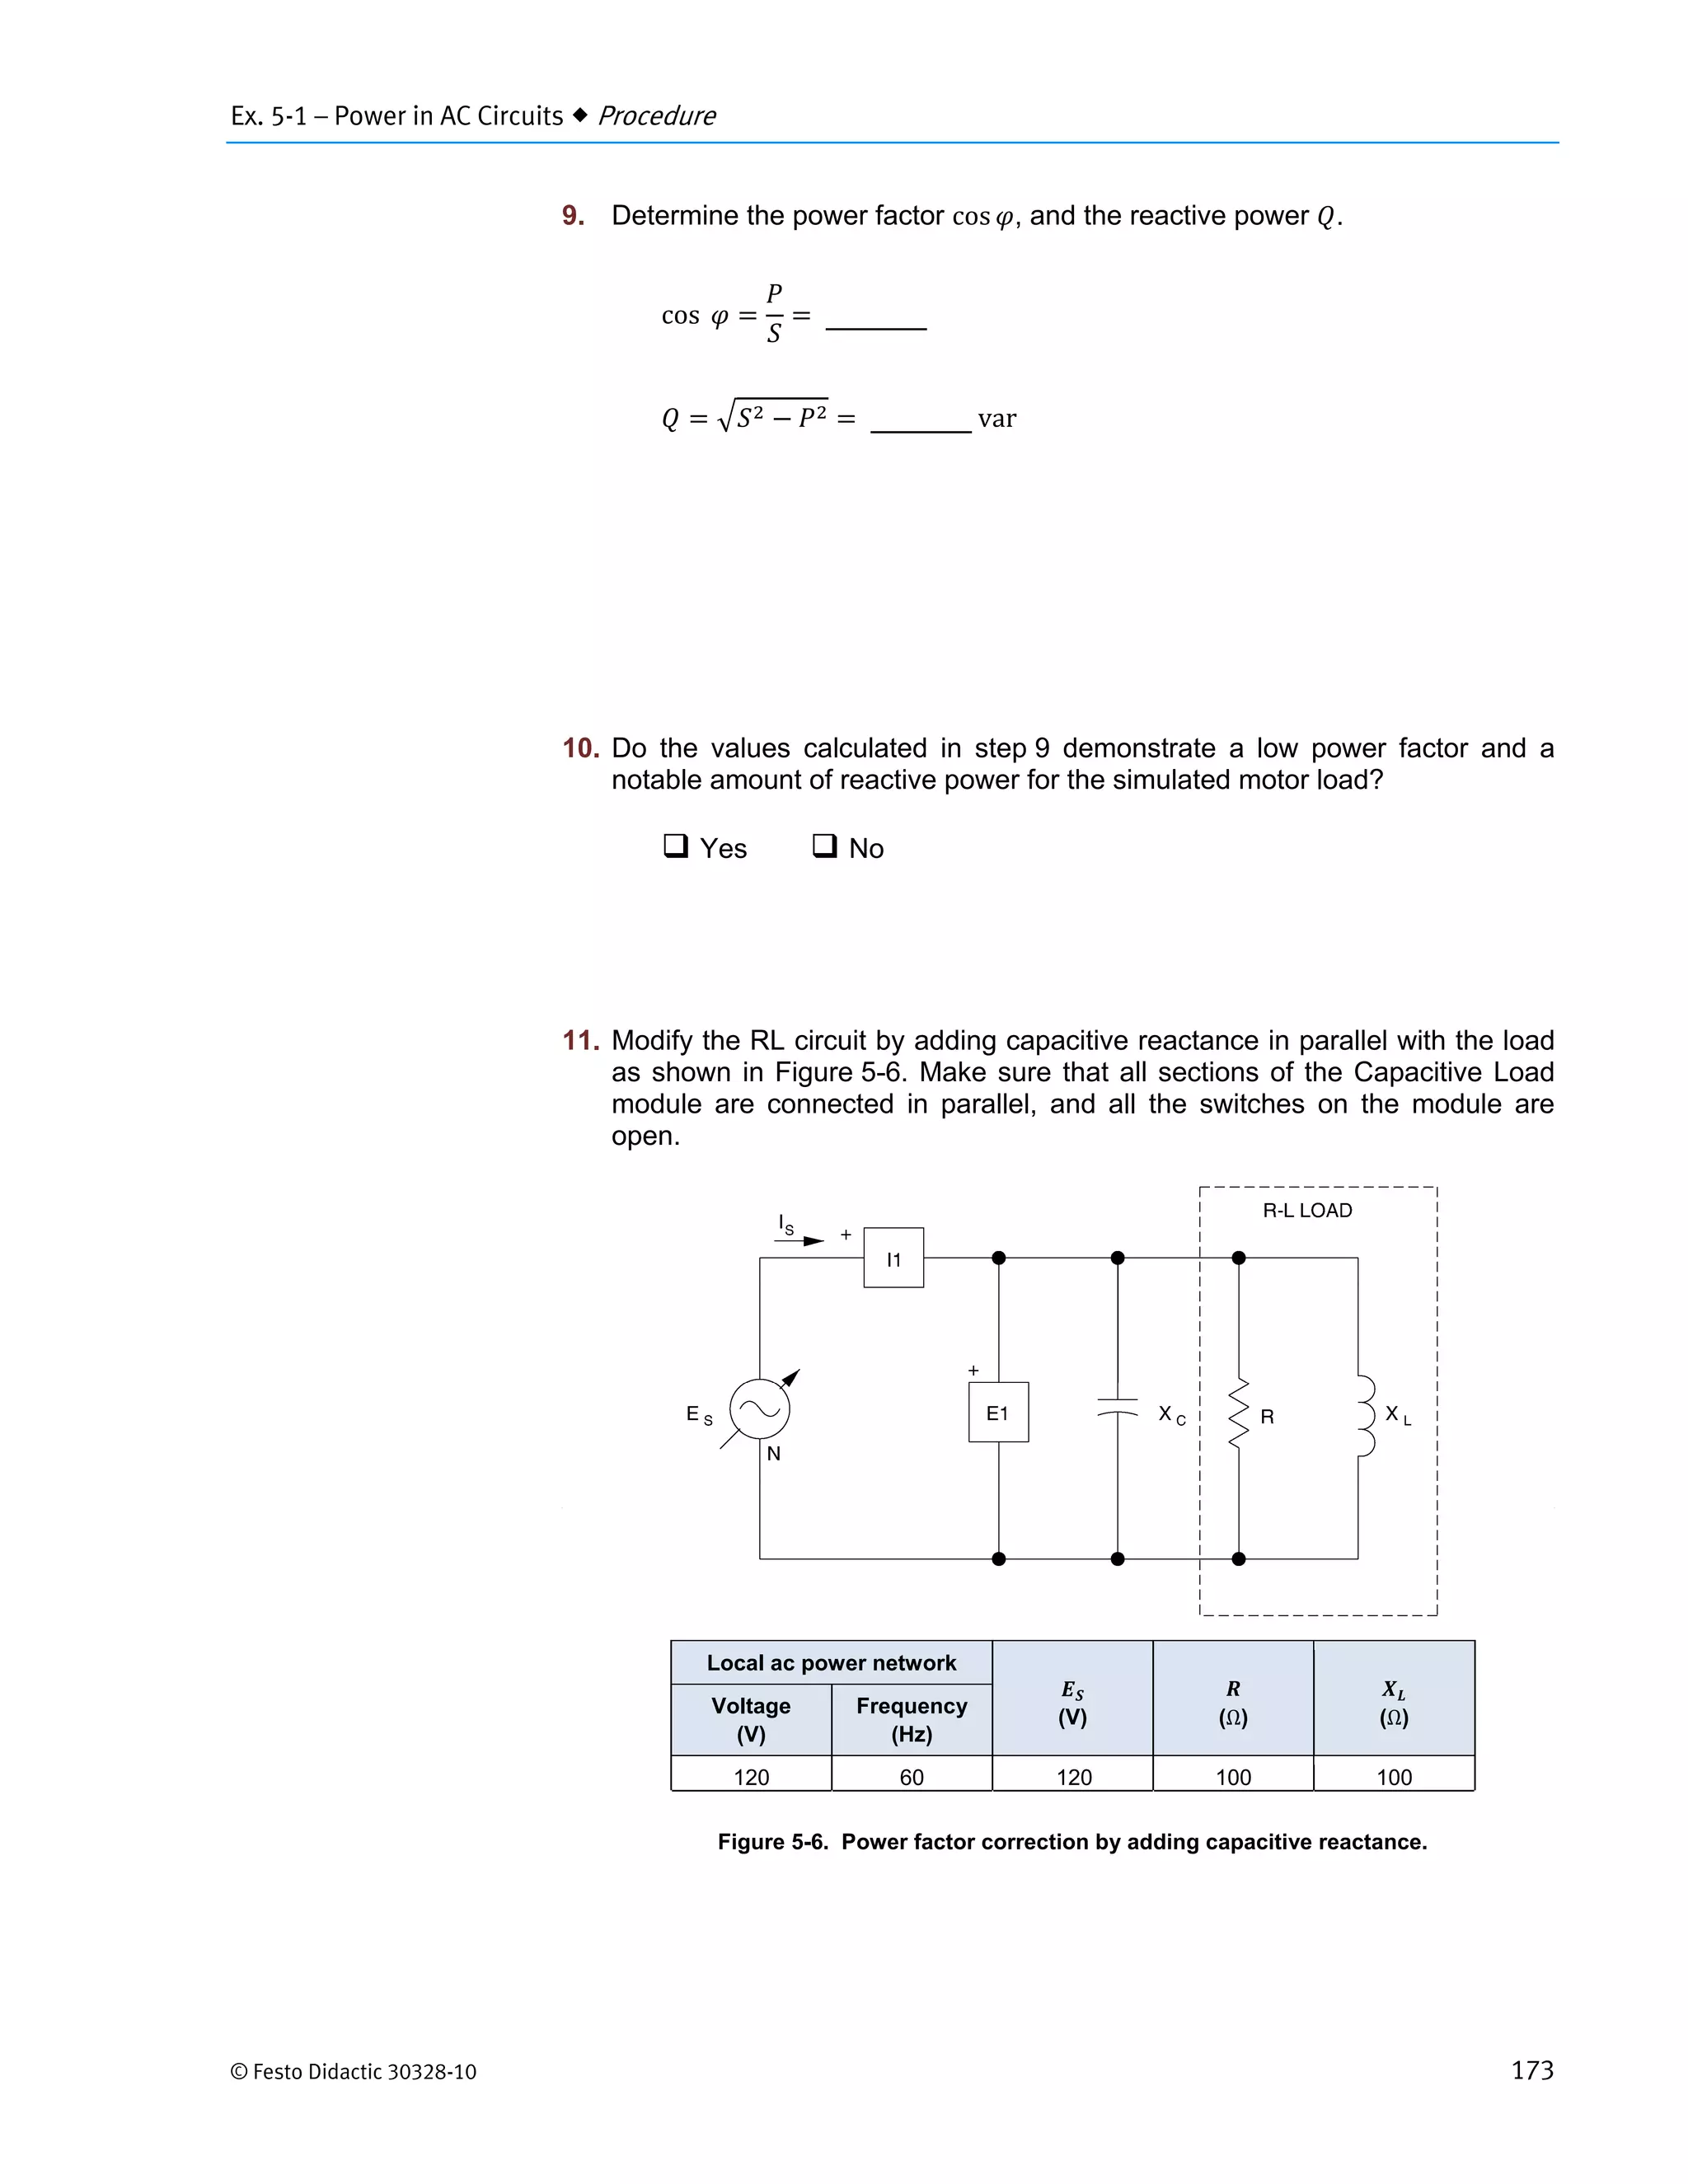
Analysis of adding capacitive loads to improve power factor, and deriving impacts on active and reactive power.
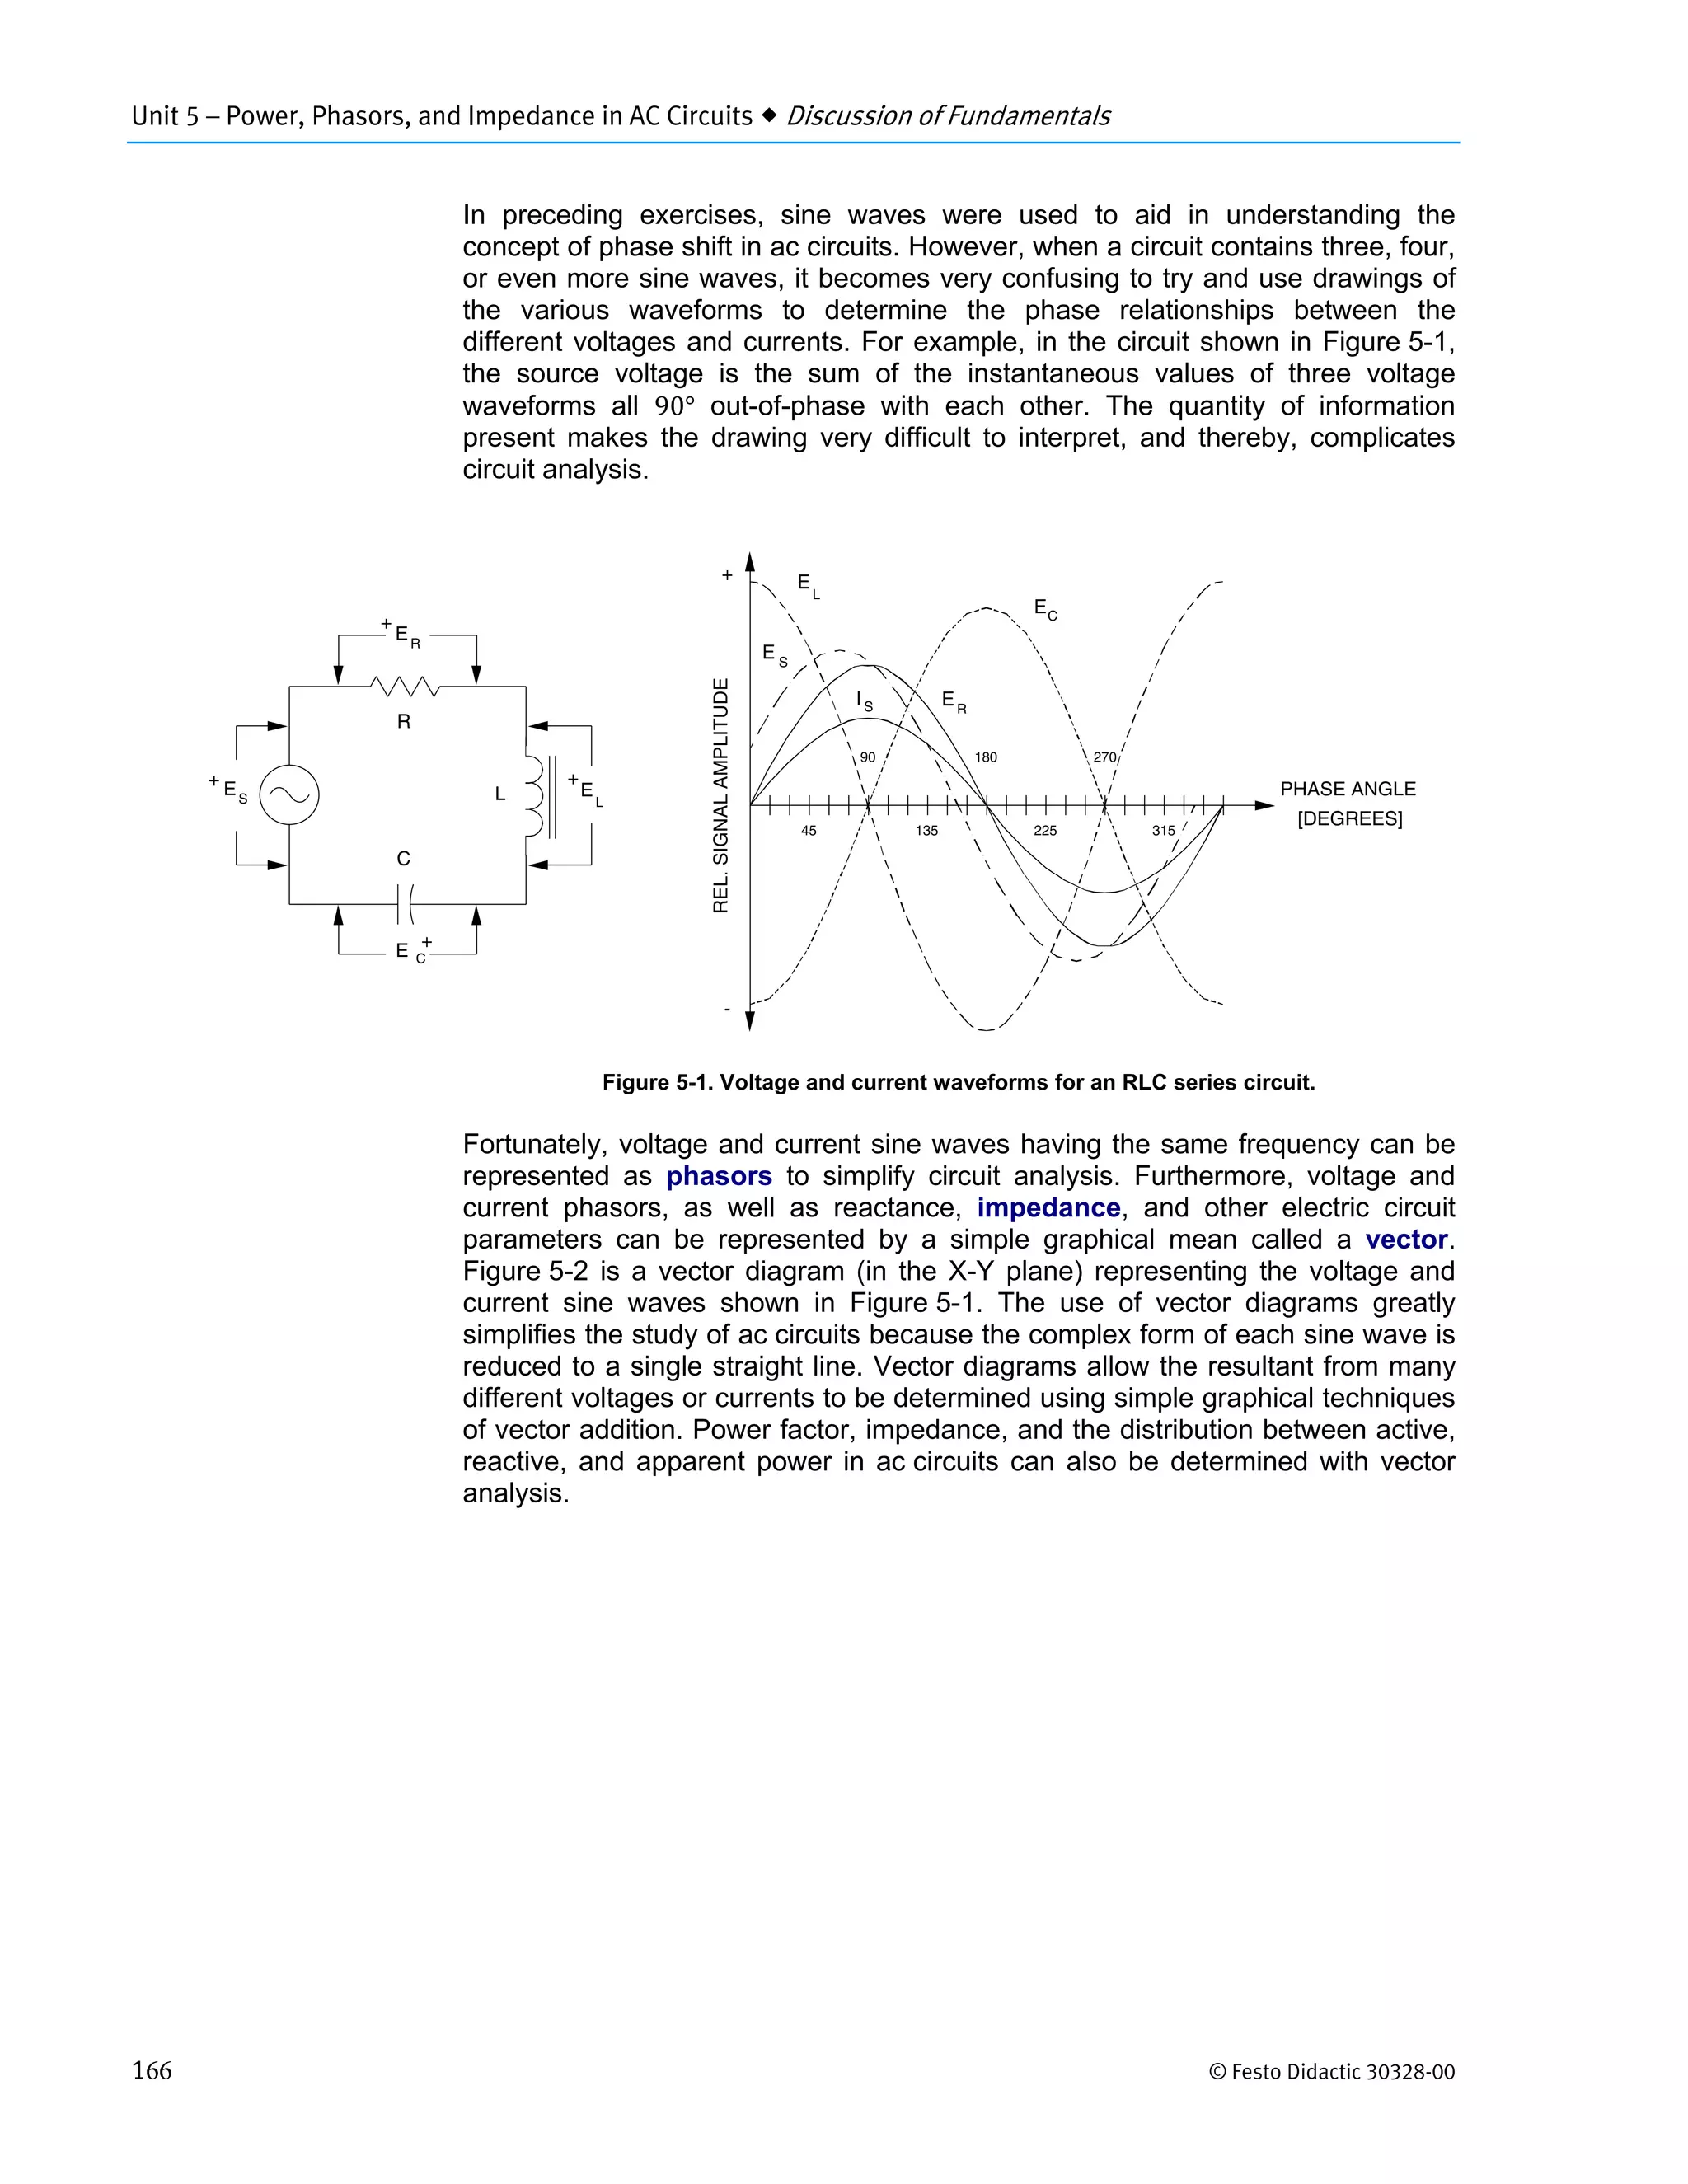
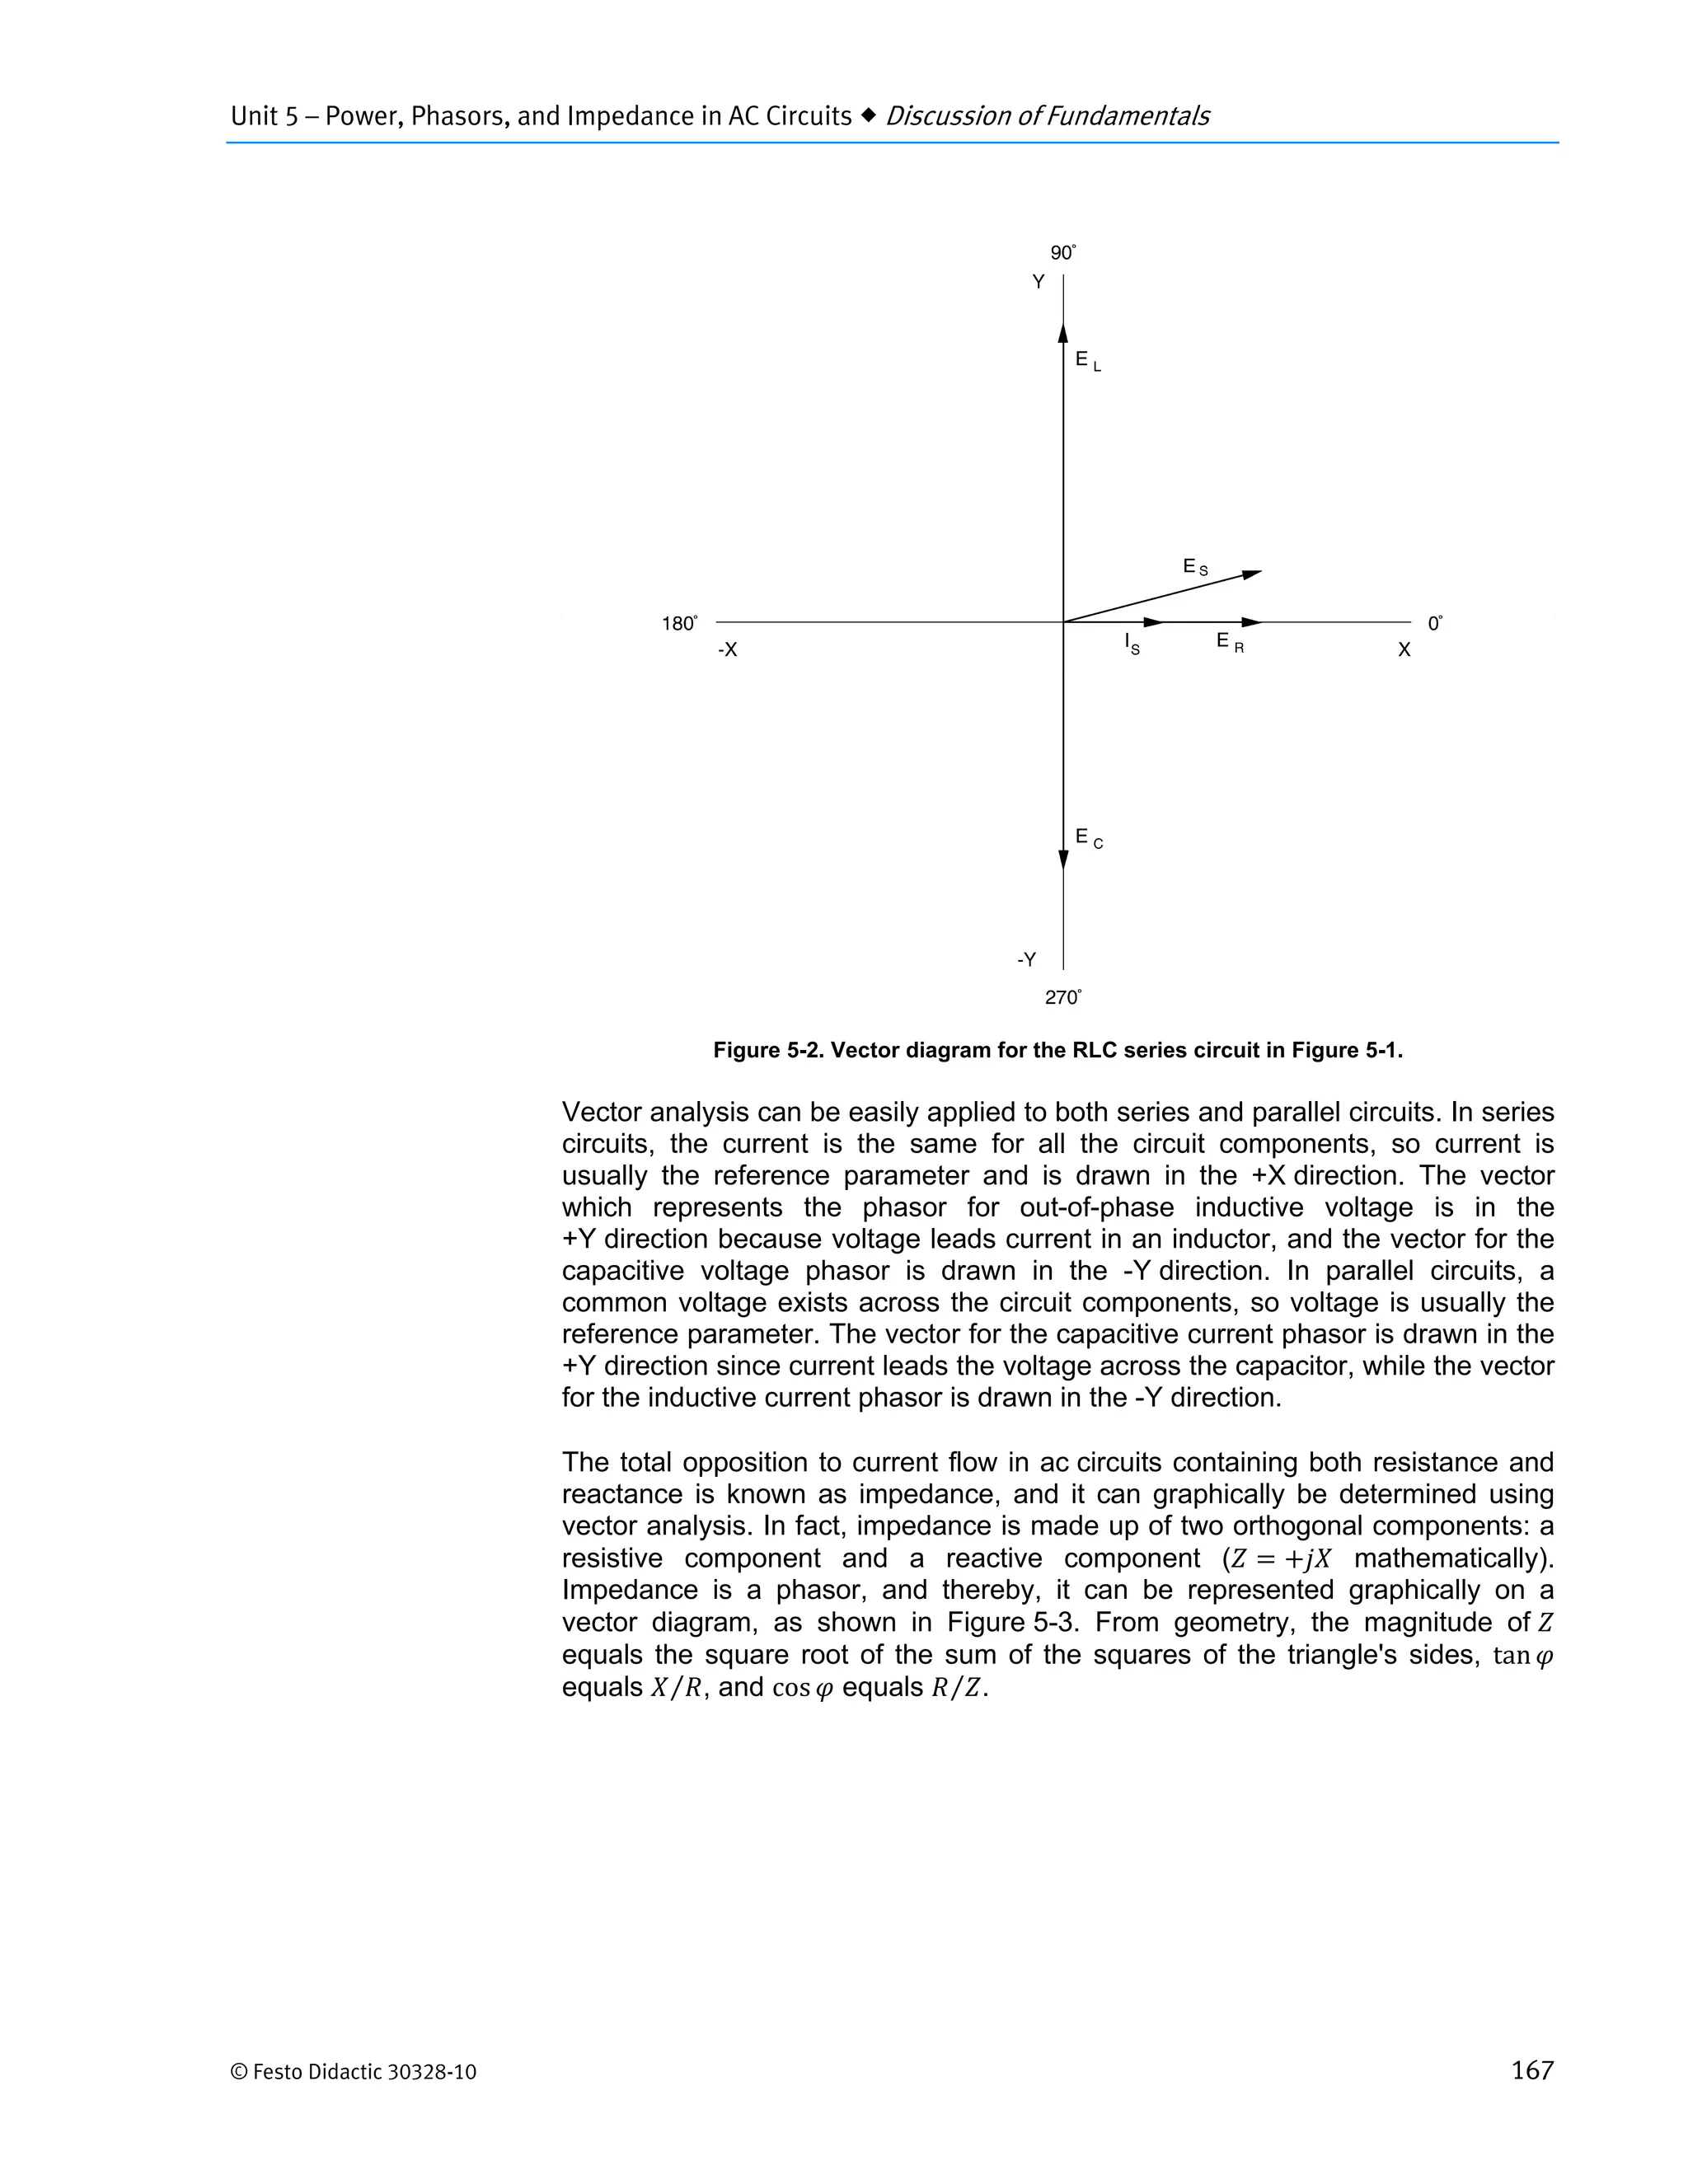
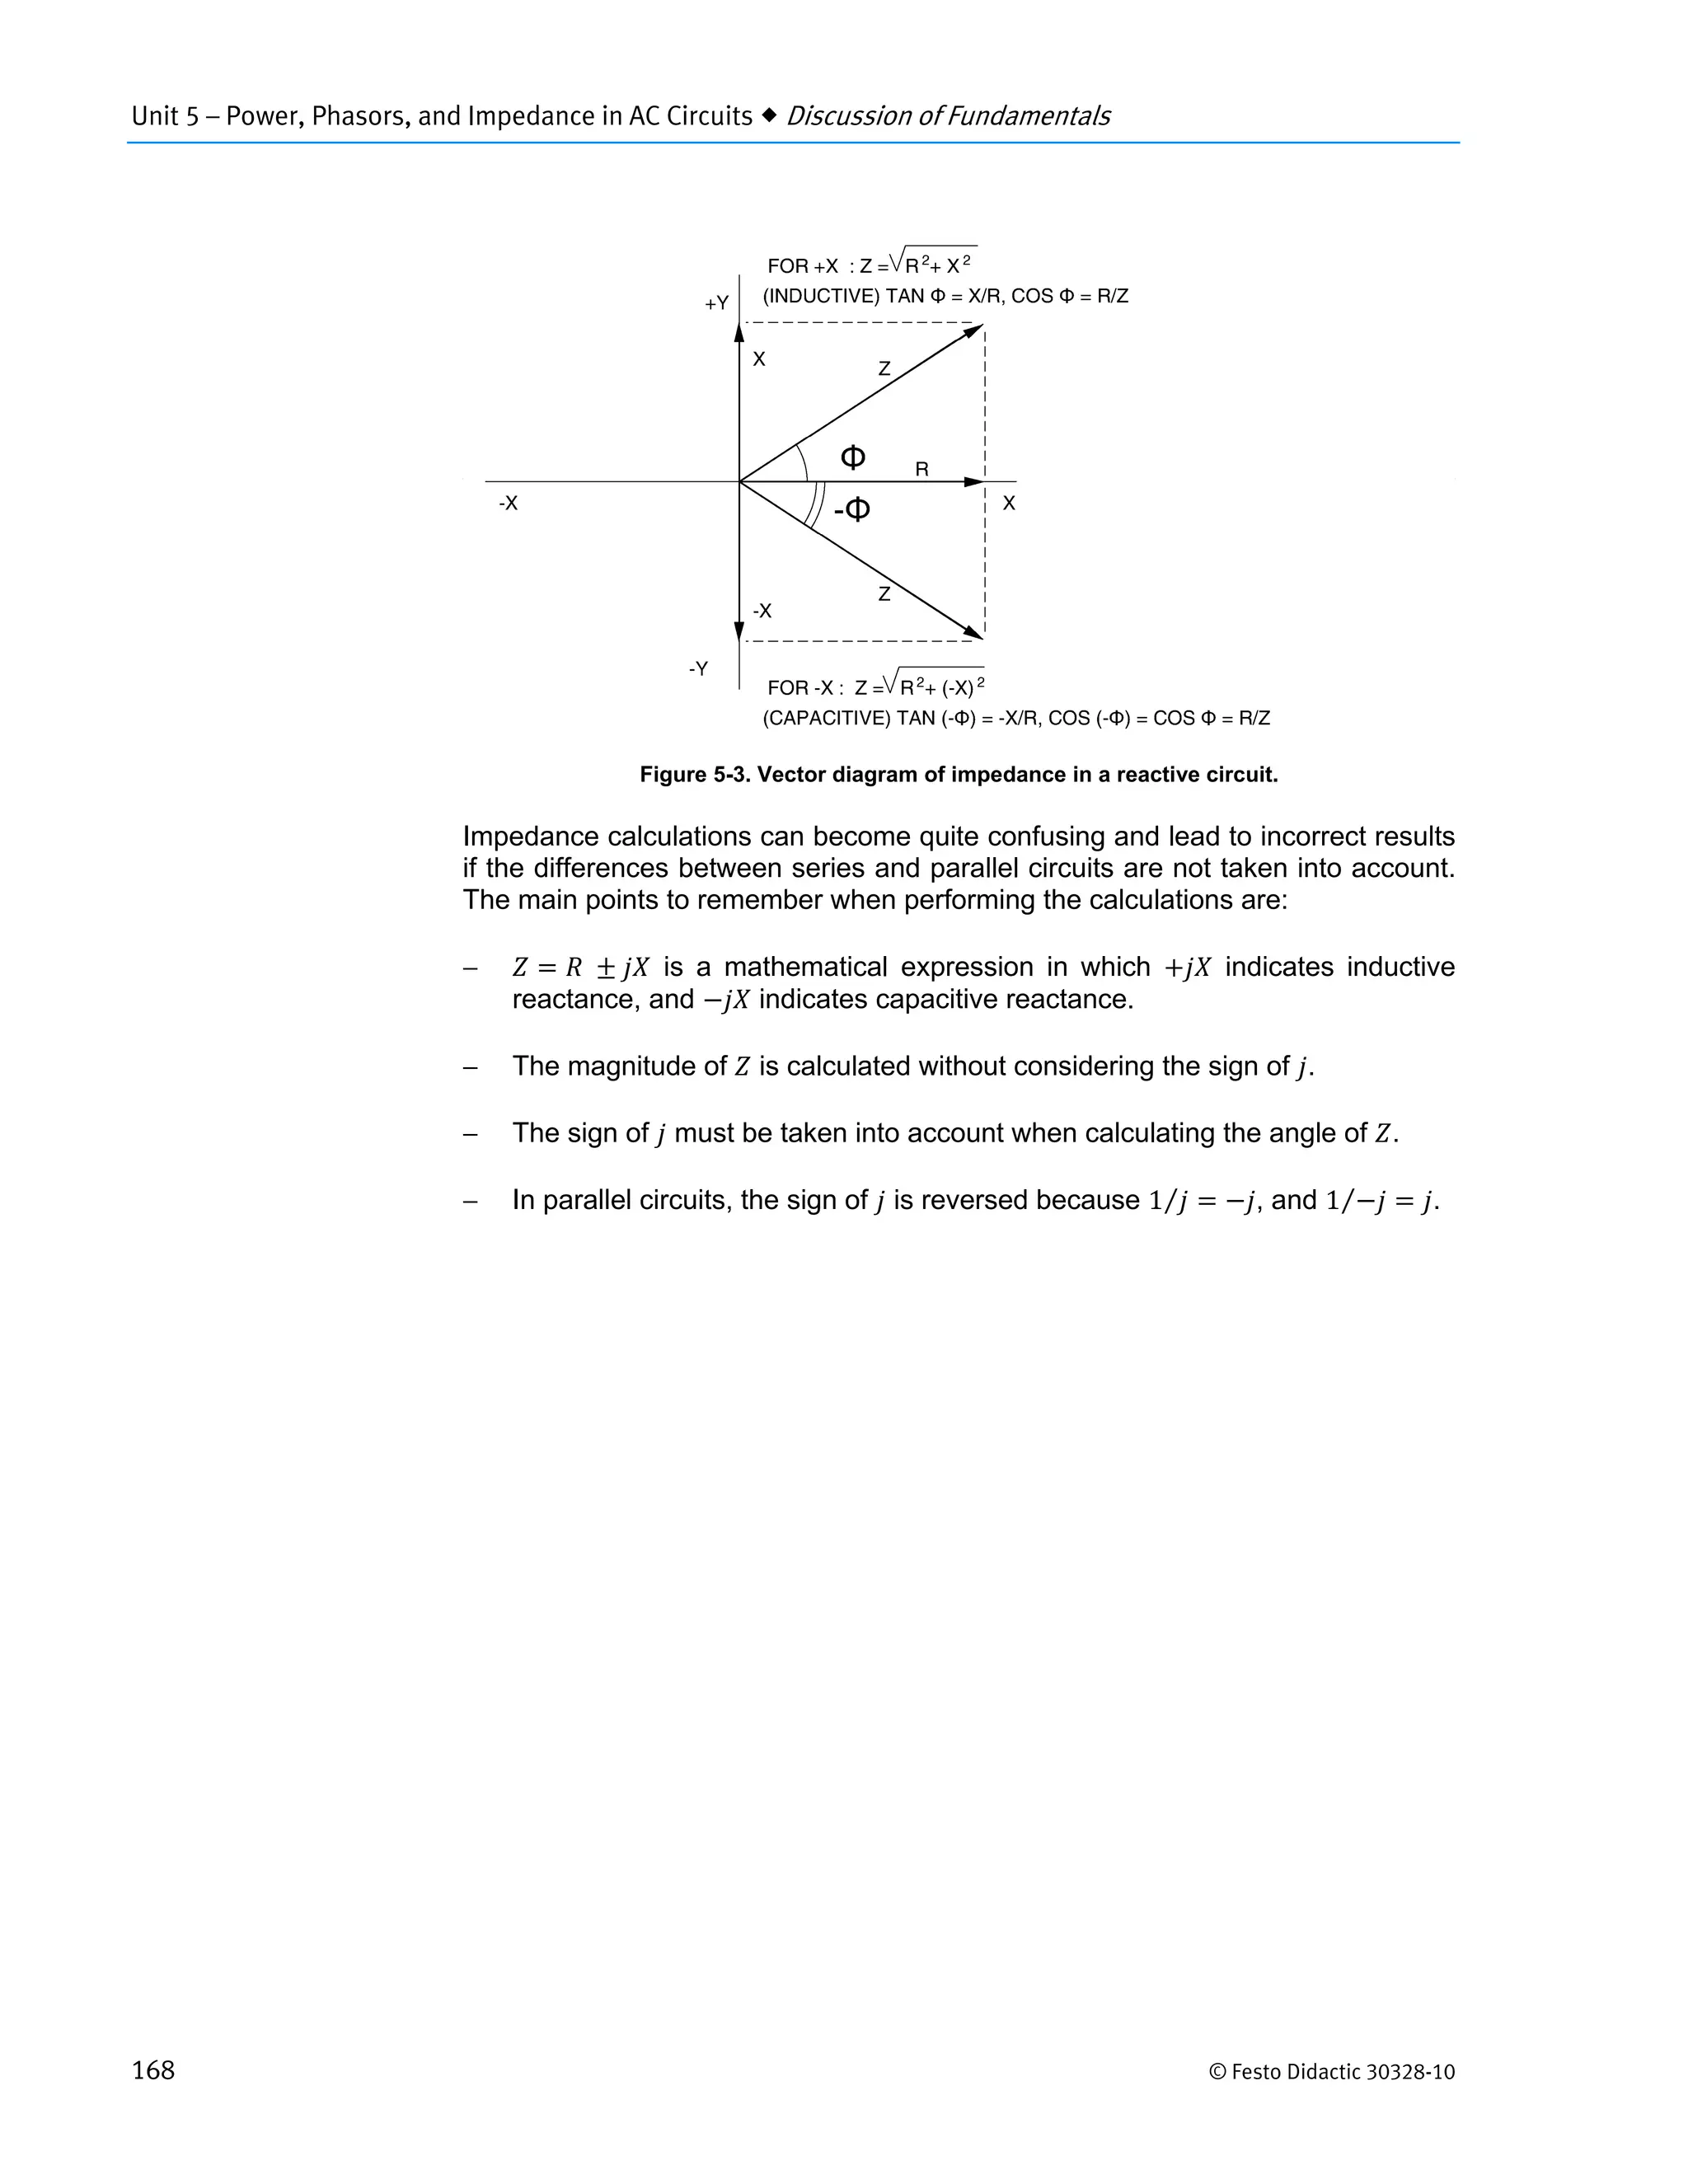
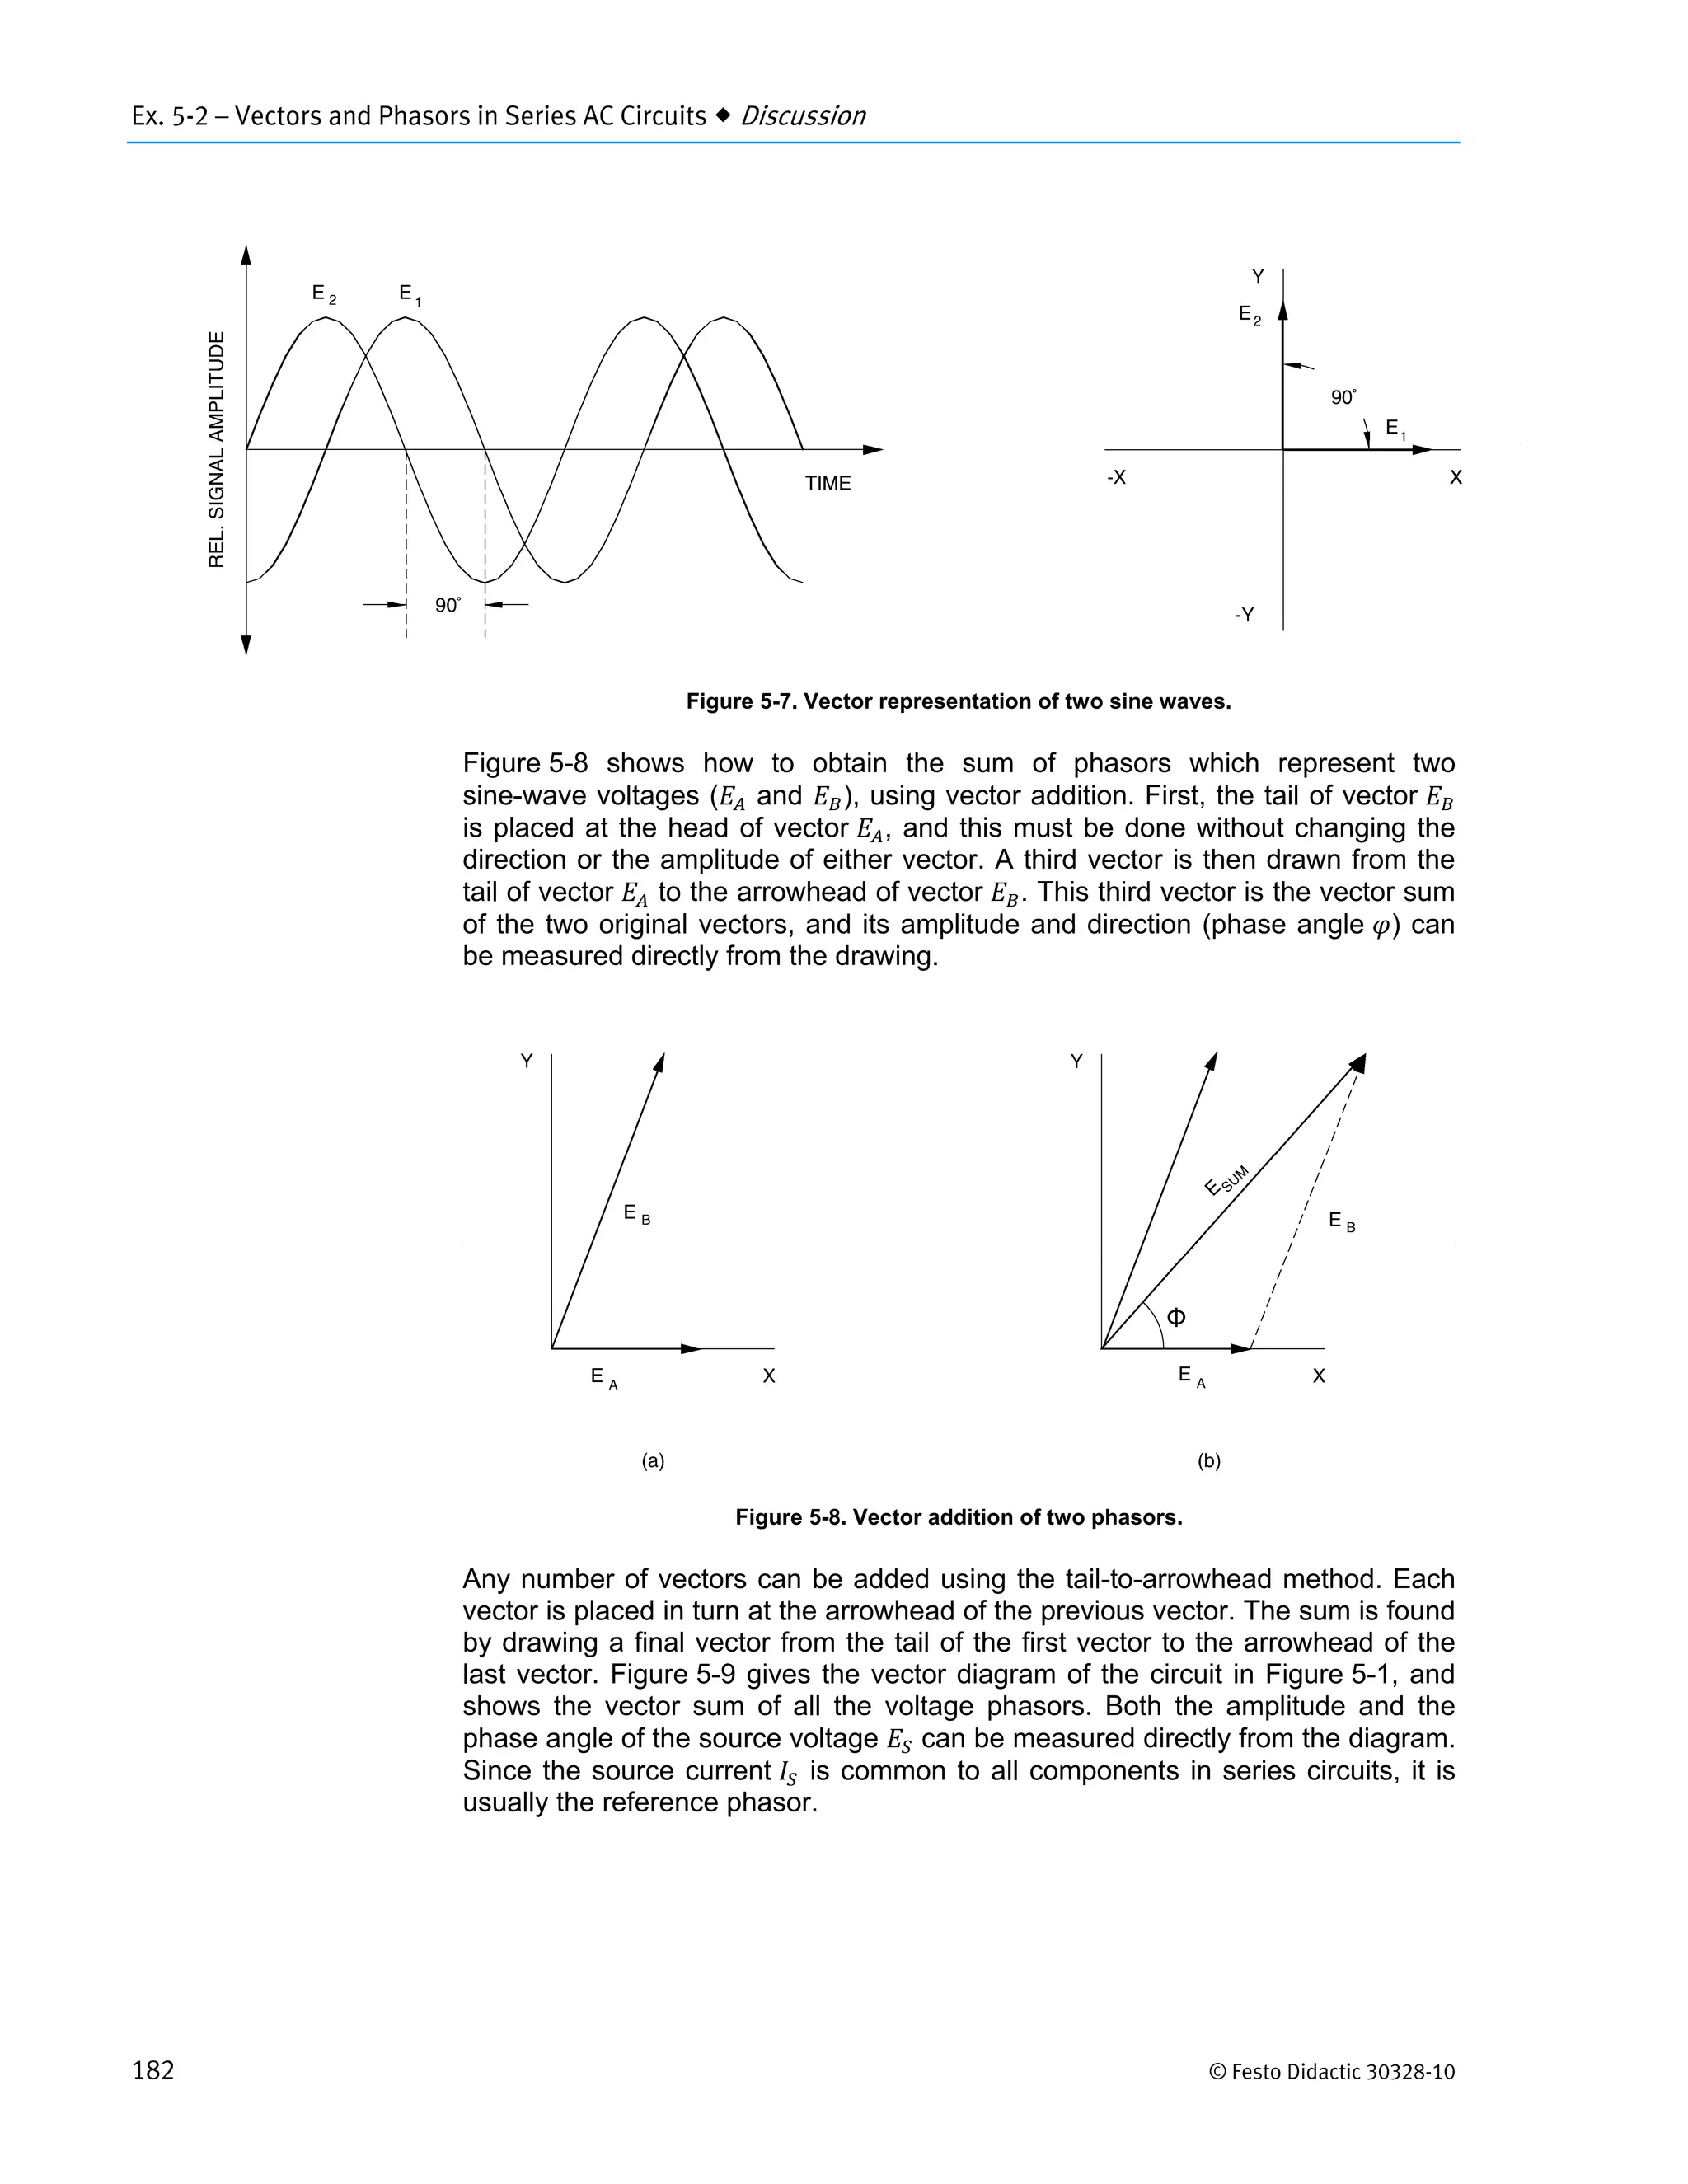
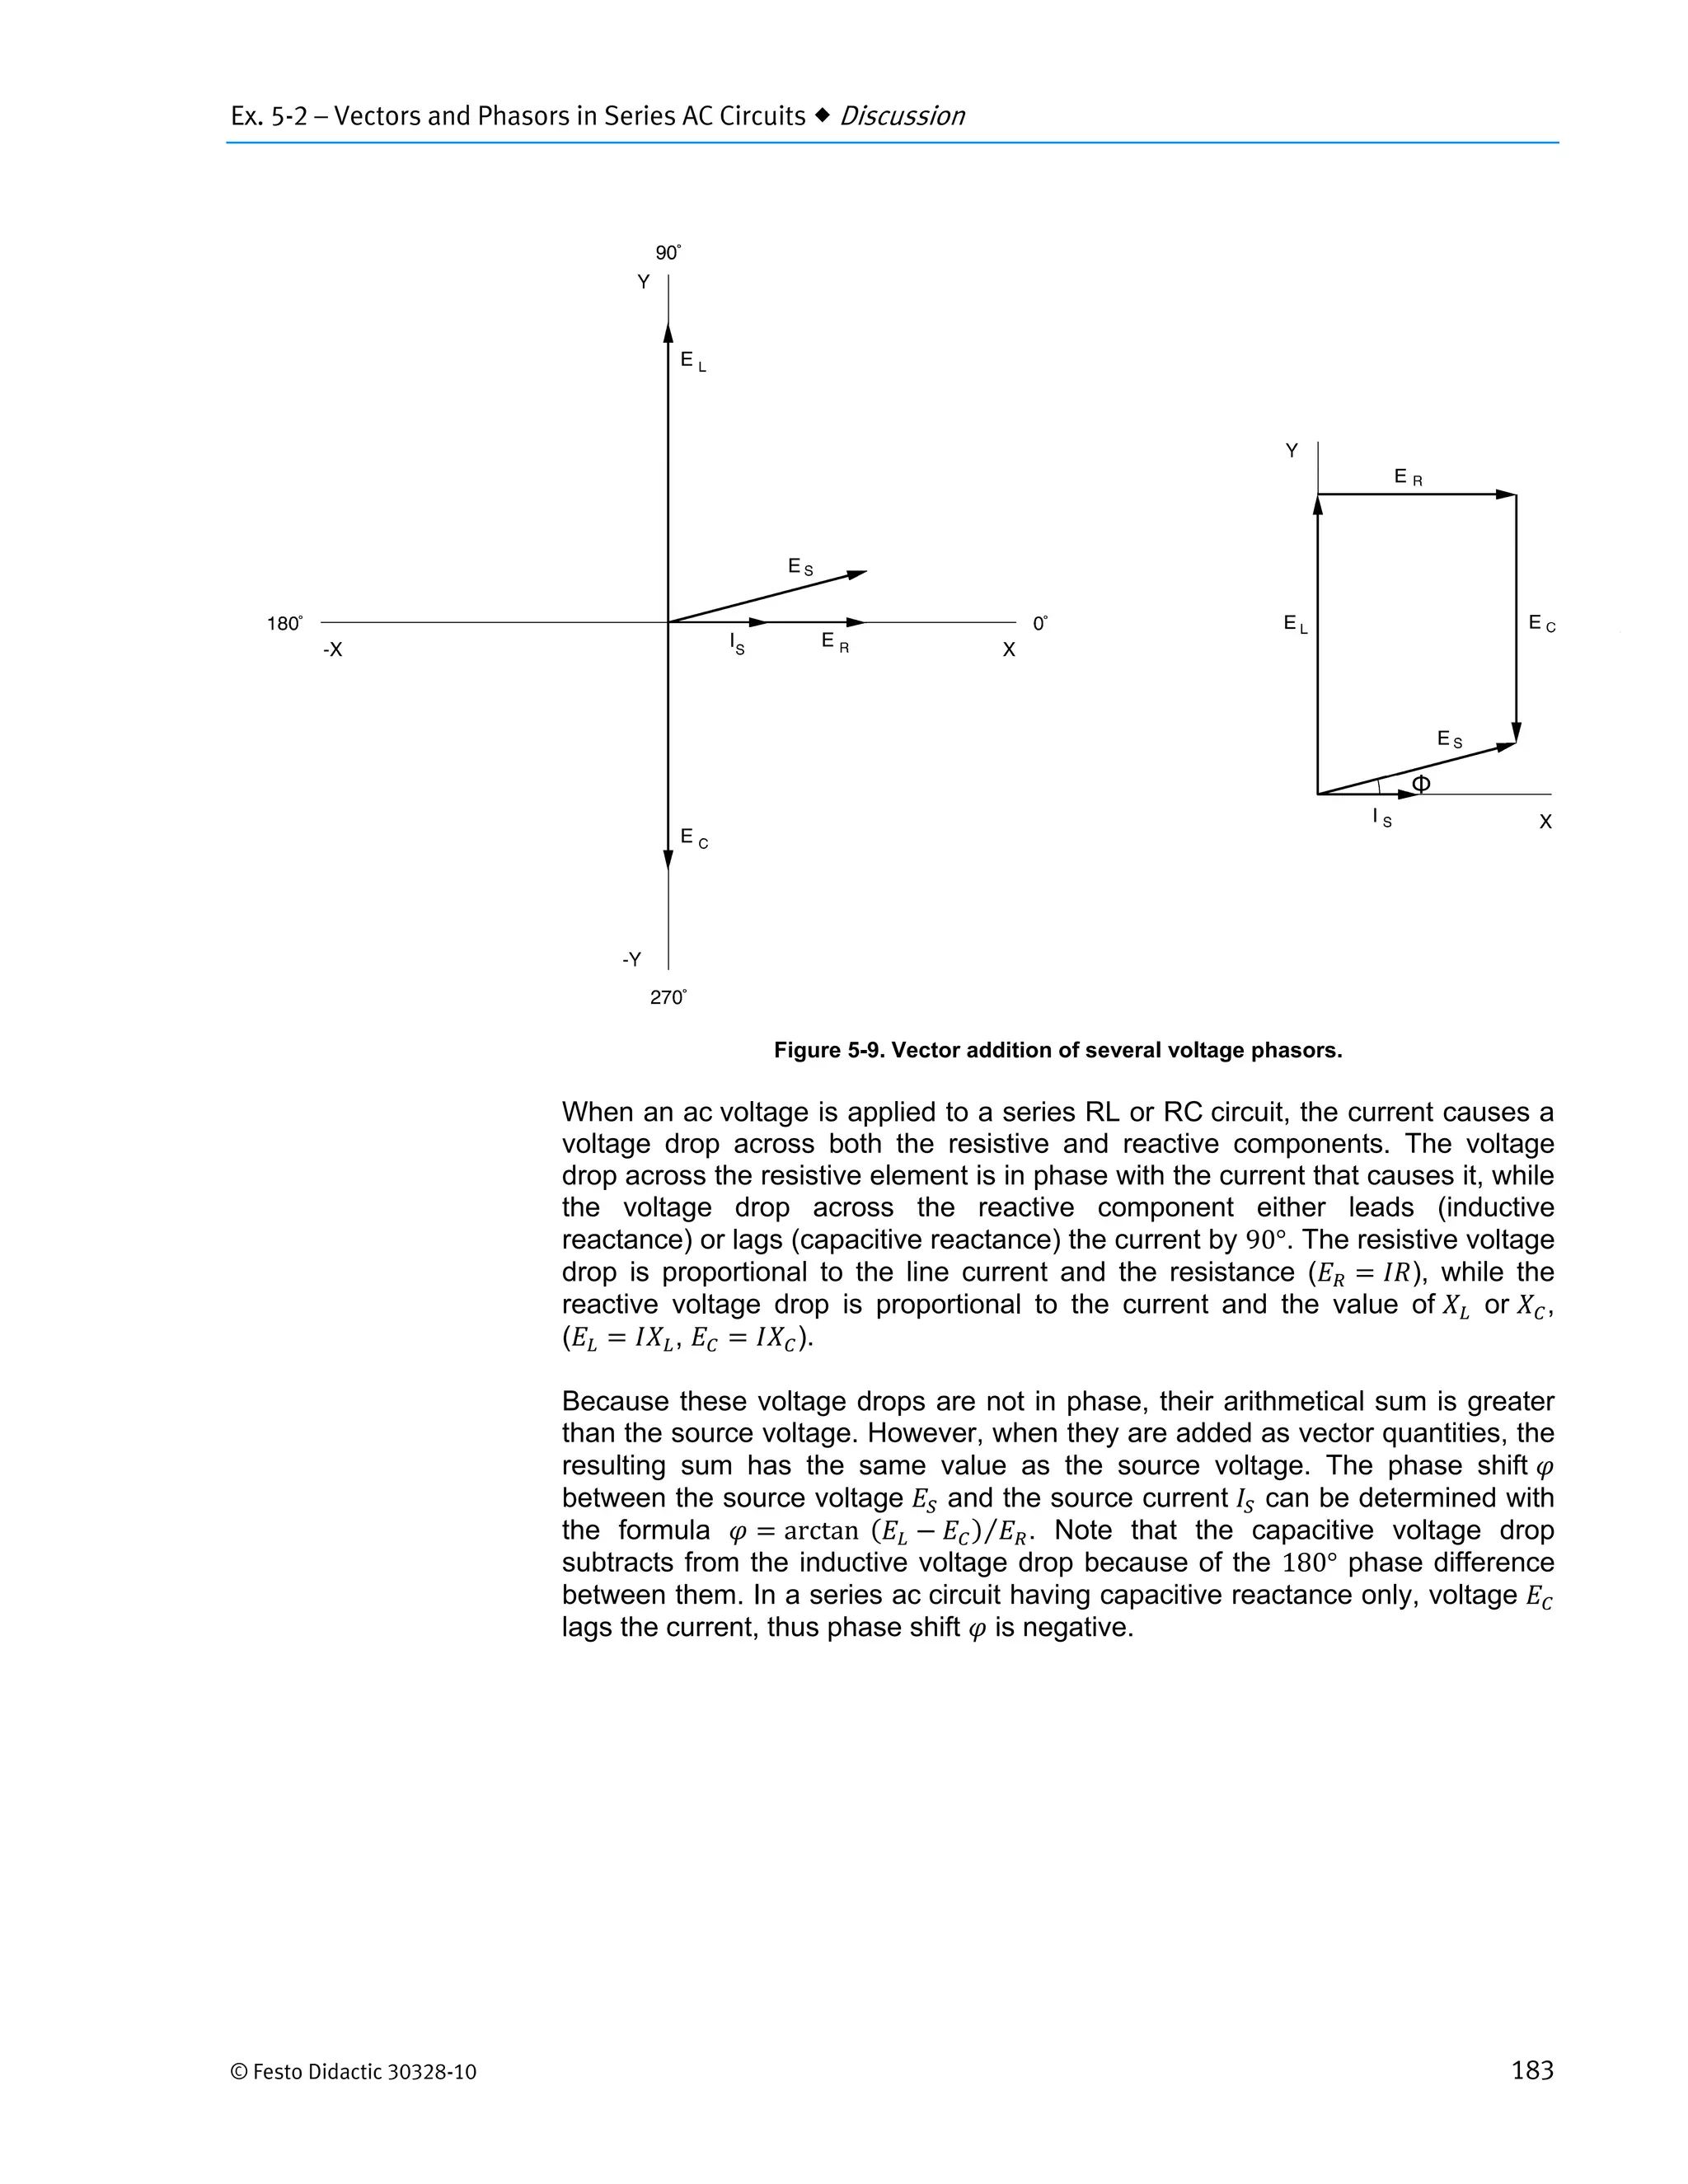
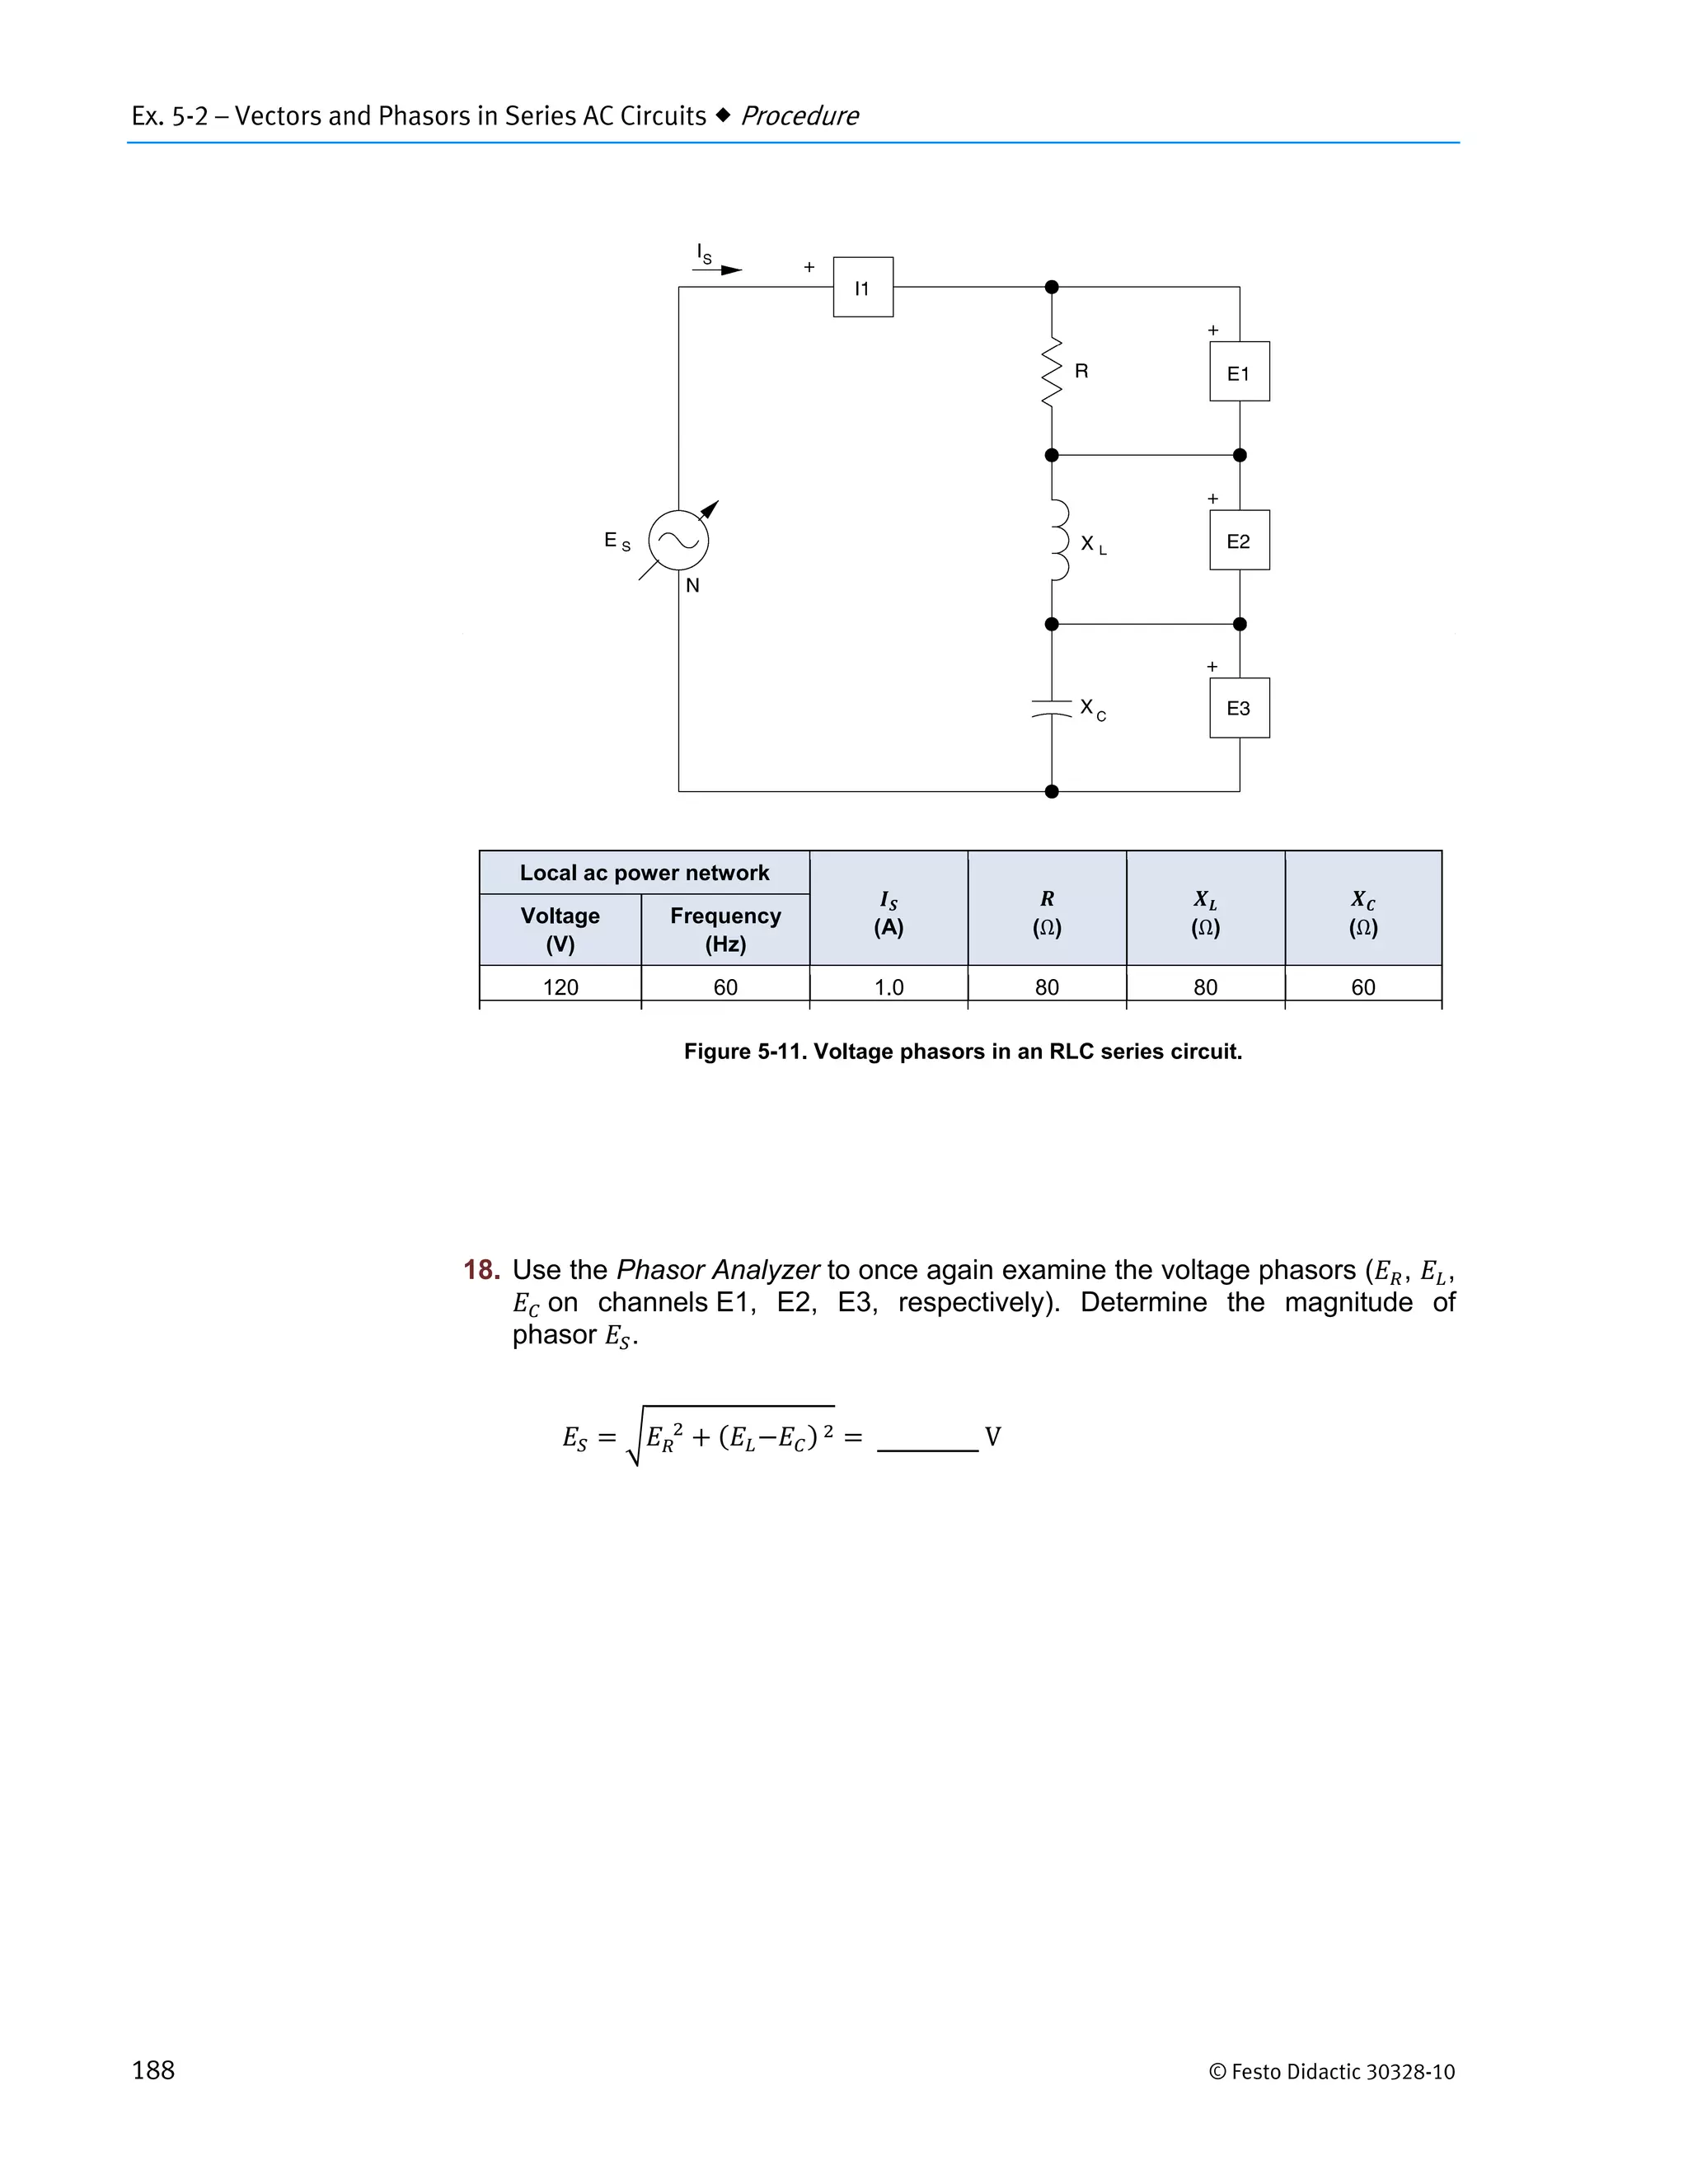
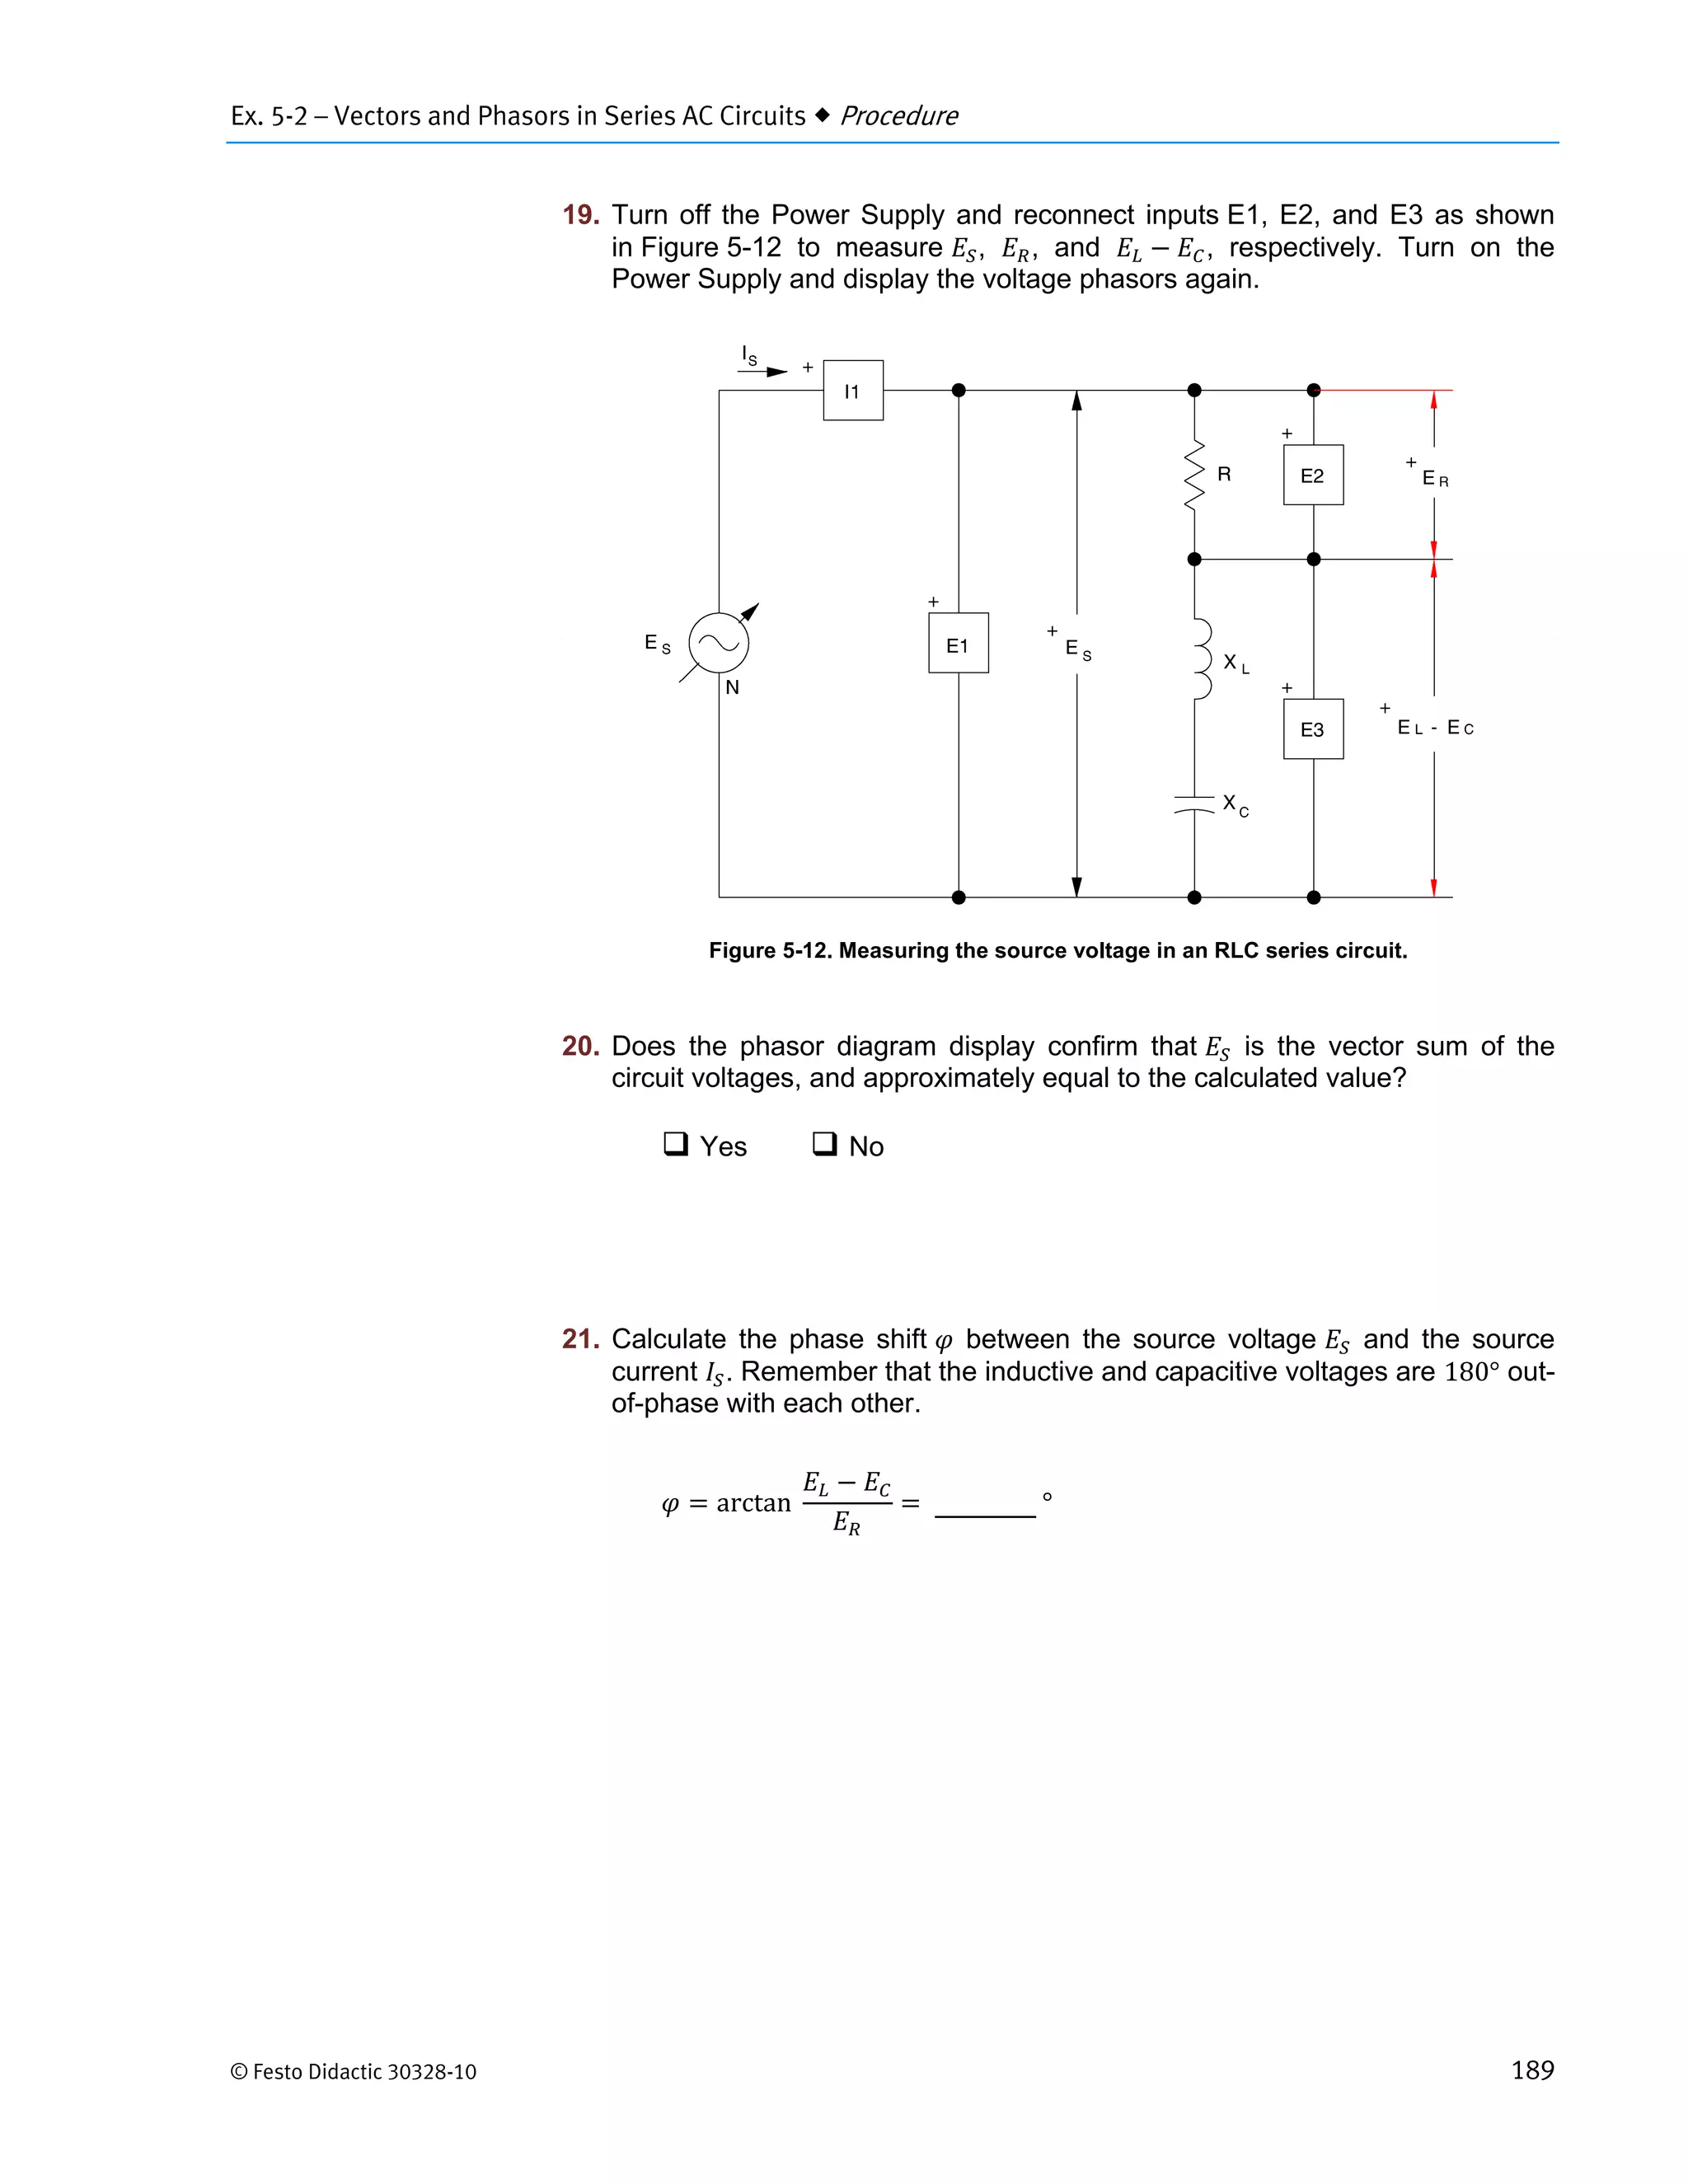
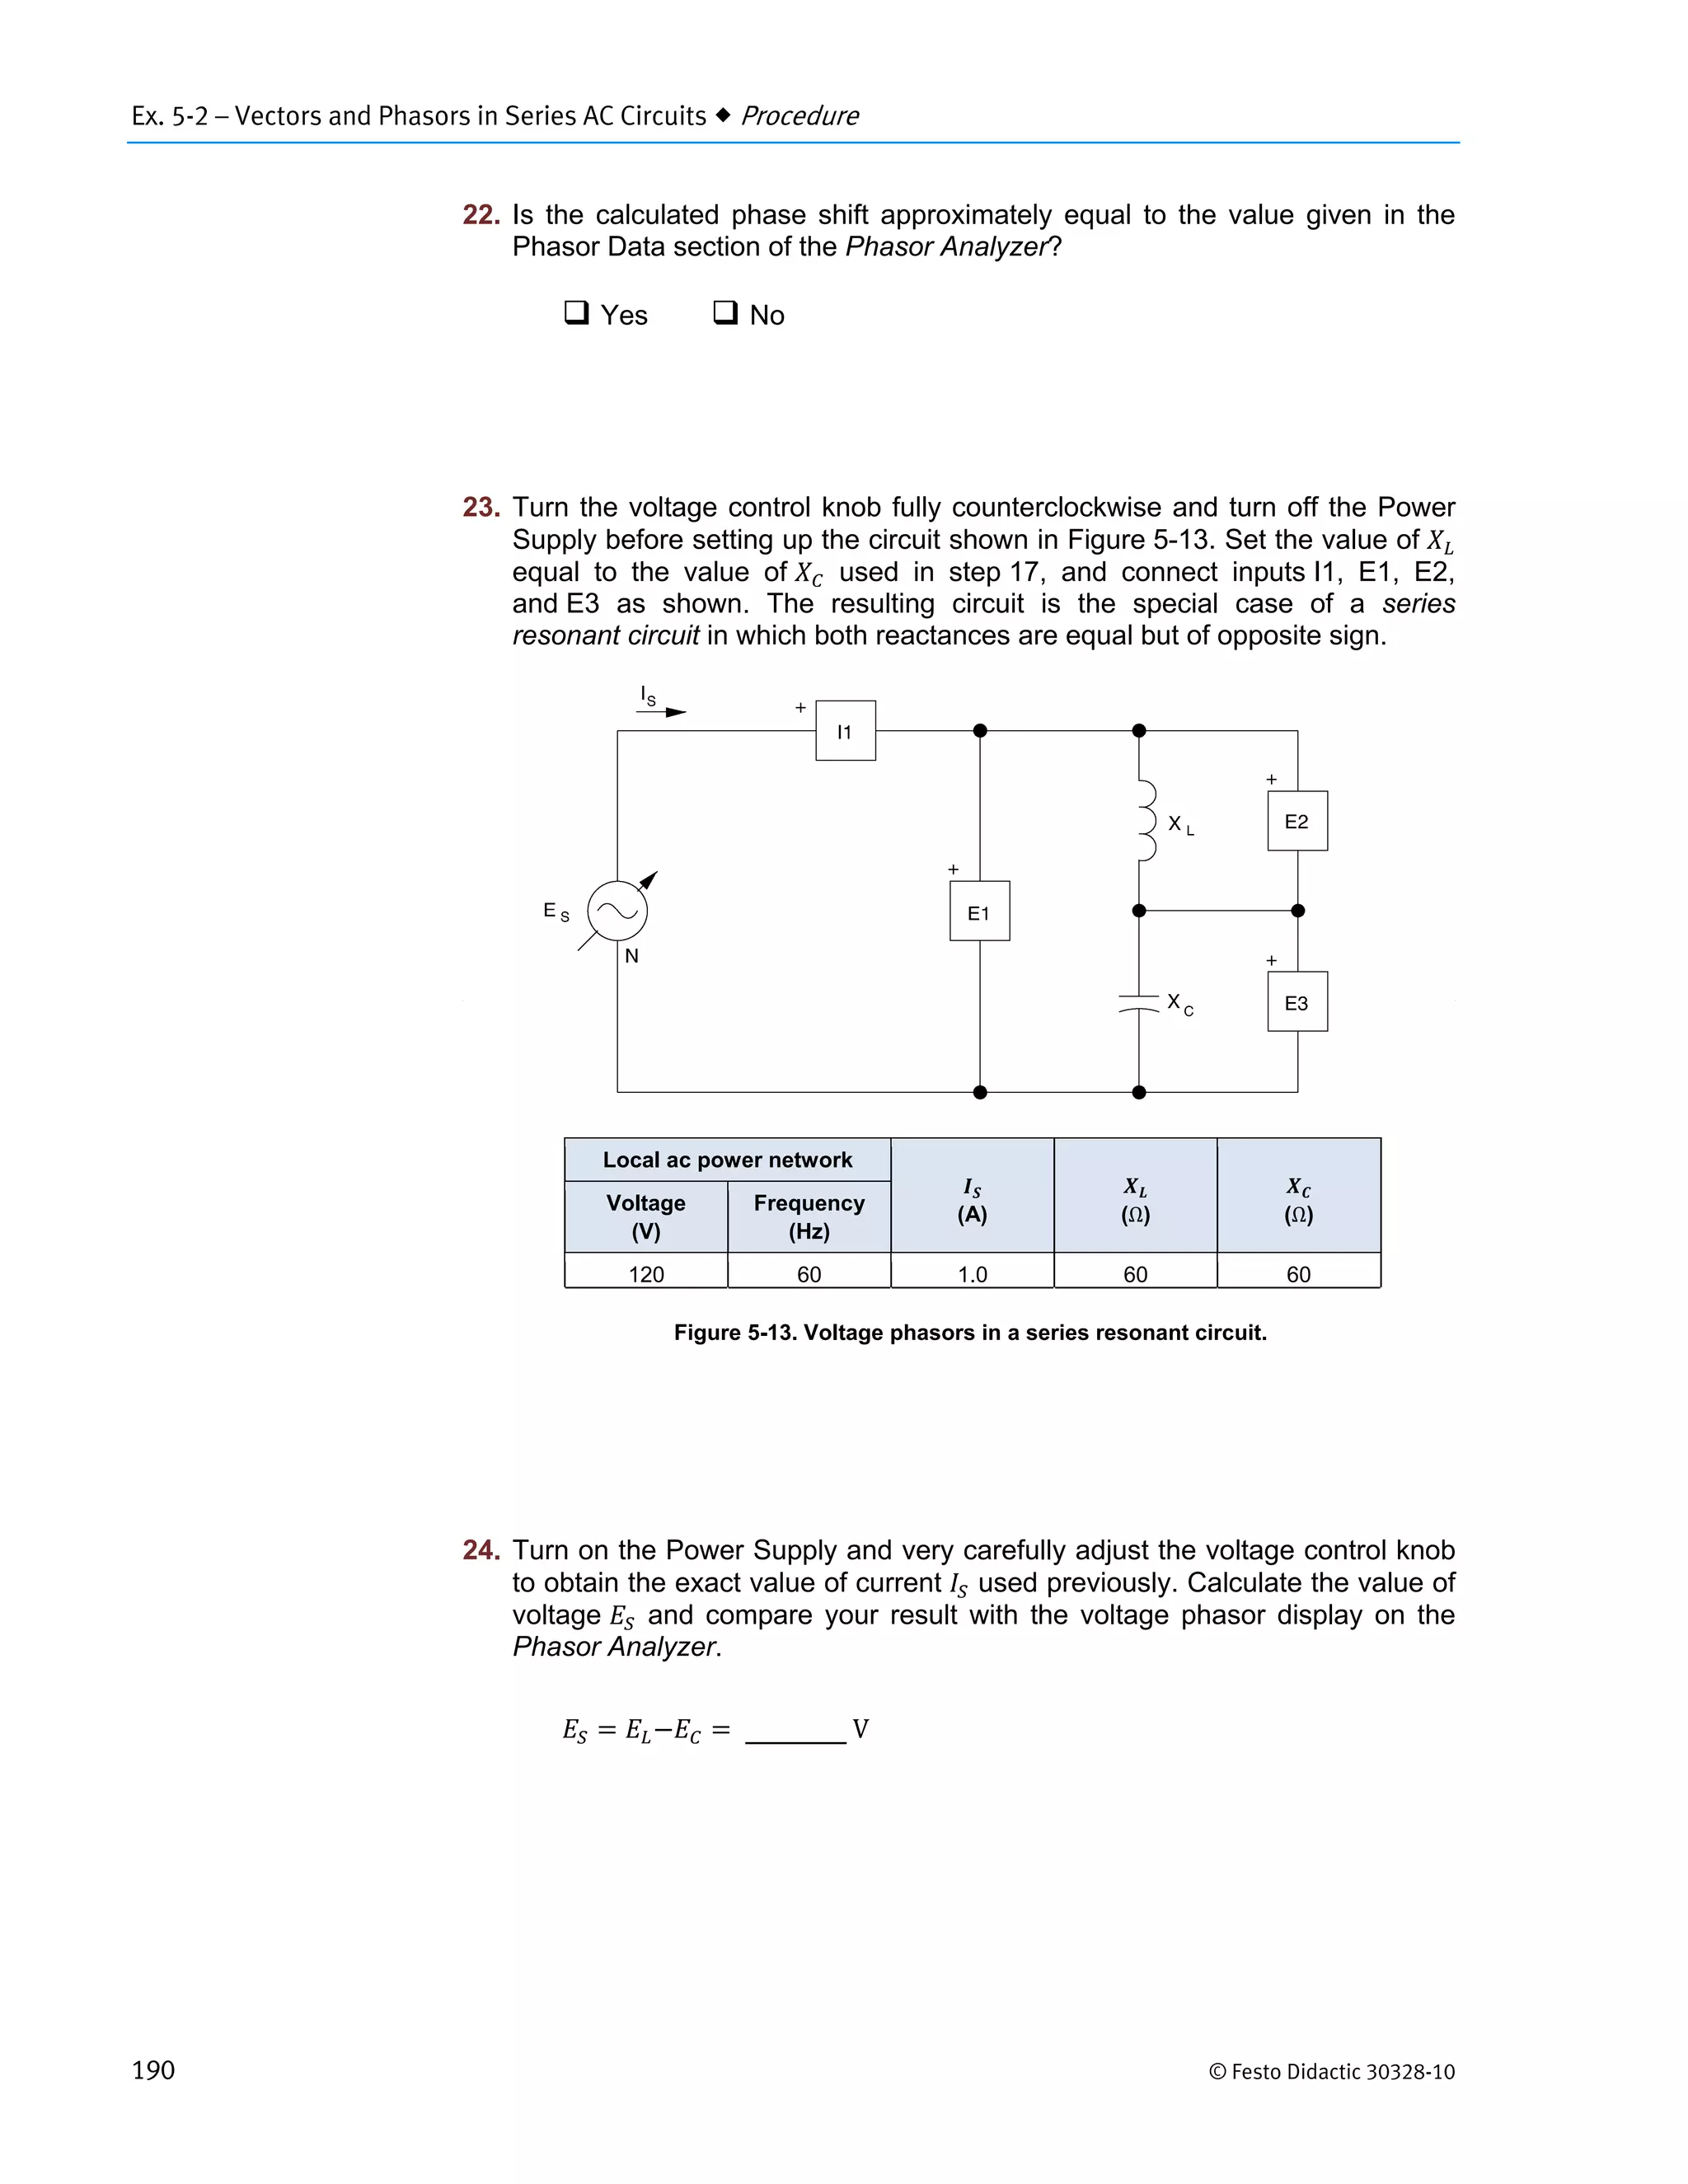
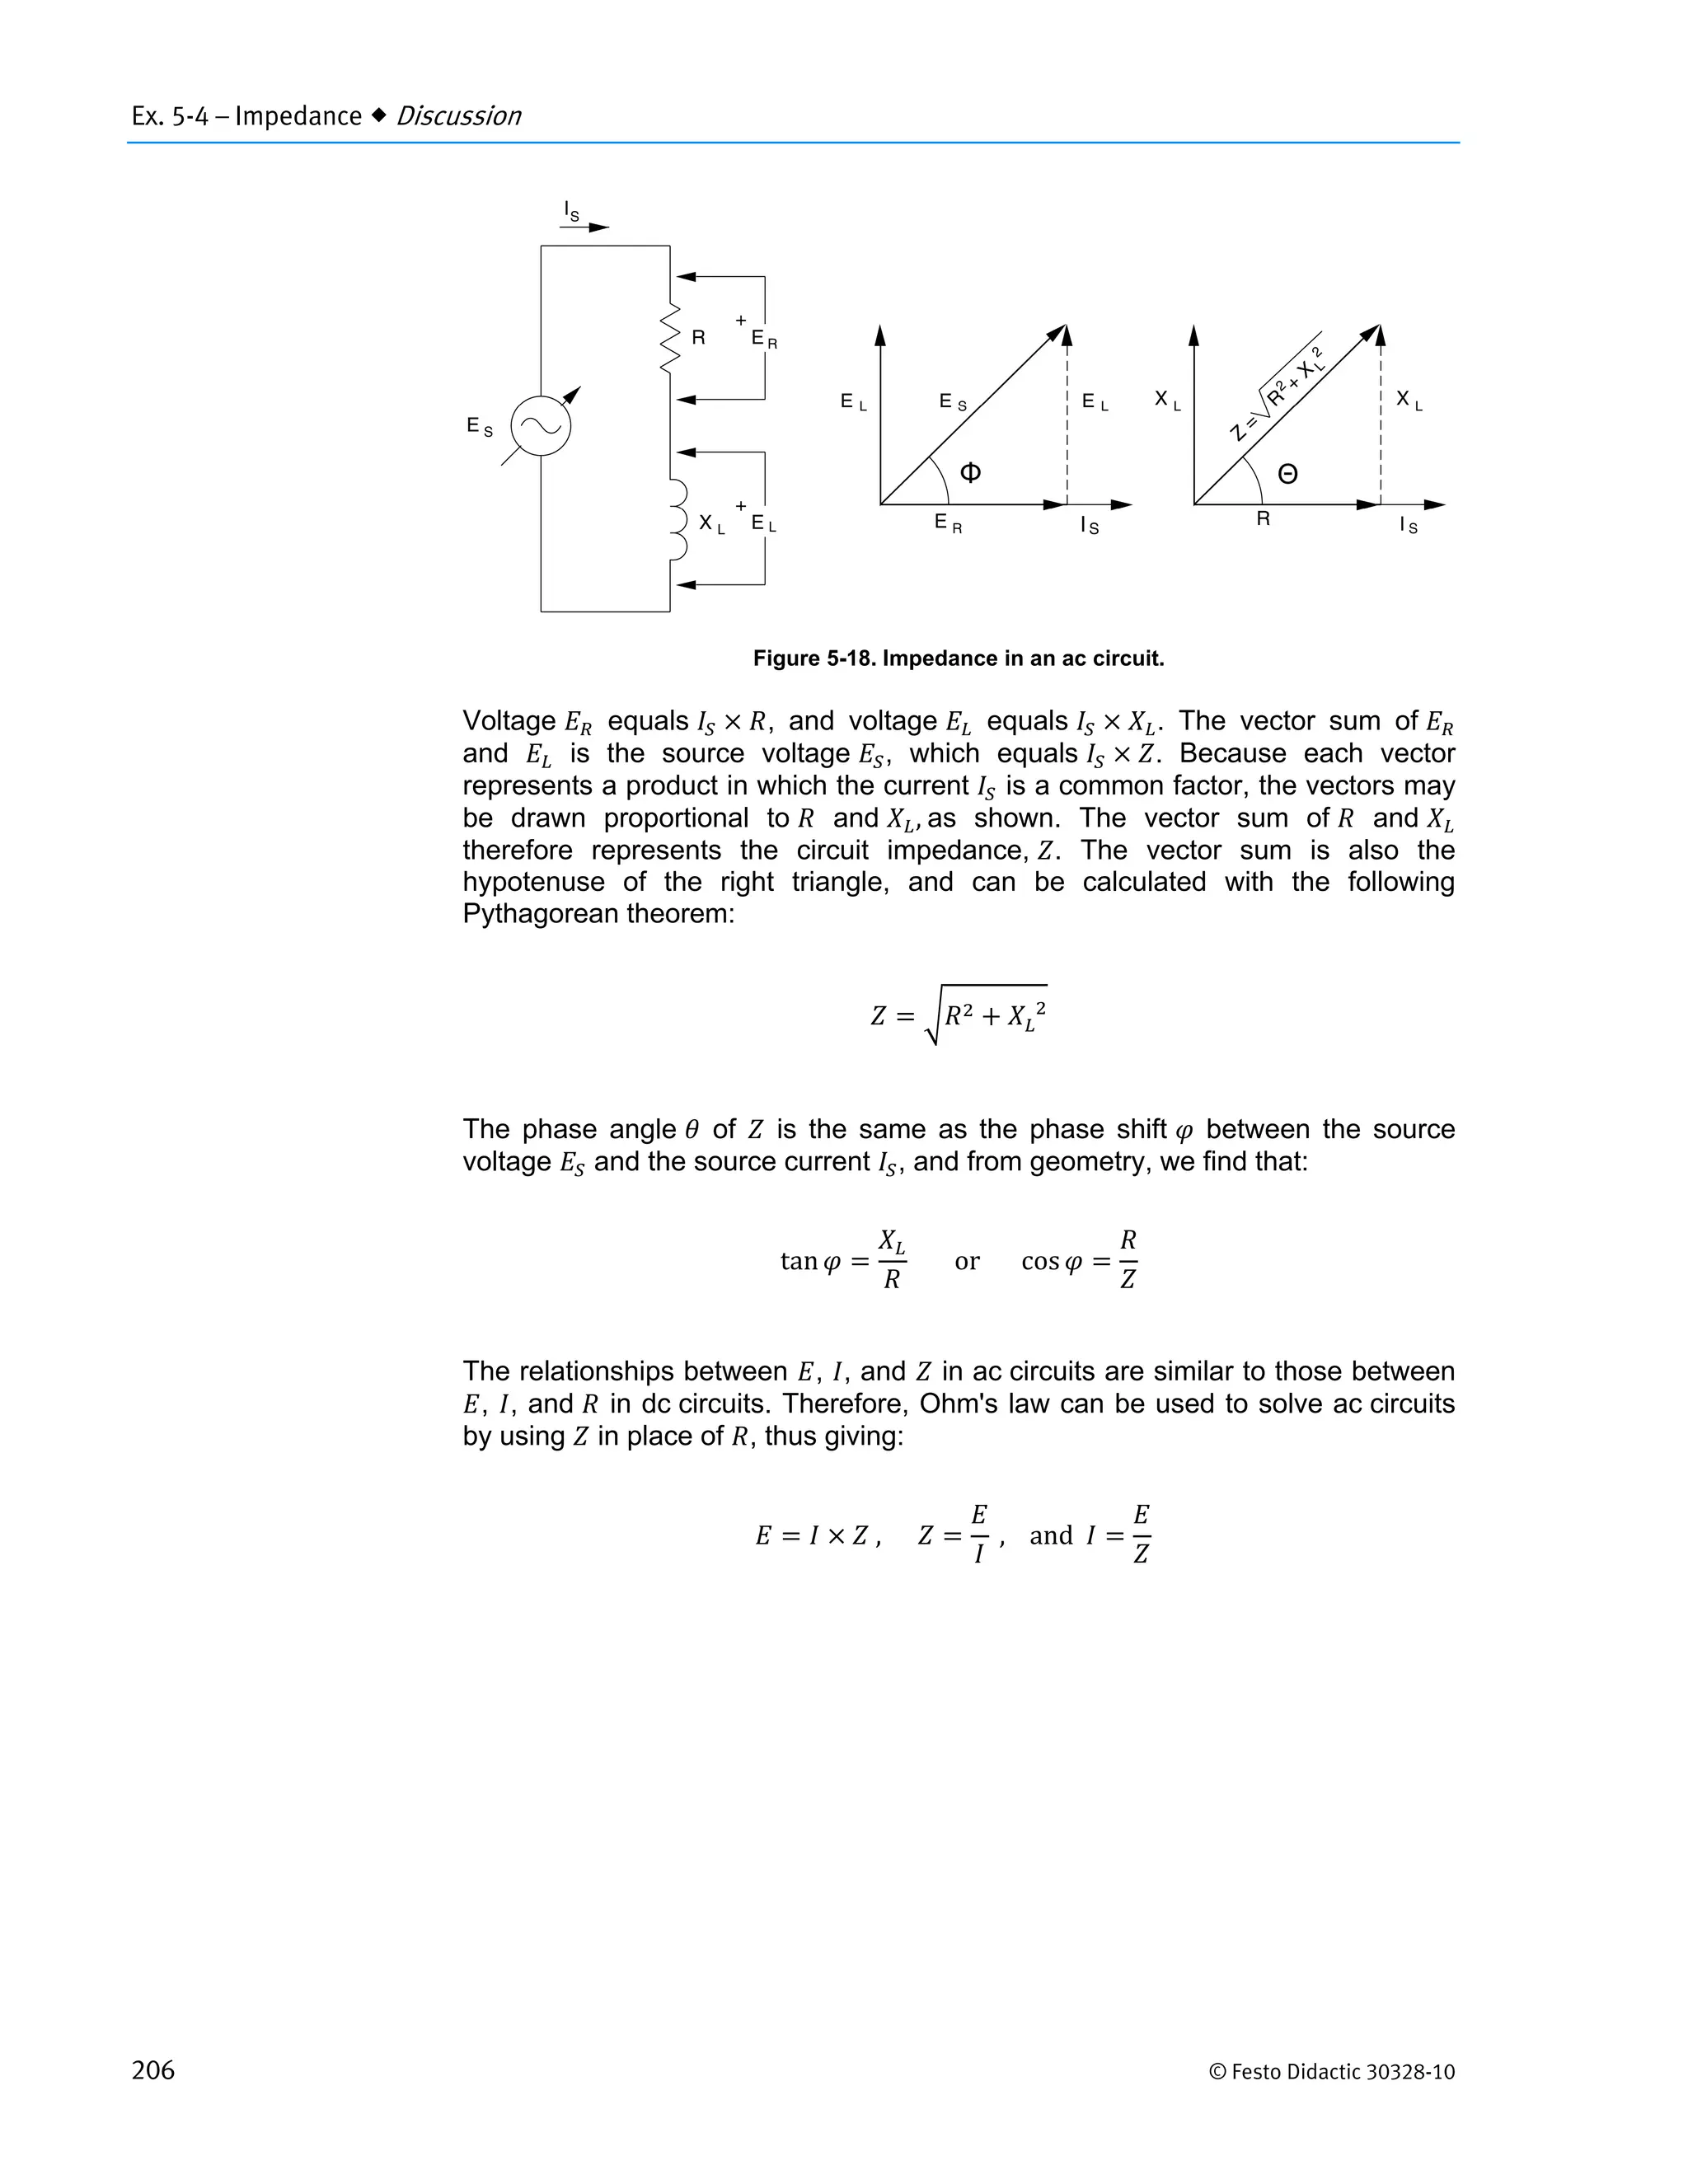
Analysis of vector representation and phasor addition for series AC circuits, emphasizing voltage drops and phase relationships.
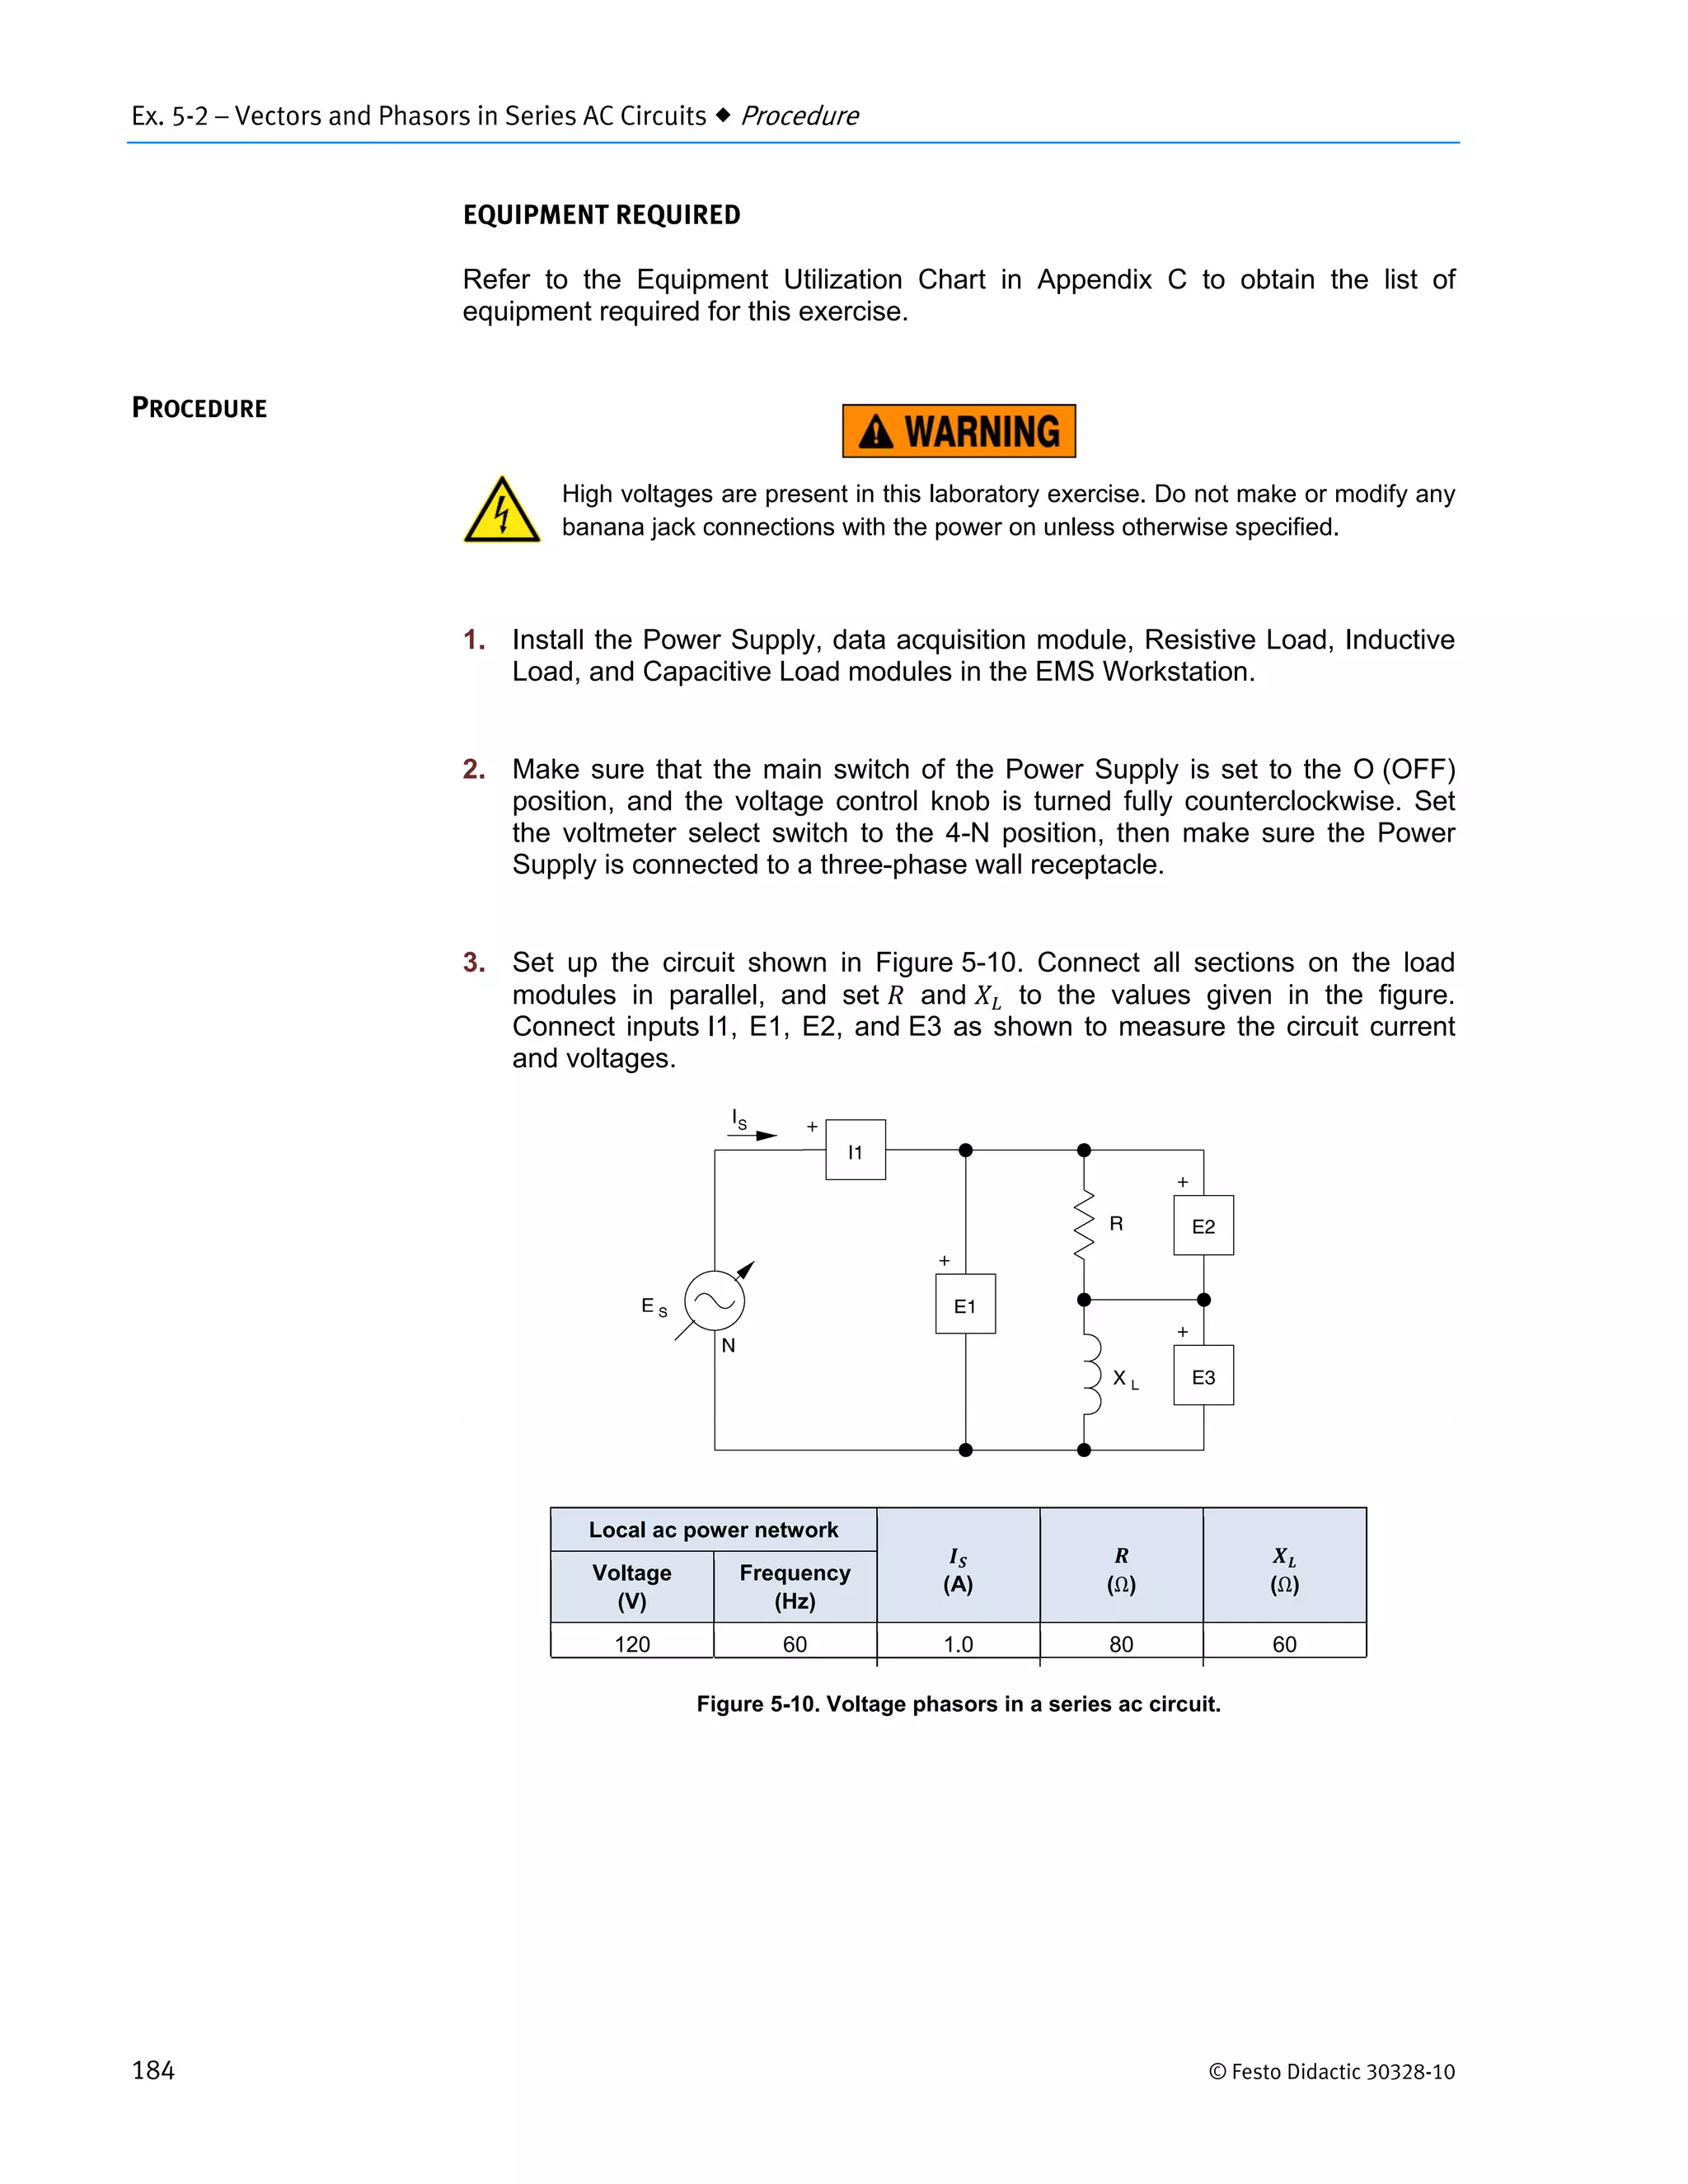
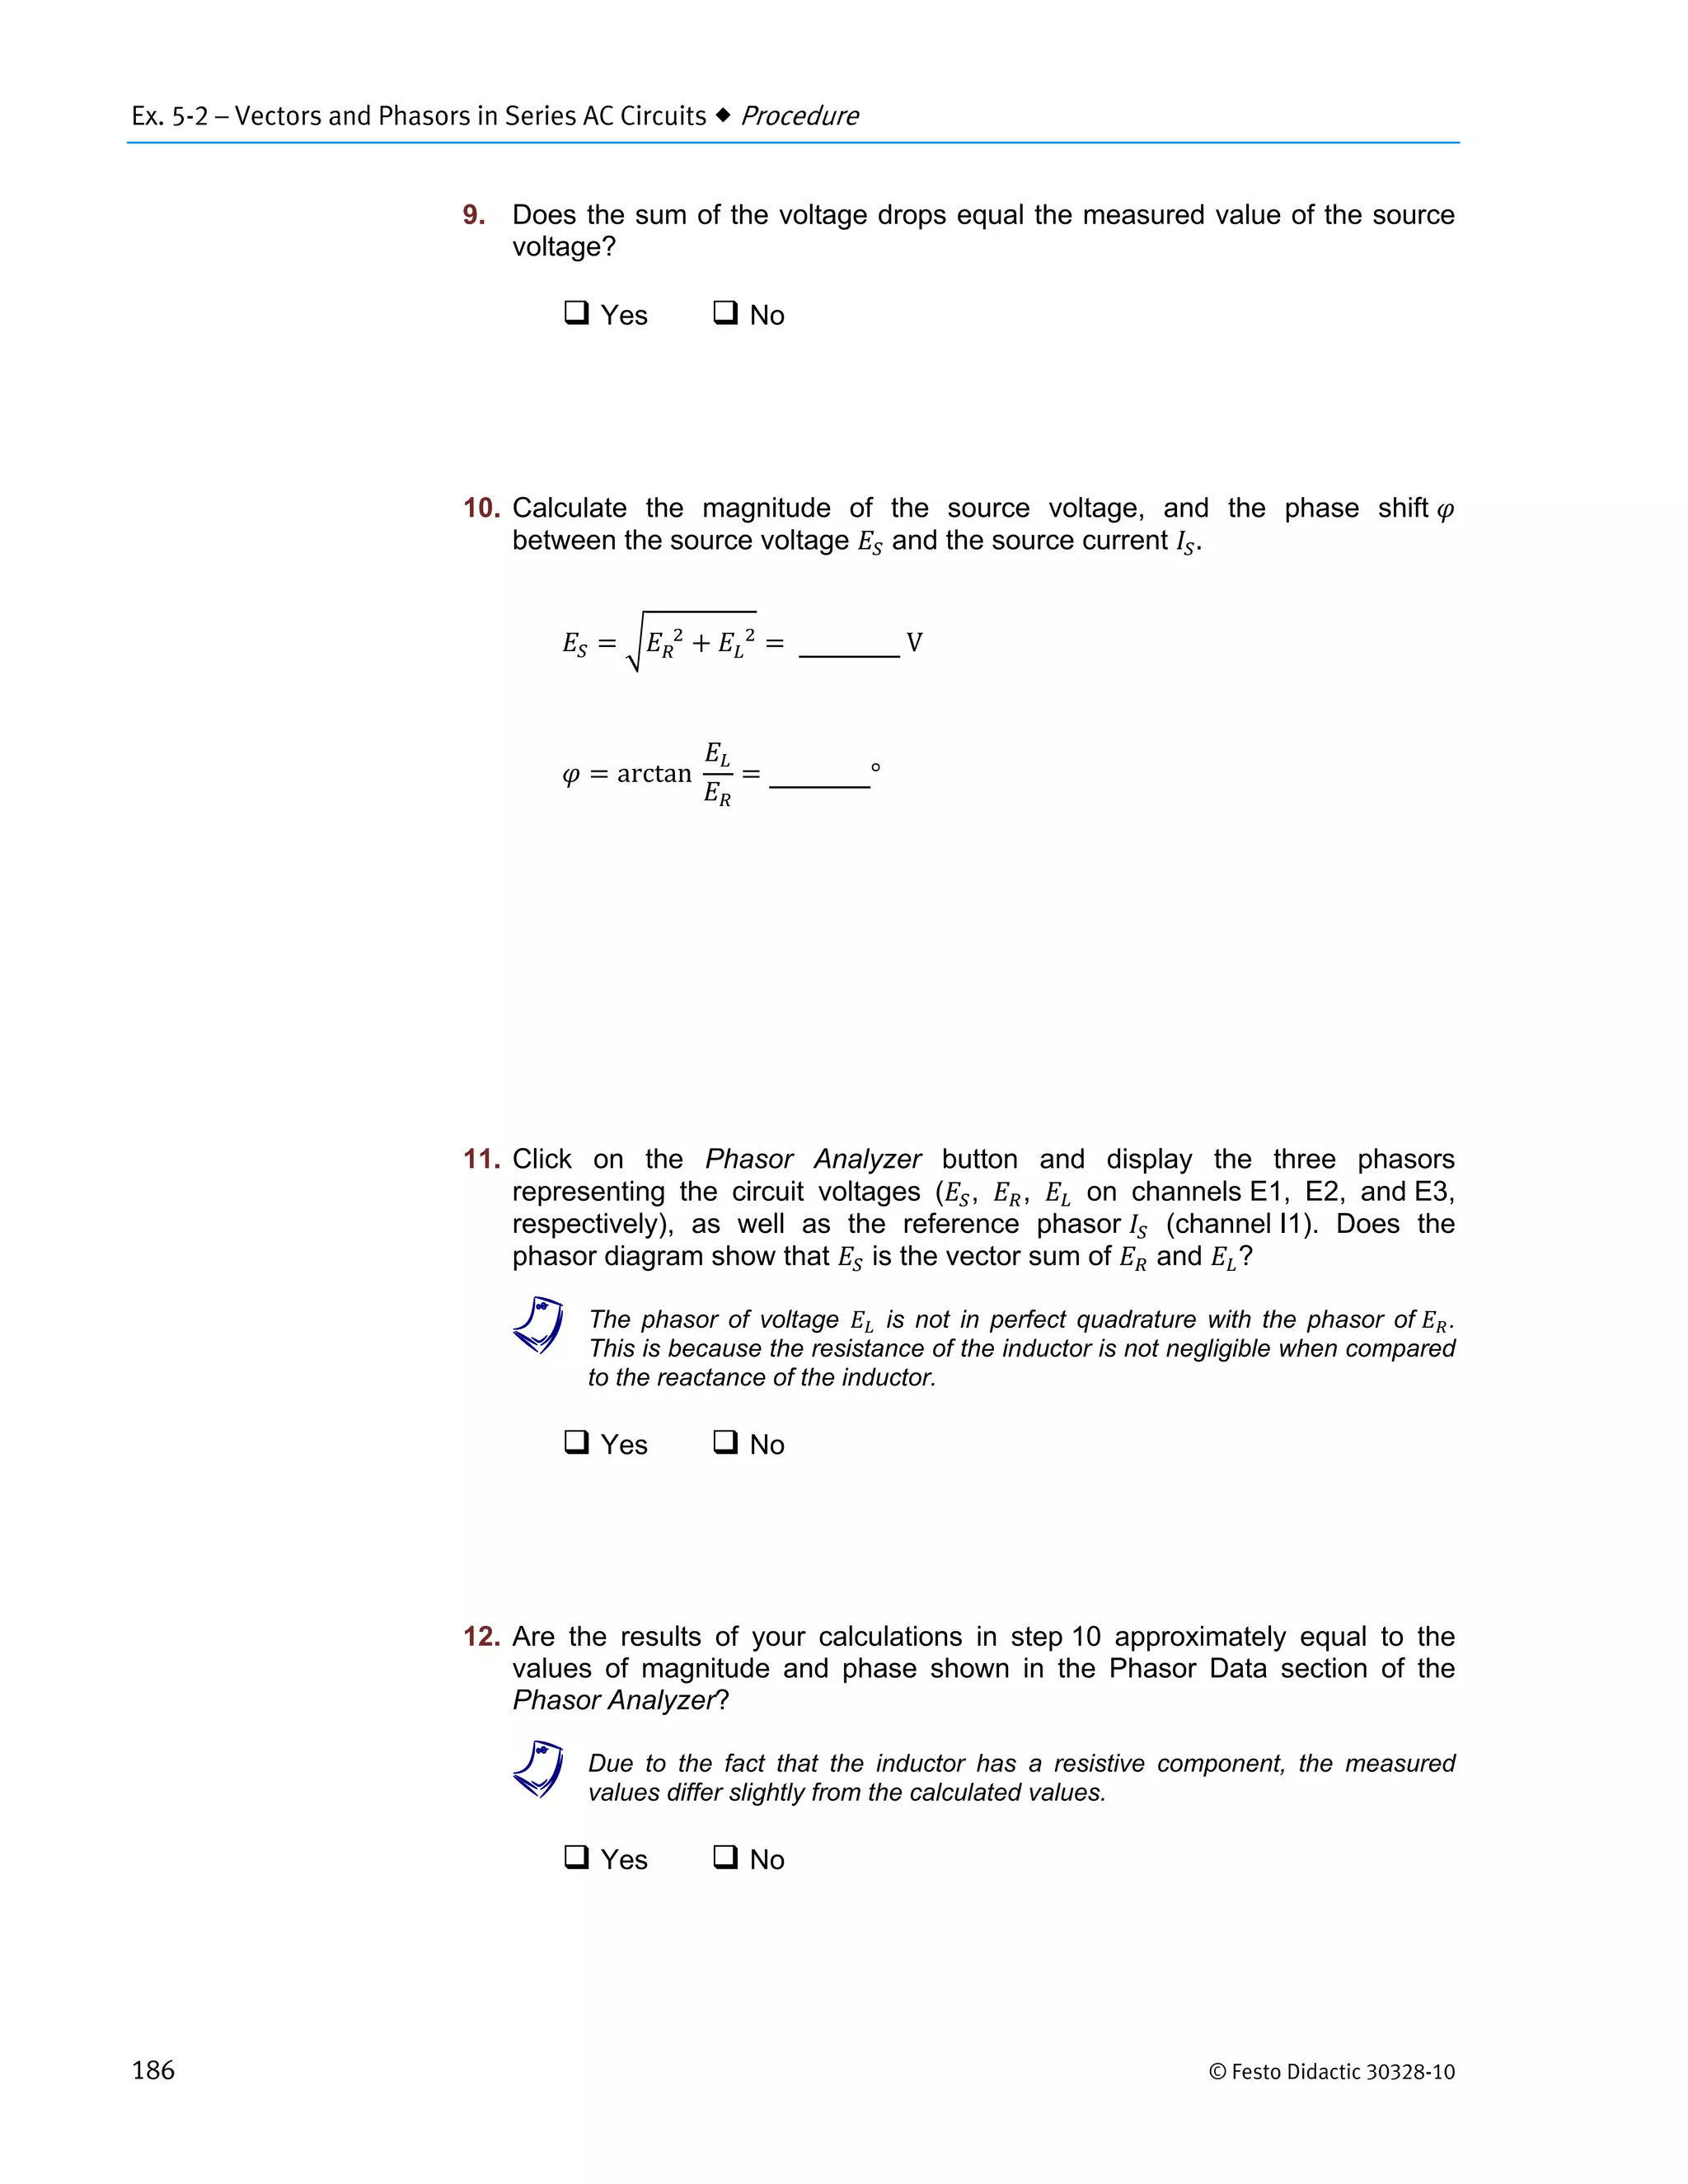
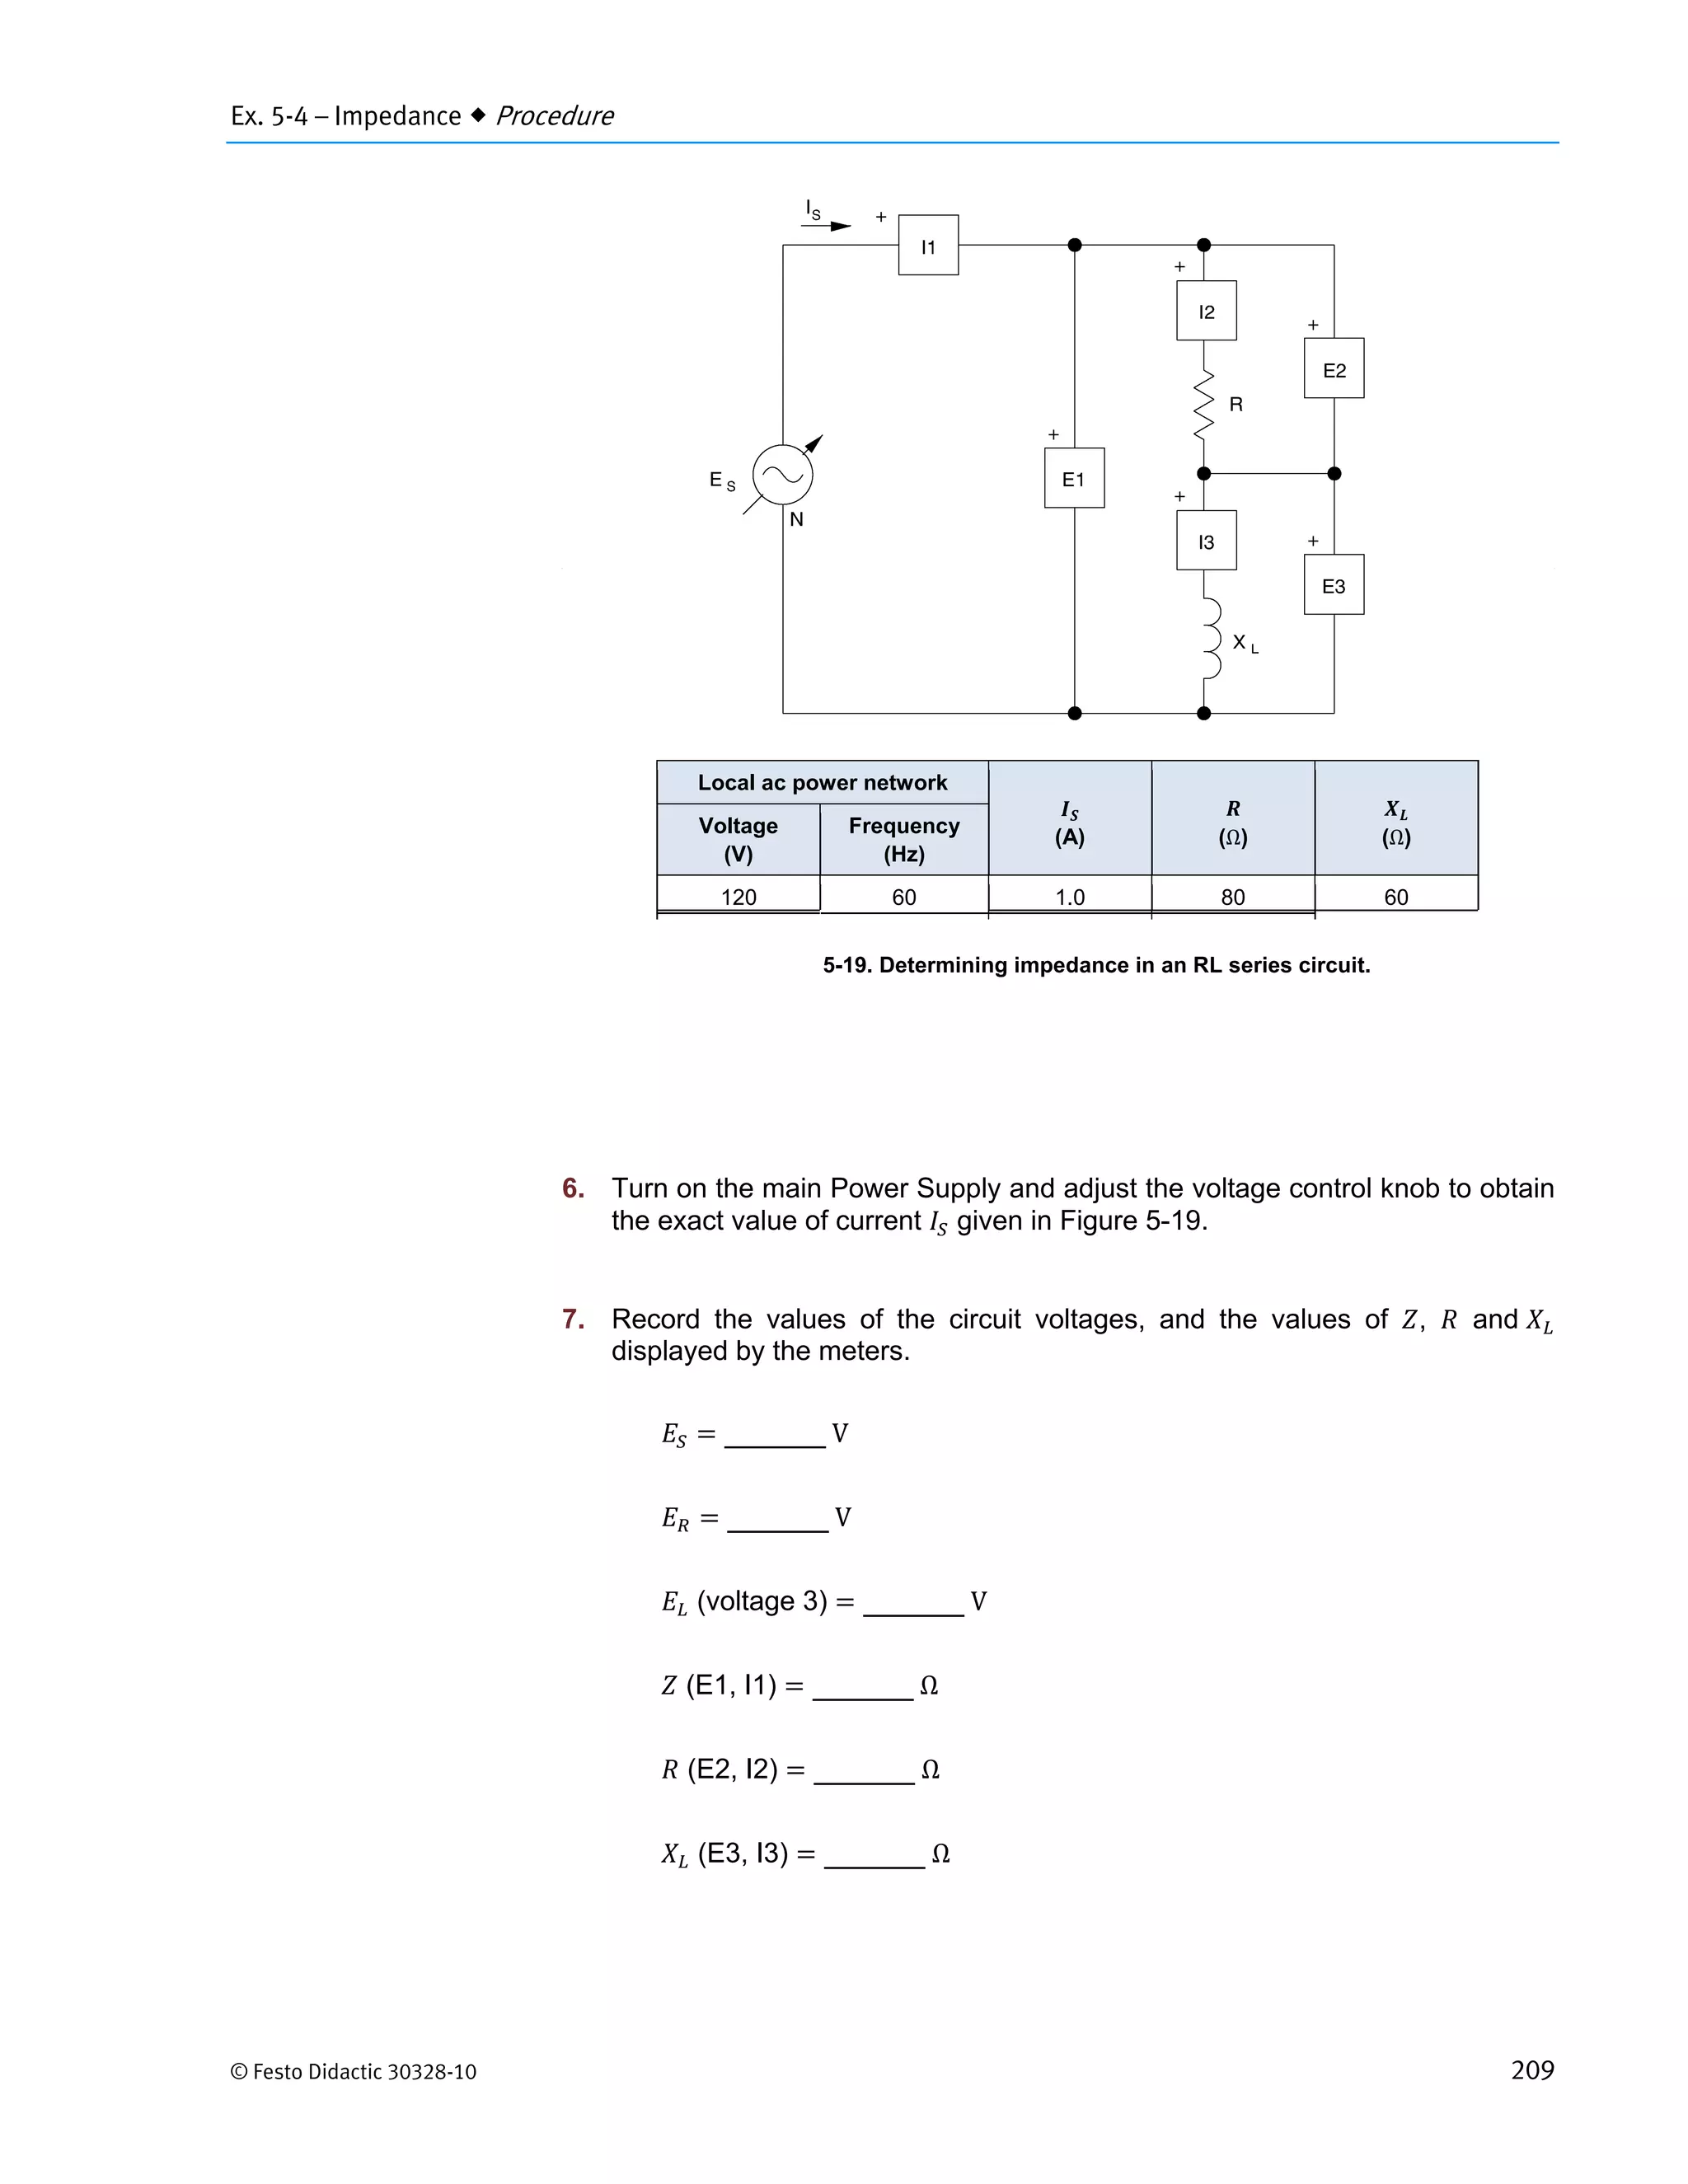
Exercise procedure for determining voltages in series AC circuits using phasors, and calculating impedance and phase shifts.
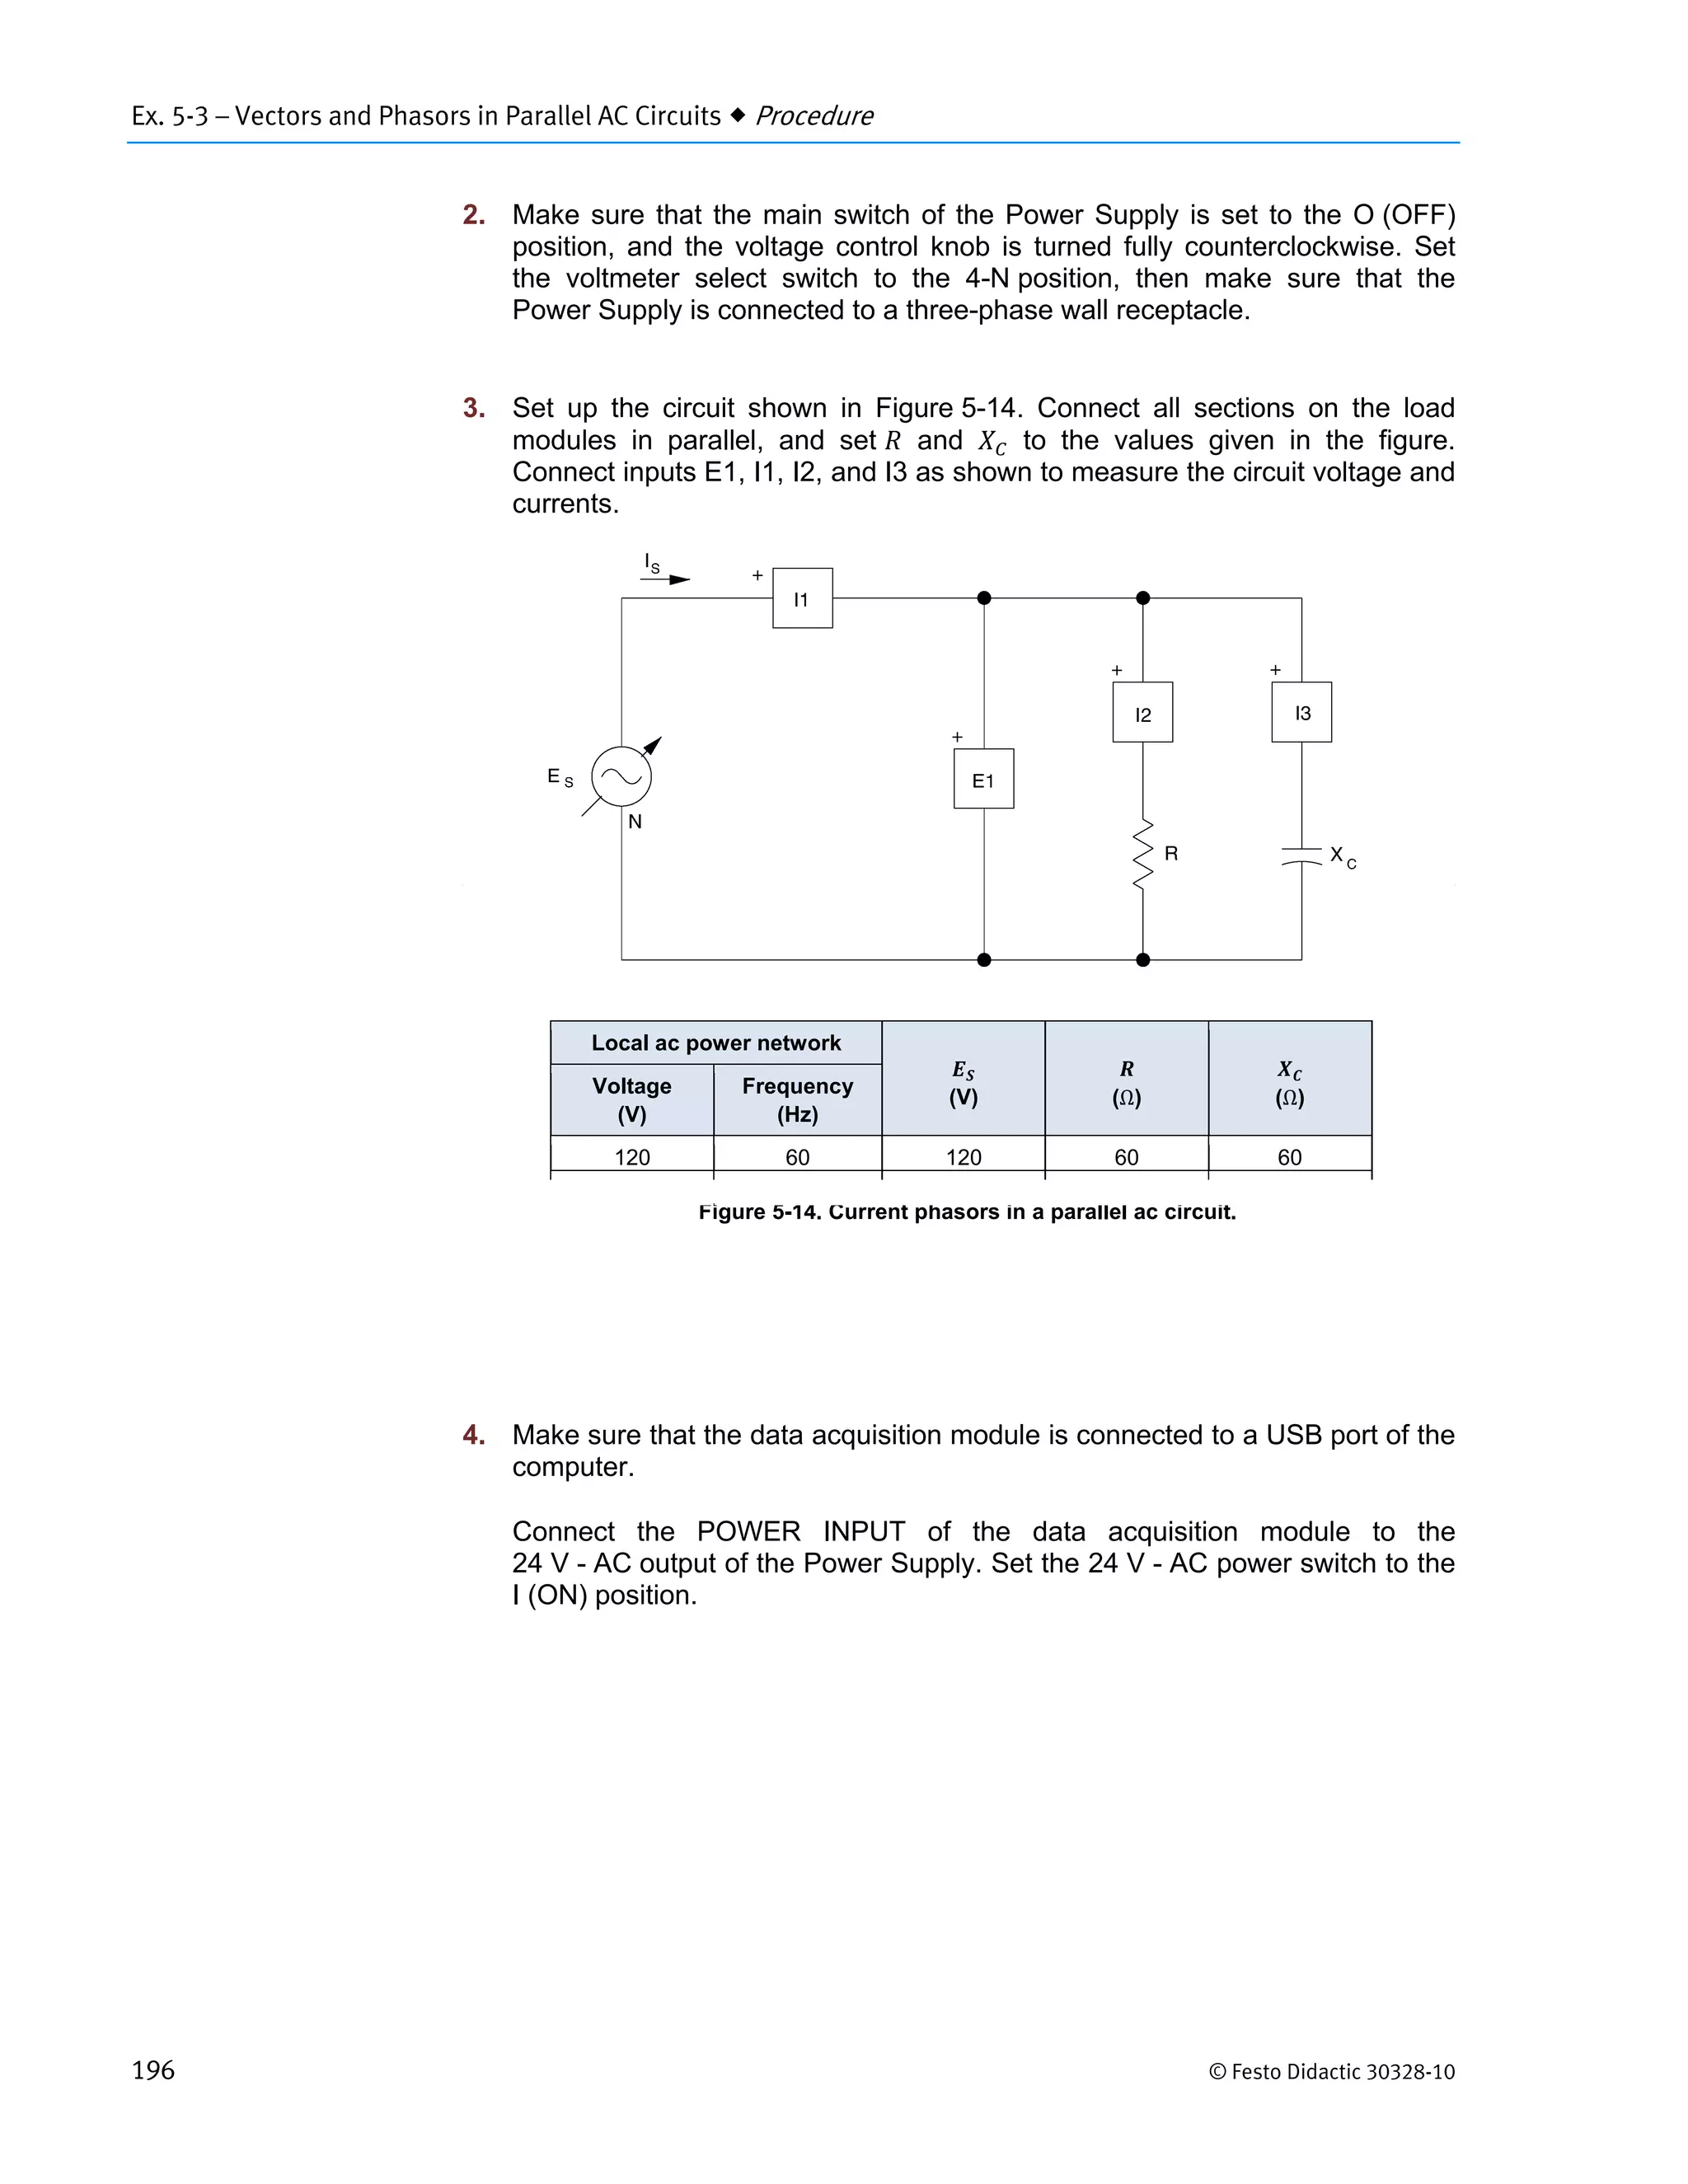
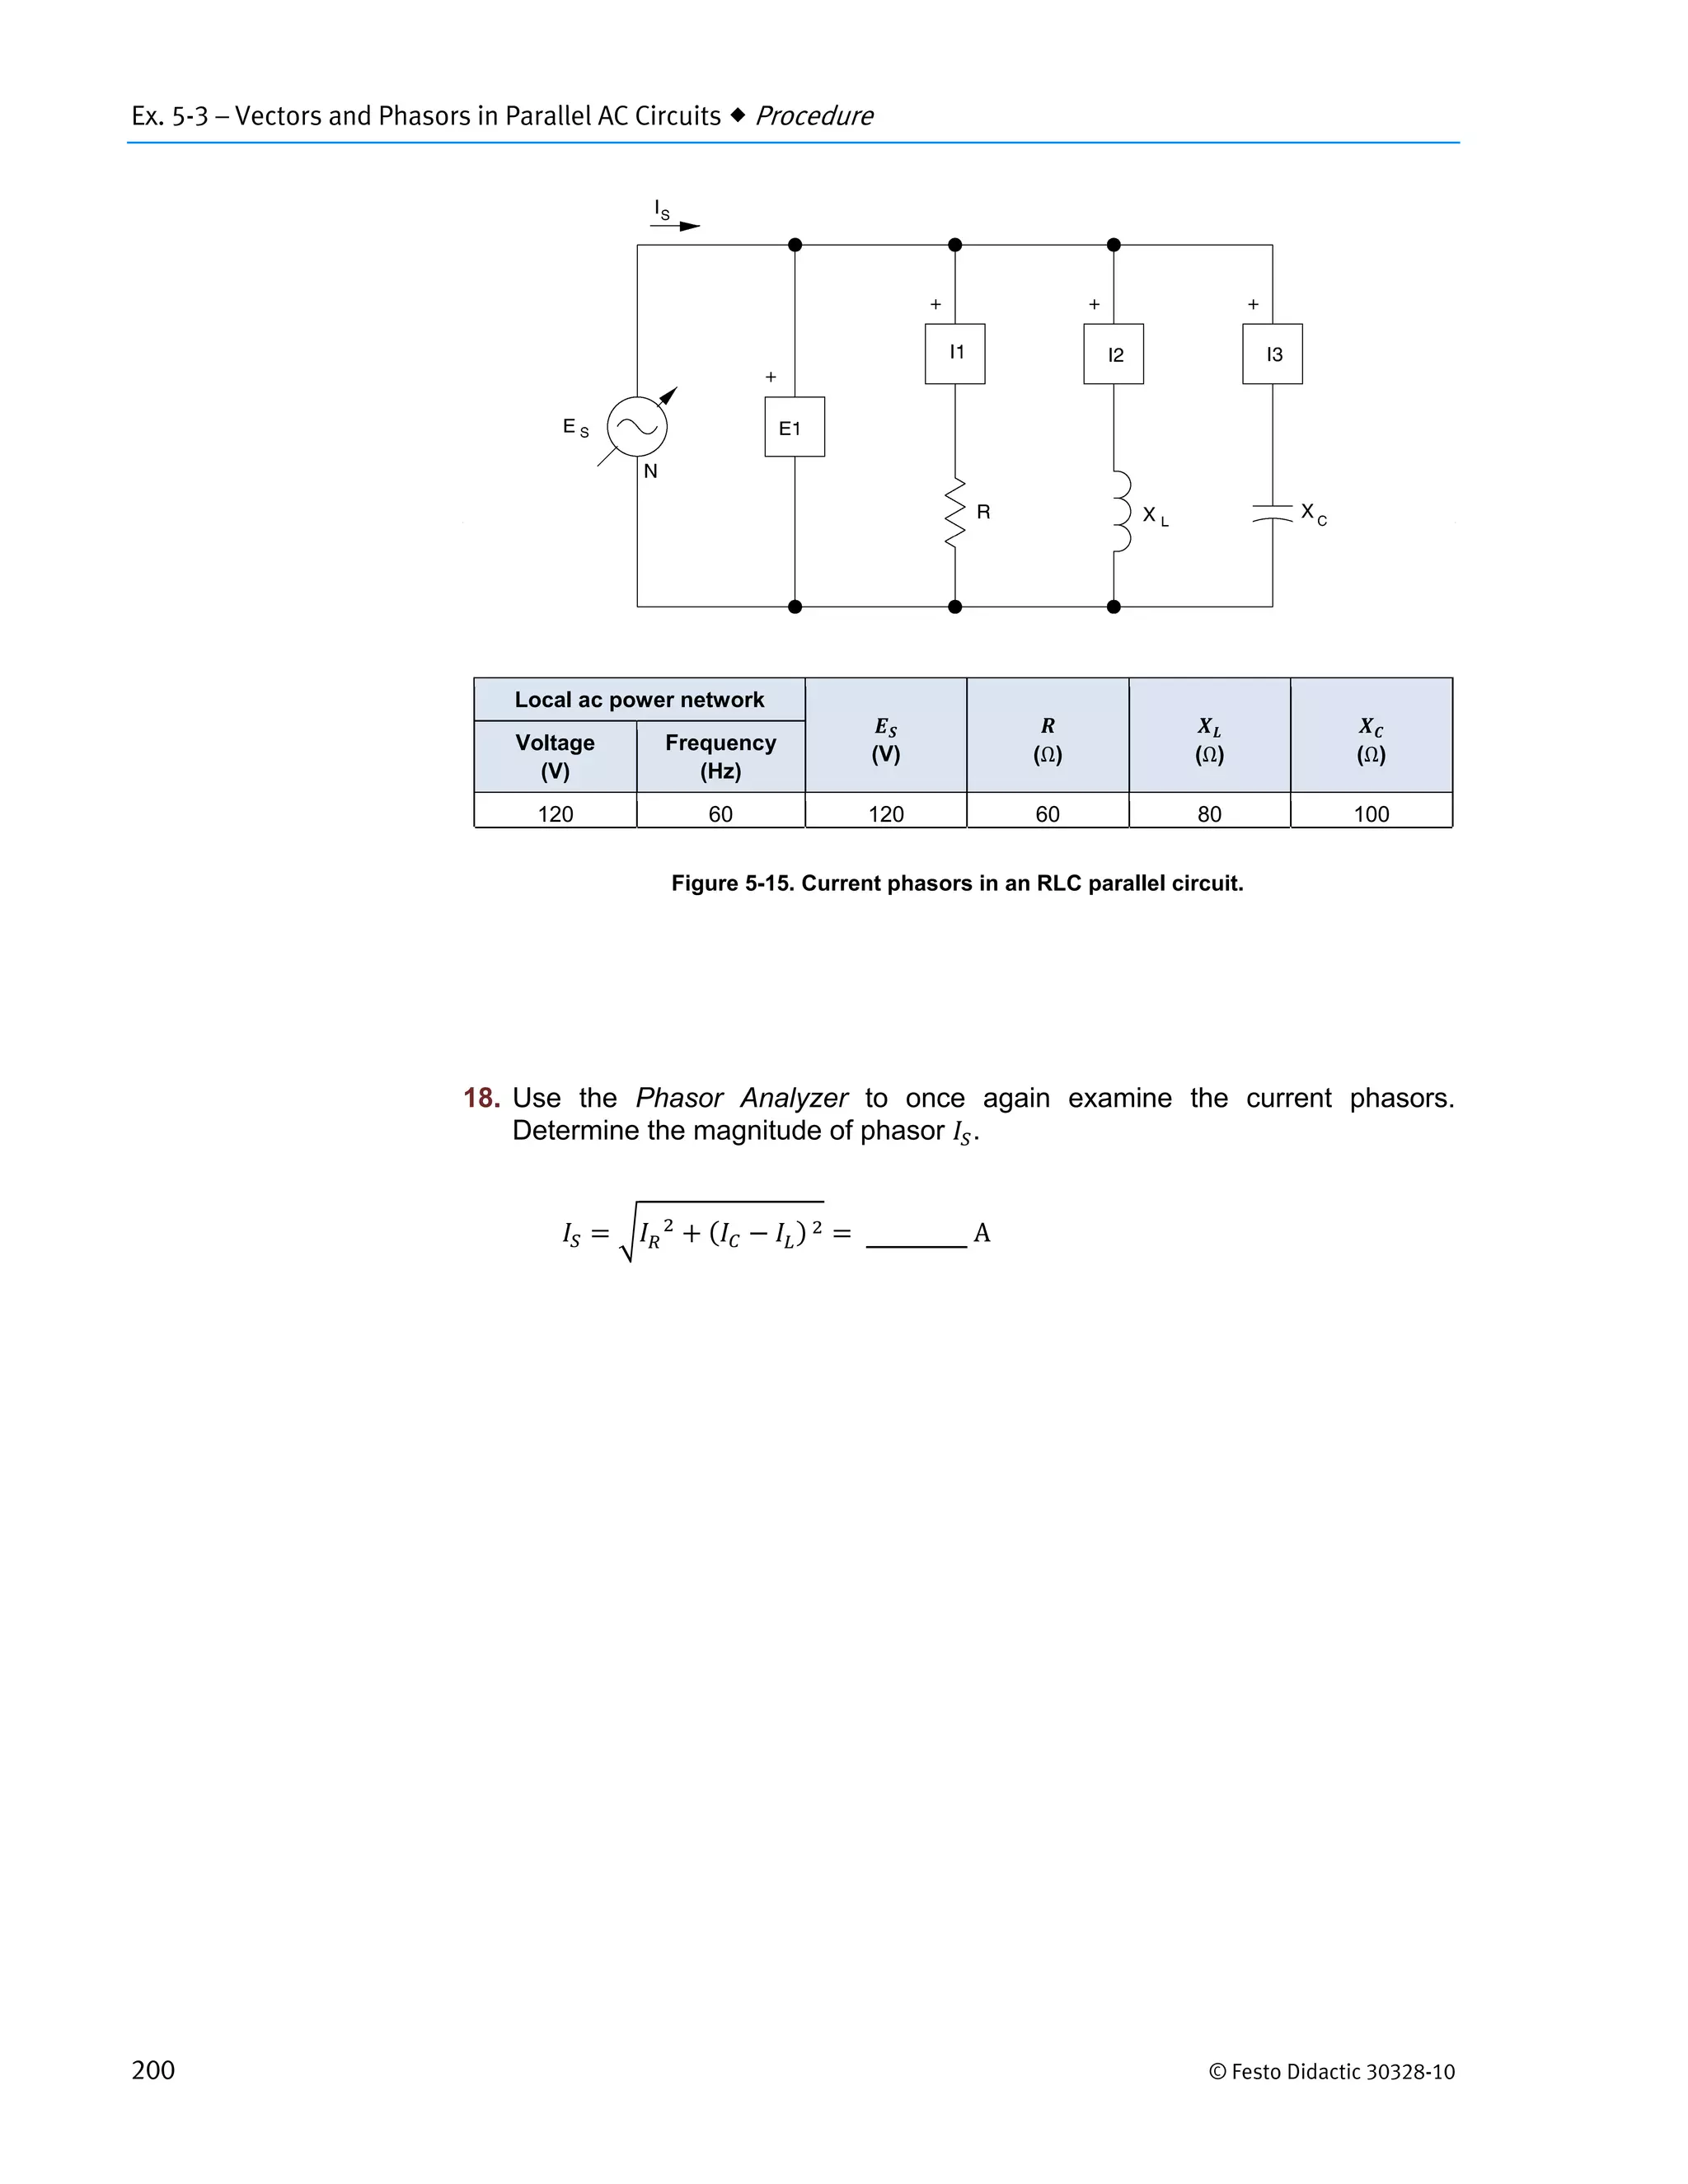
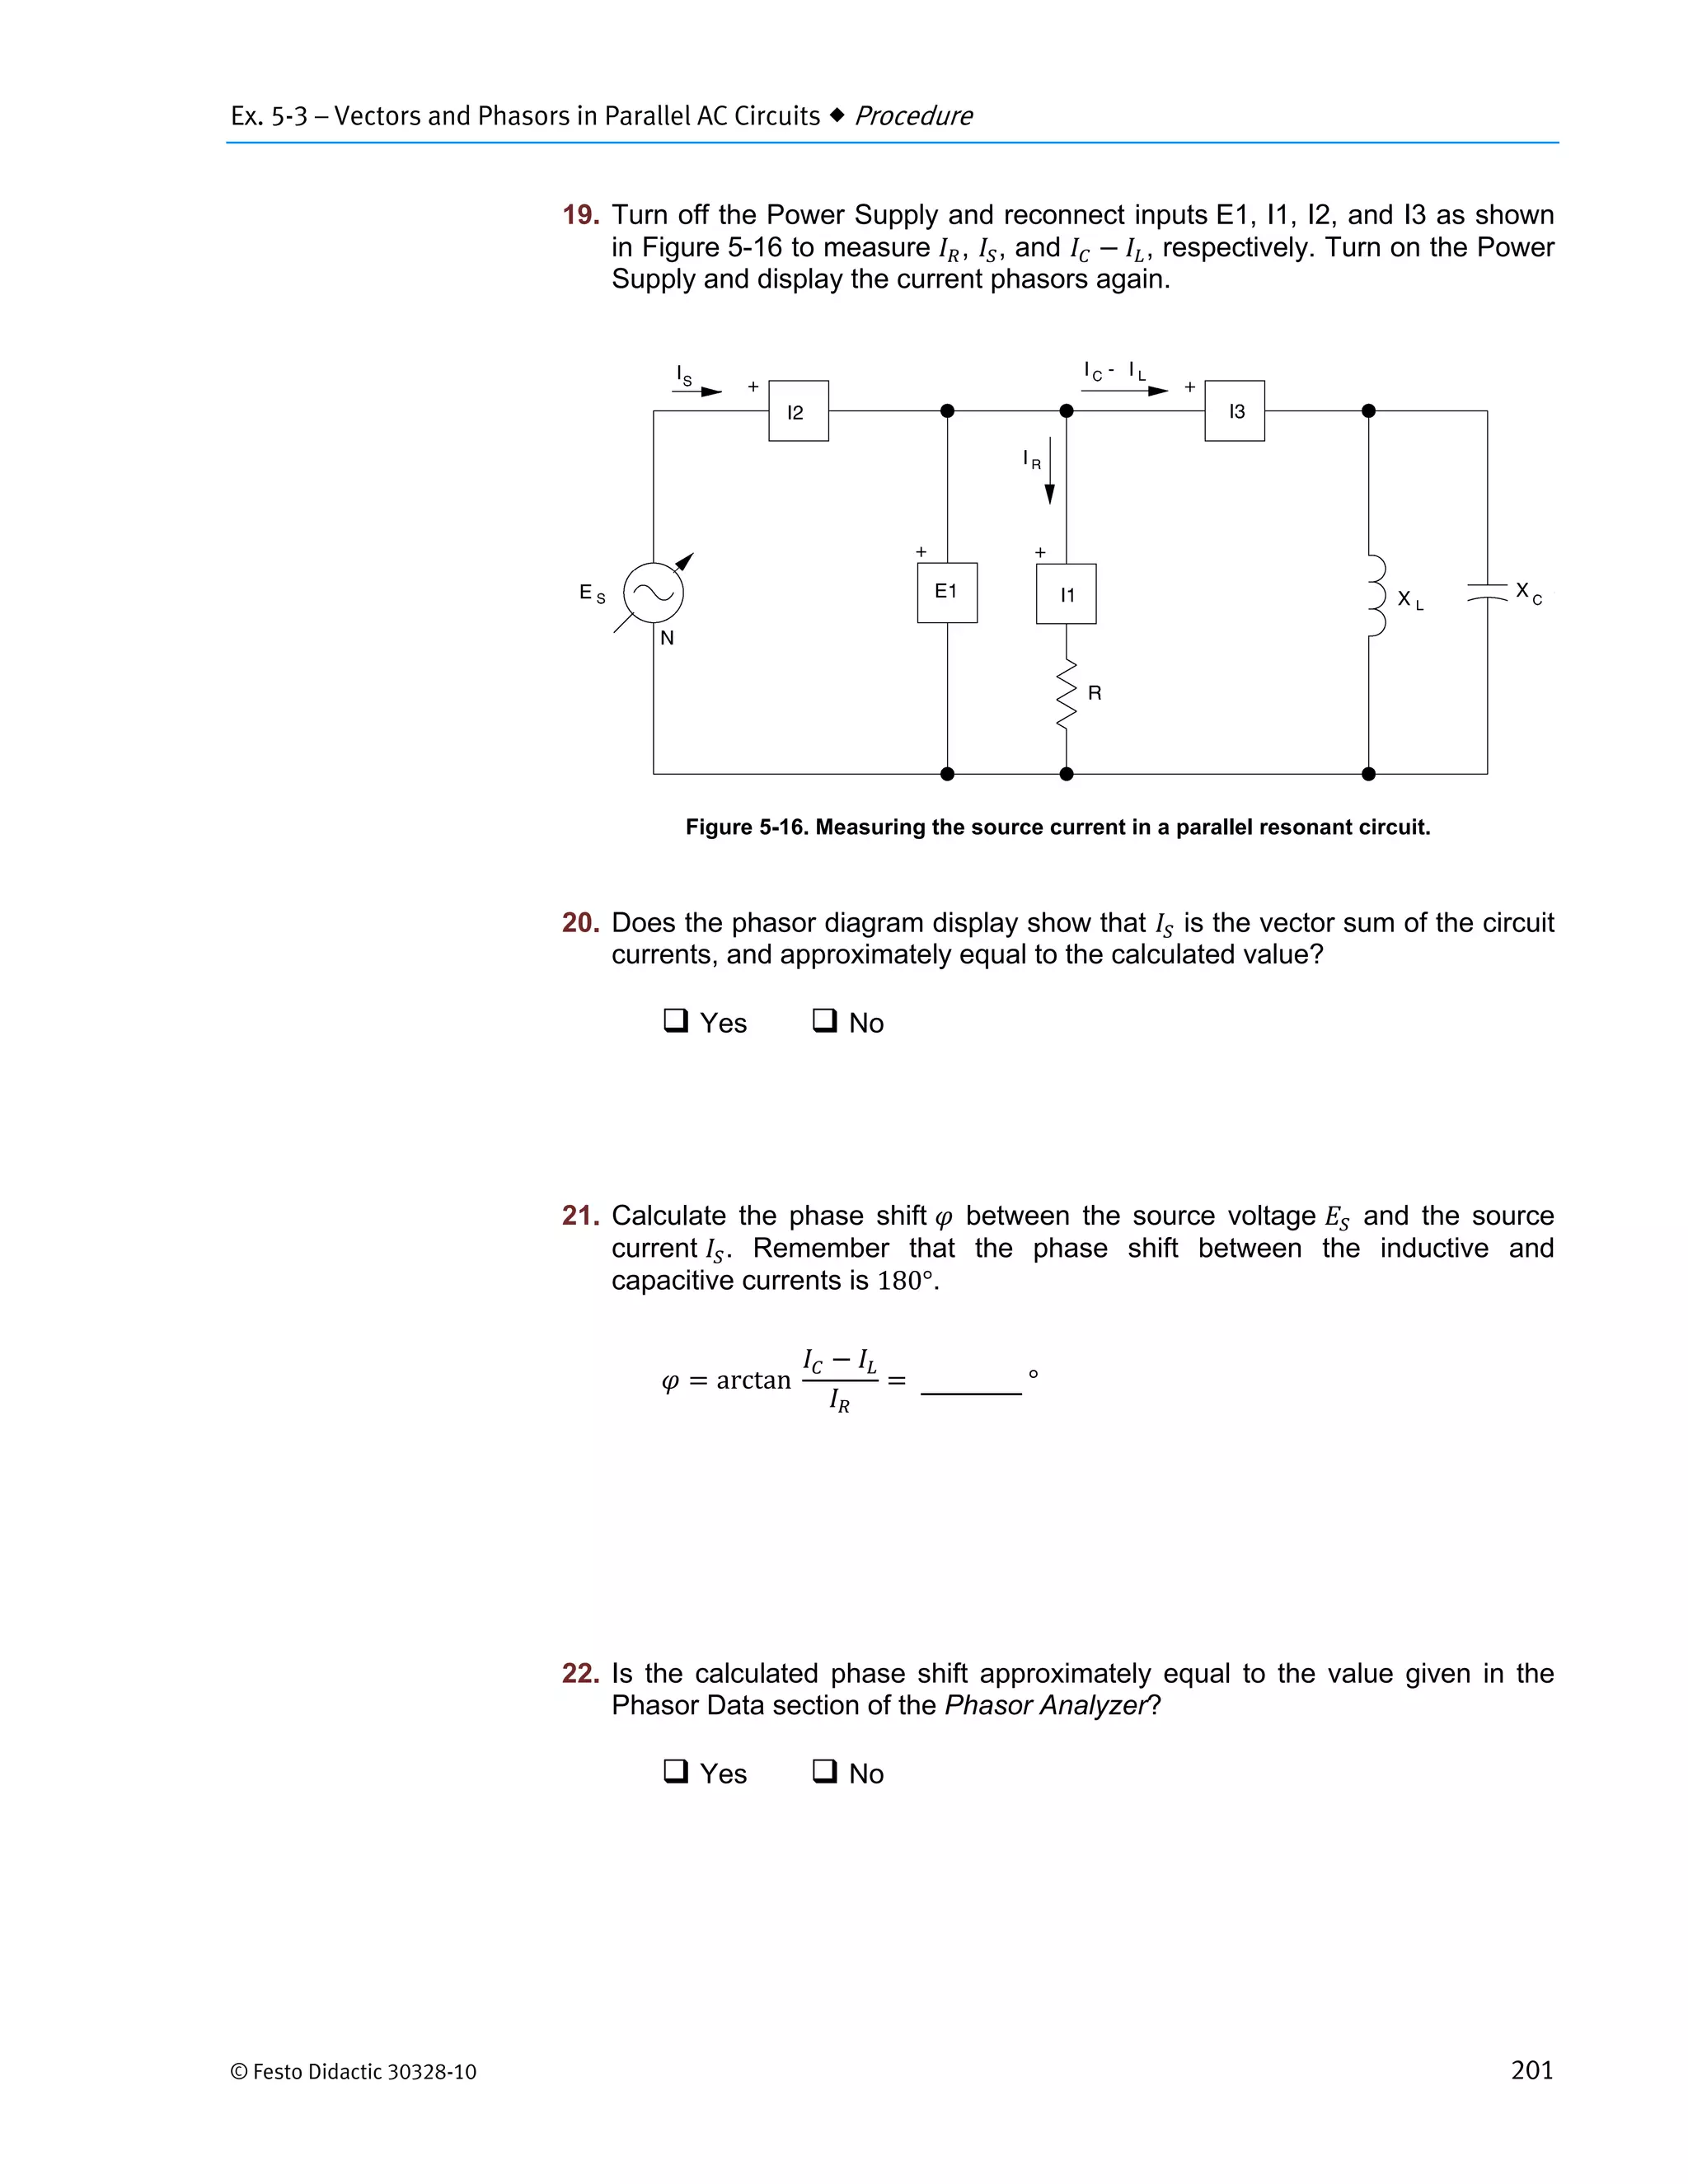
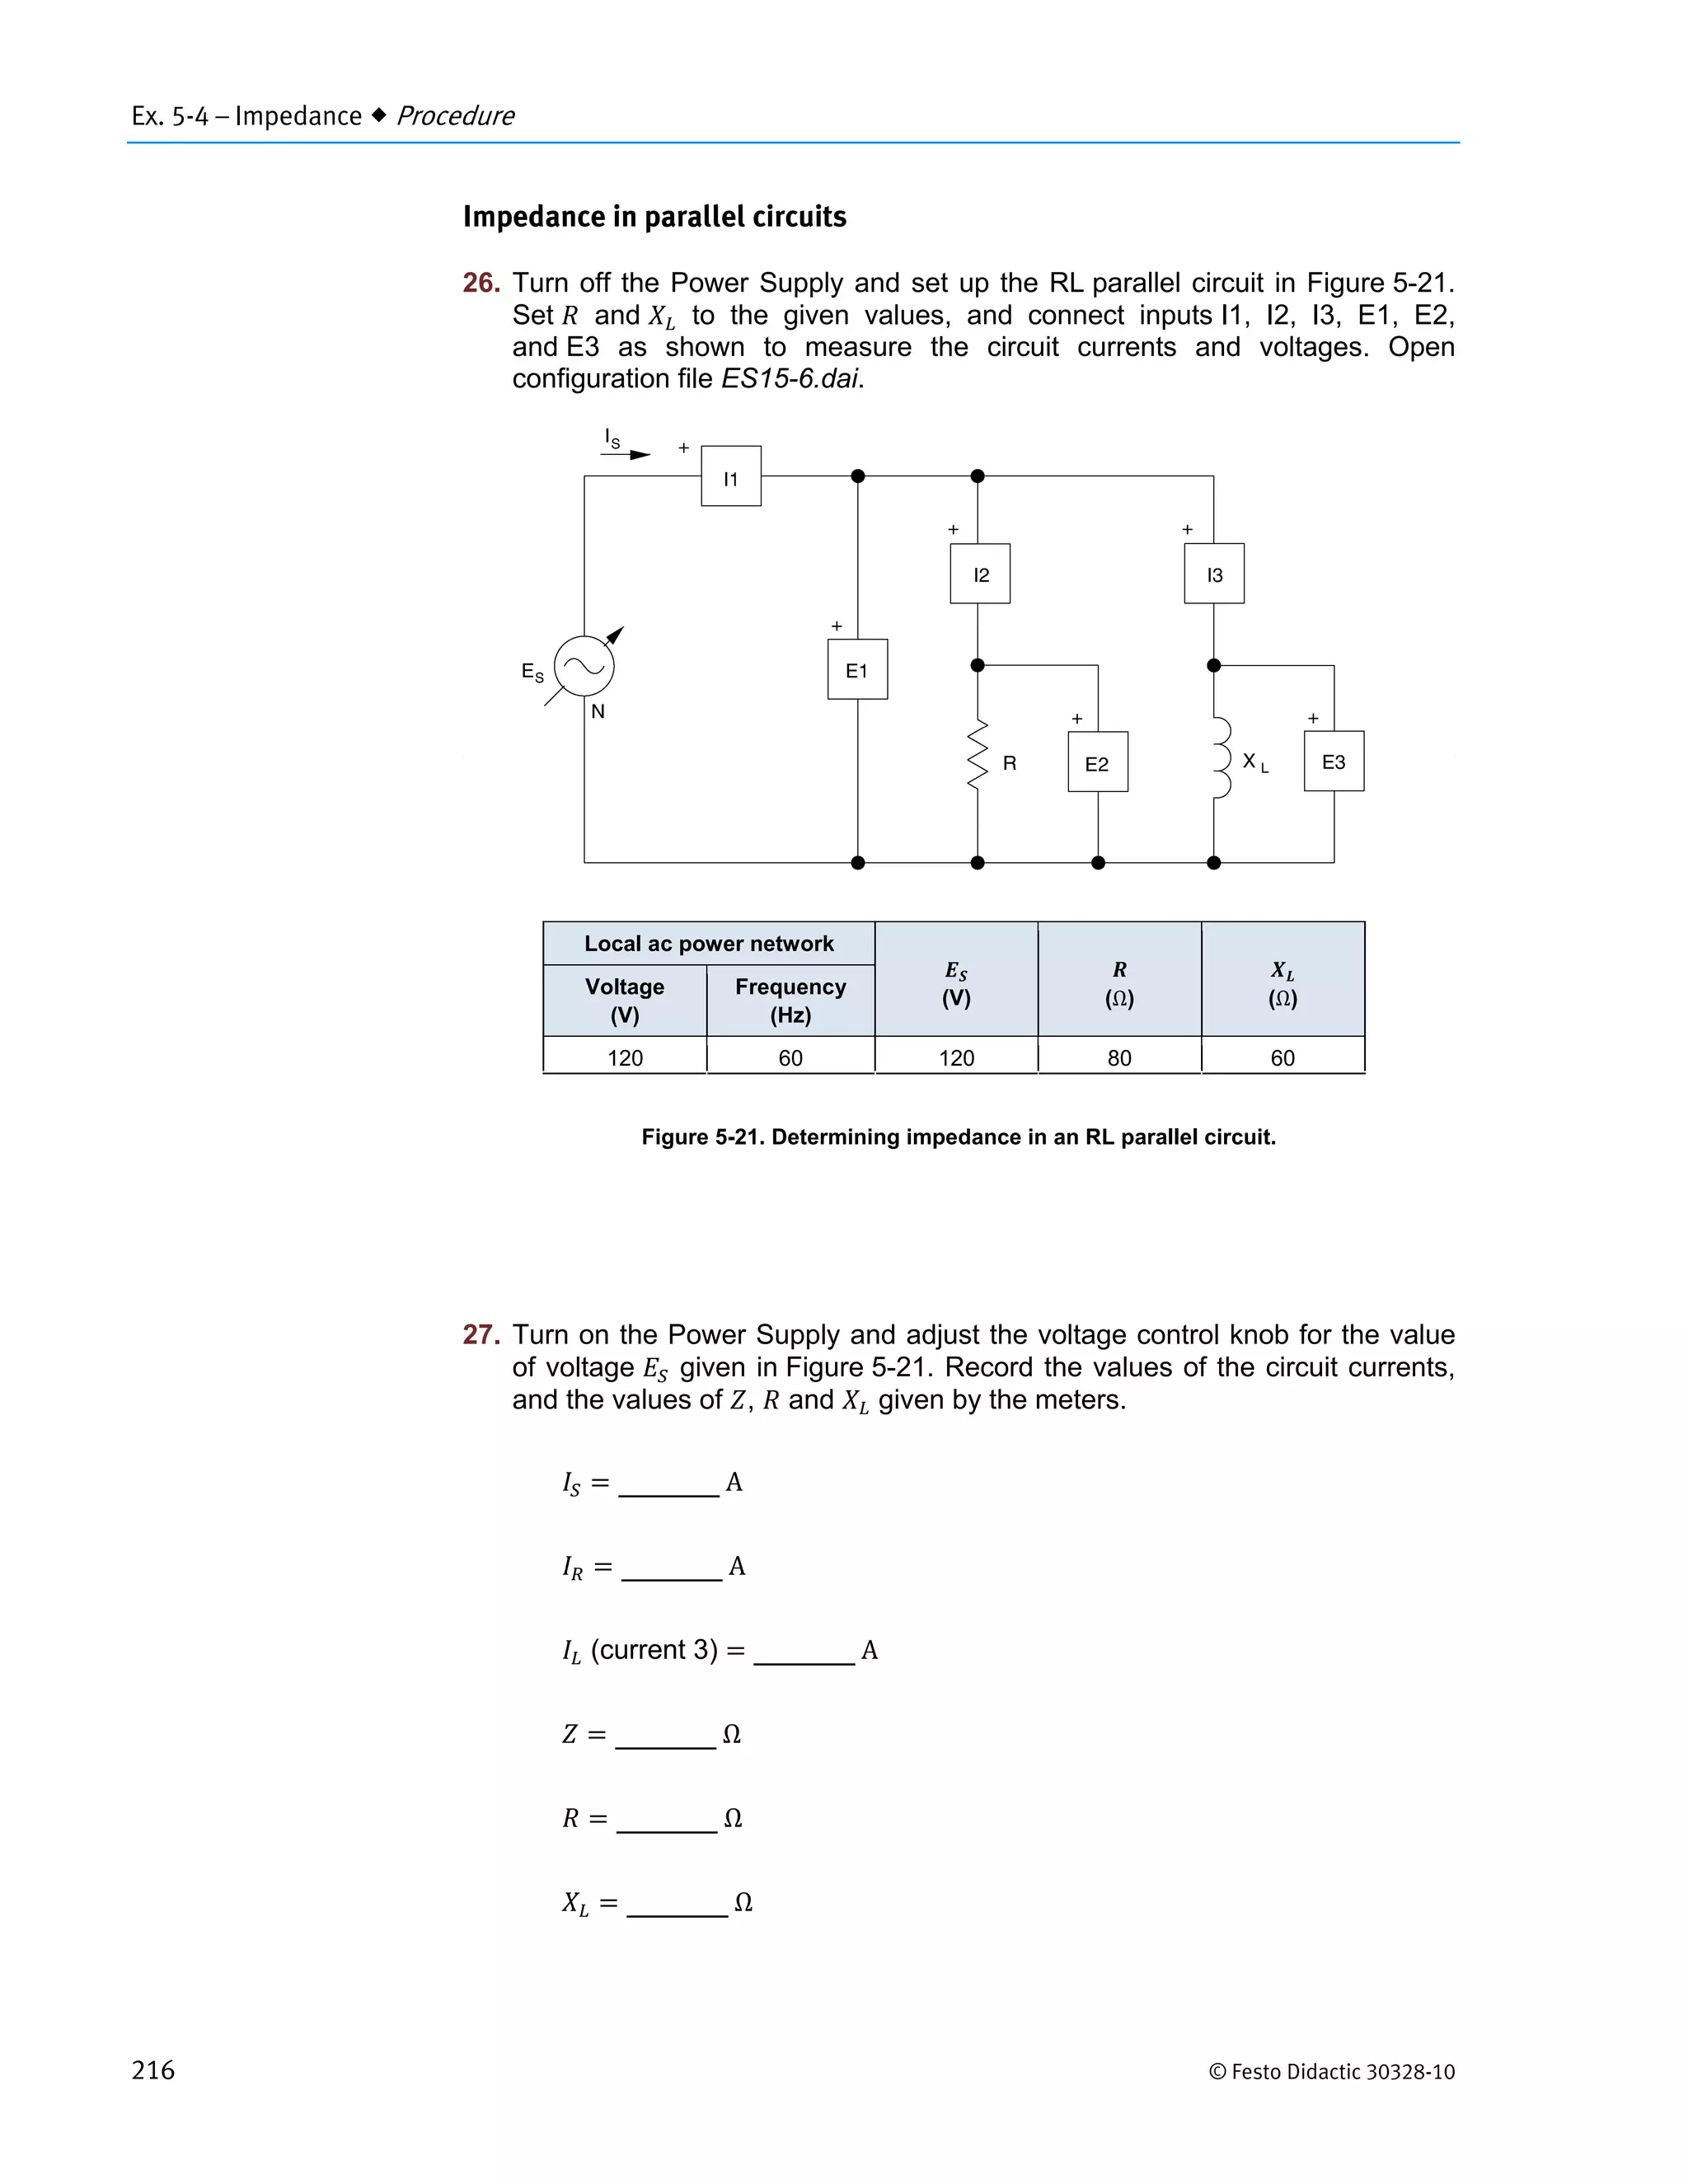
Introduction to analyzing parallel RL or RC circuits using phasors and vector addition to determine branch currents.
Detailed steps to measure and calculate currents in a parallel AC circuit, including comparisons to theoretical values.
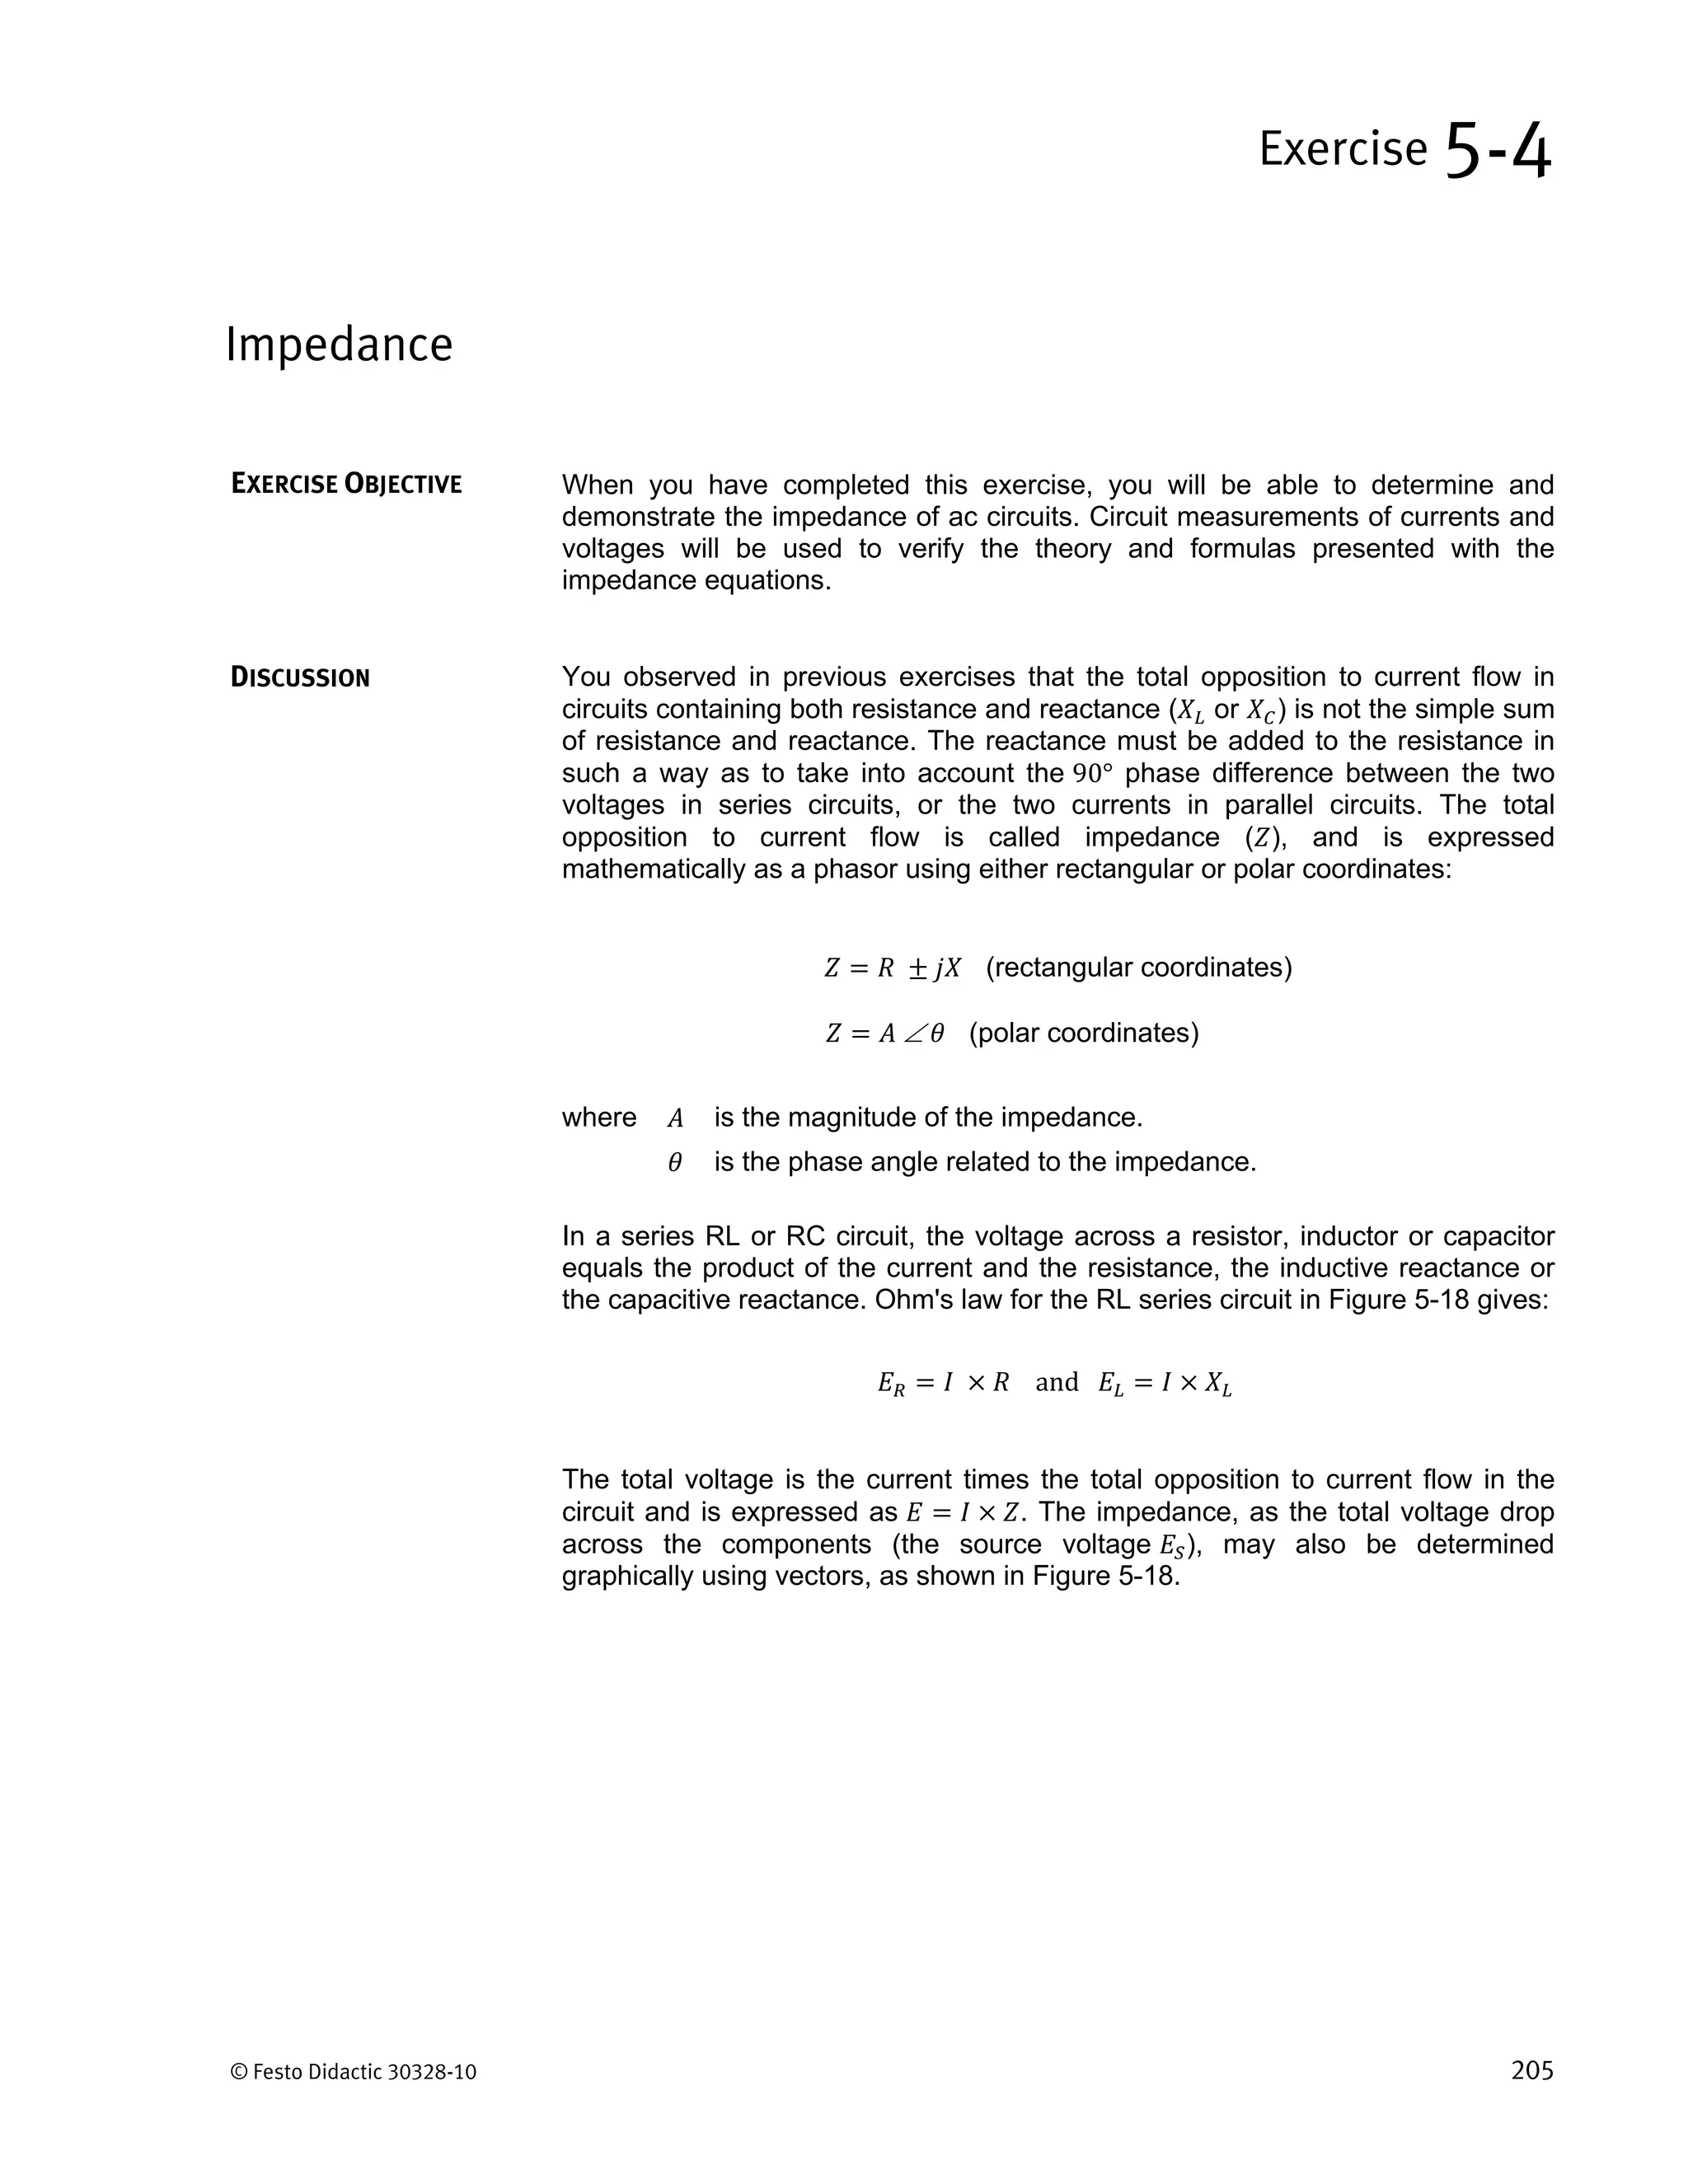
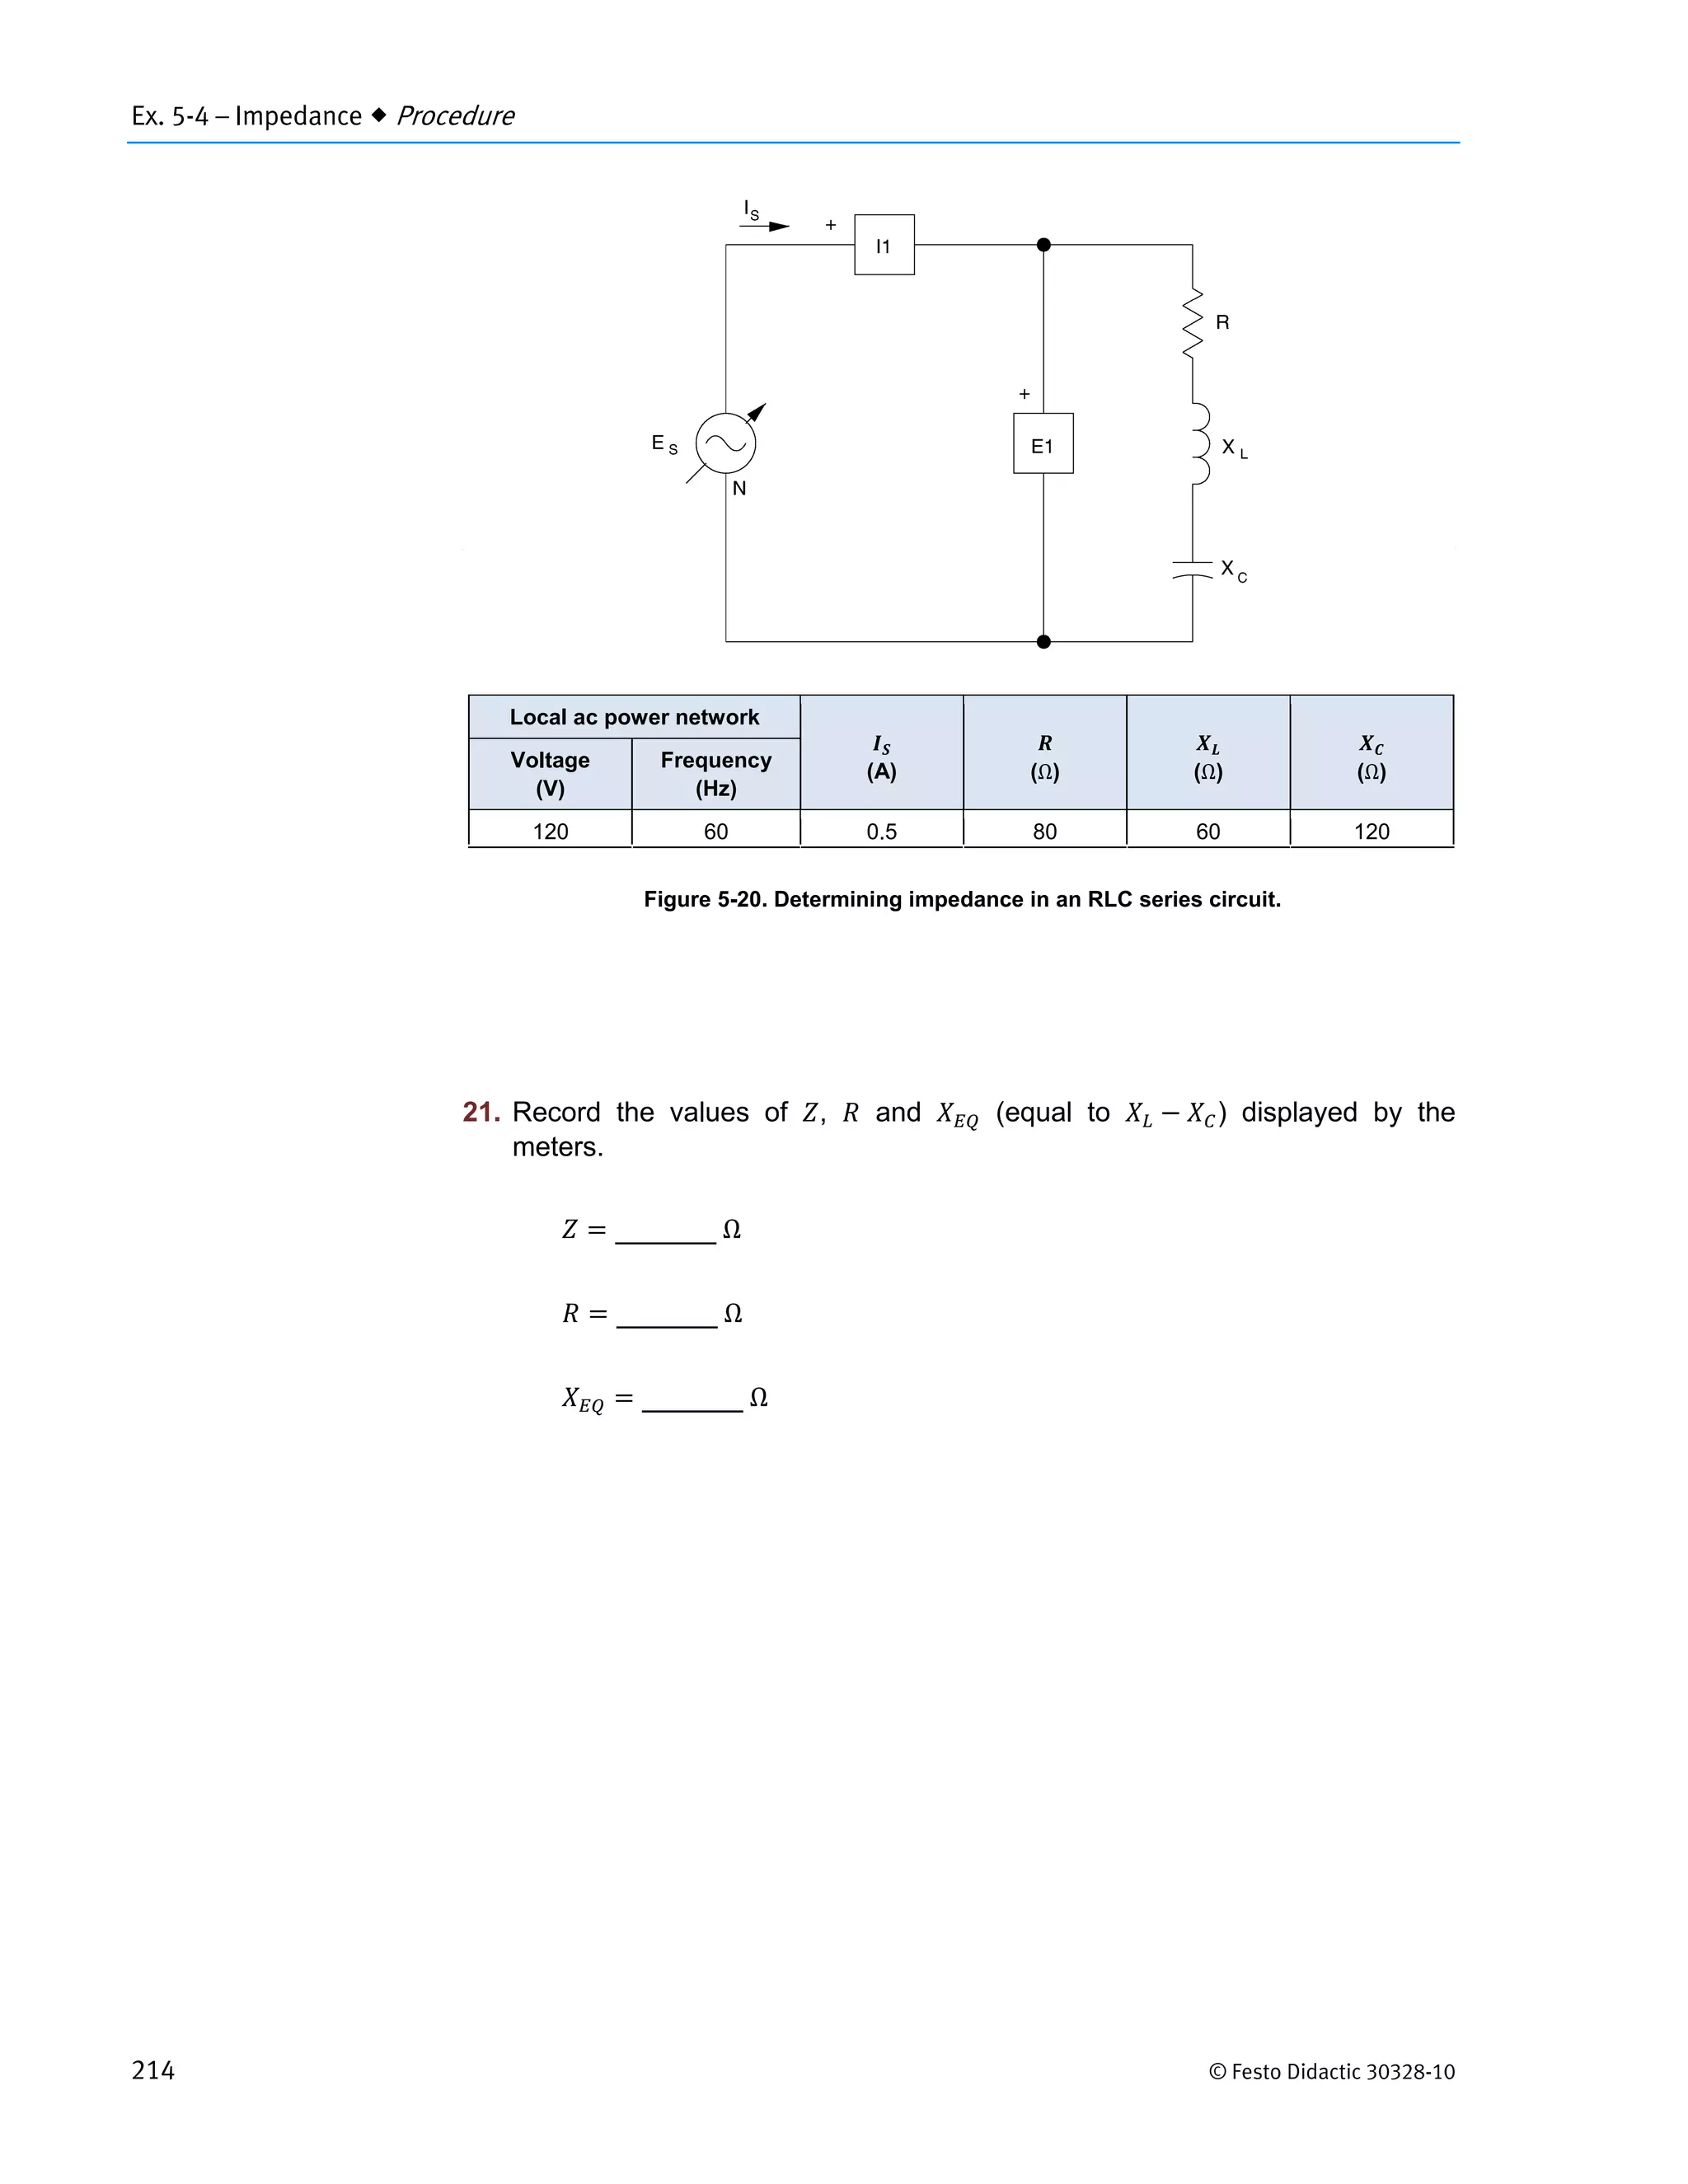
Practical exercises aimed at determining impedance in series and parallel circuits, emphasizing comparison against measured values.
Unit test questions focused on concepts of power, phasors, and impedance in AC circuits emphasizing rule applications.


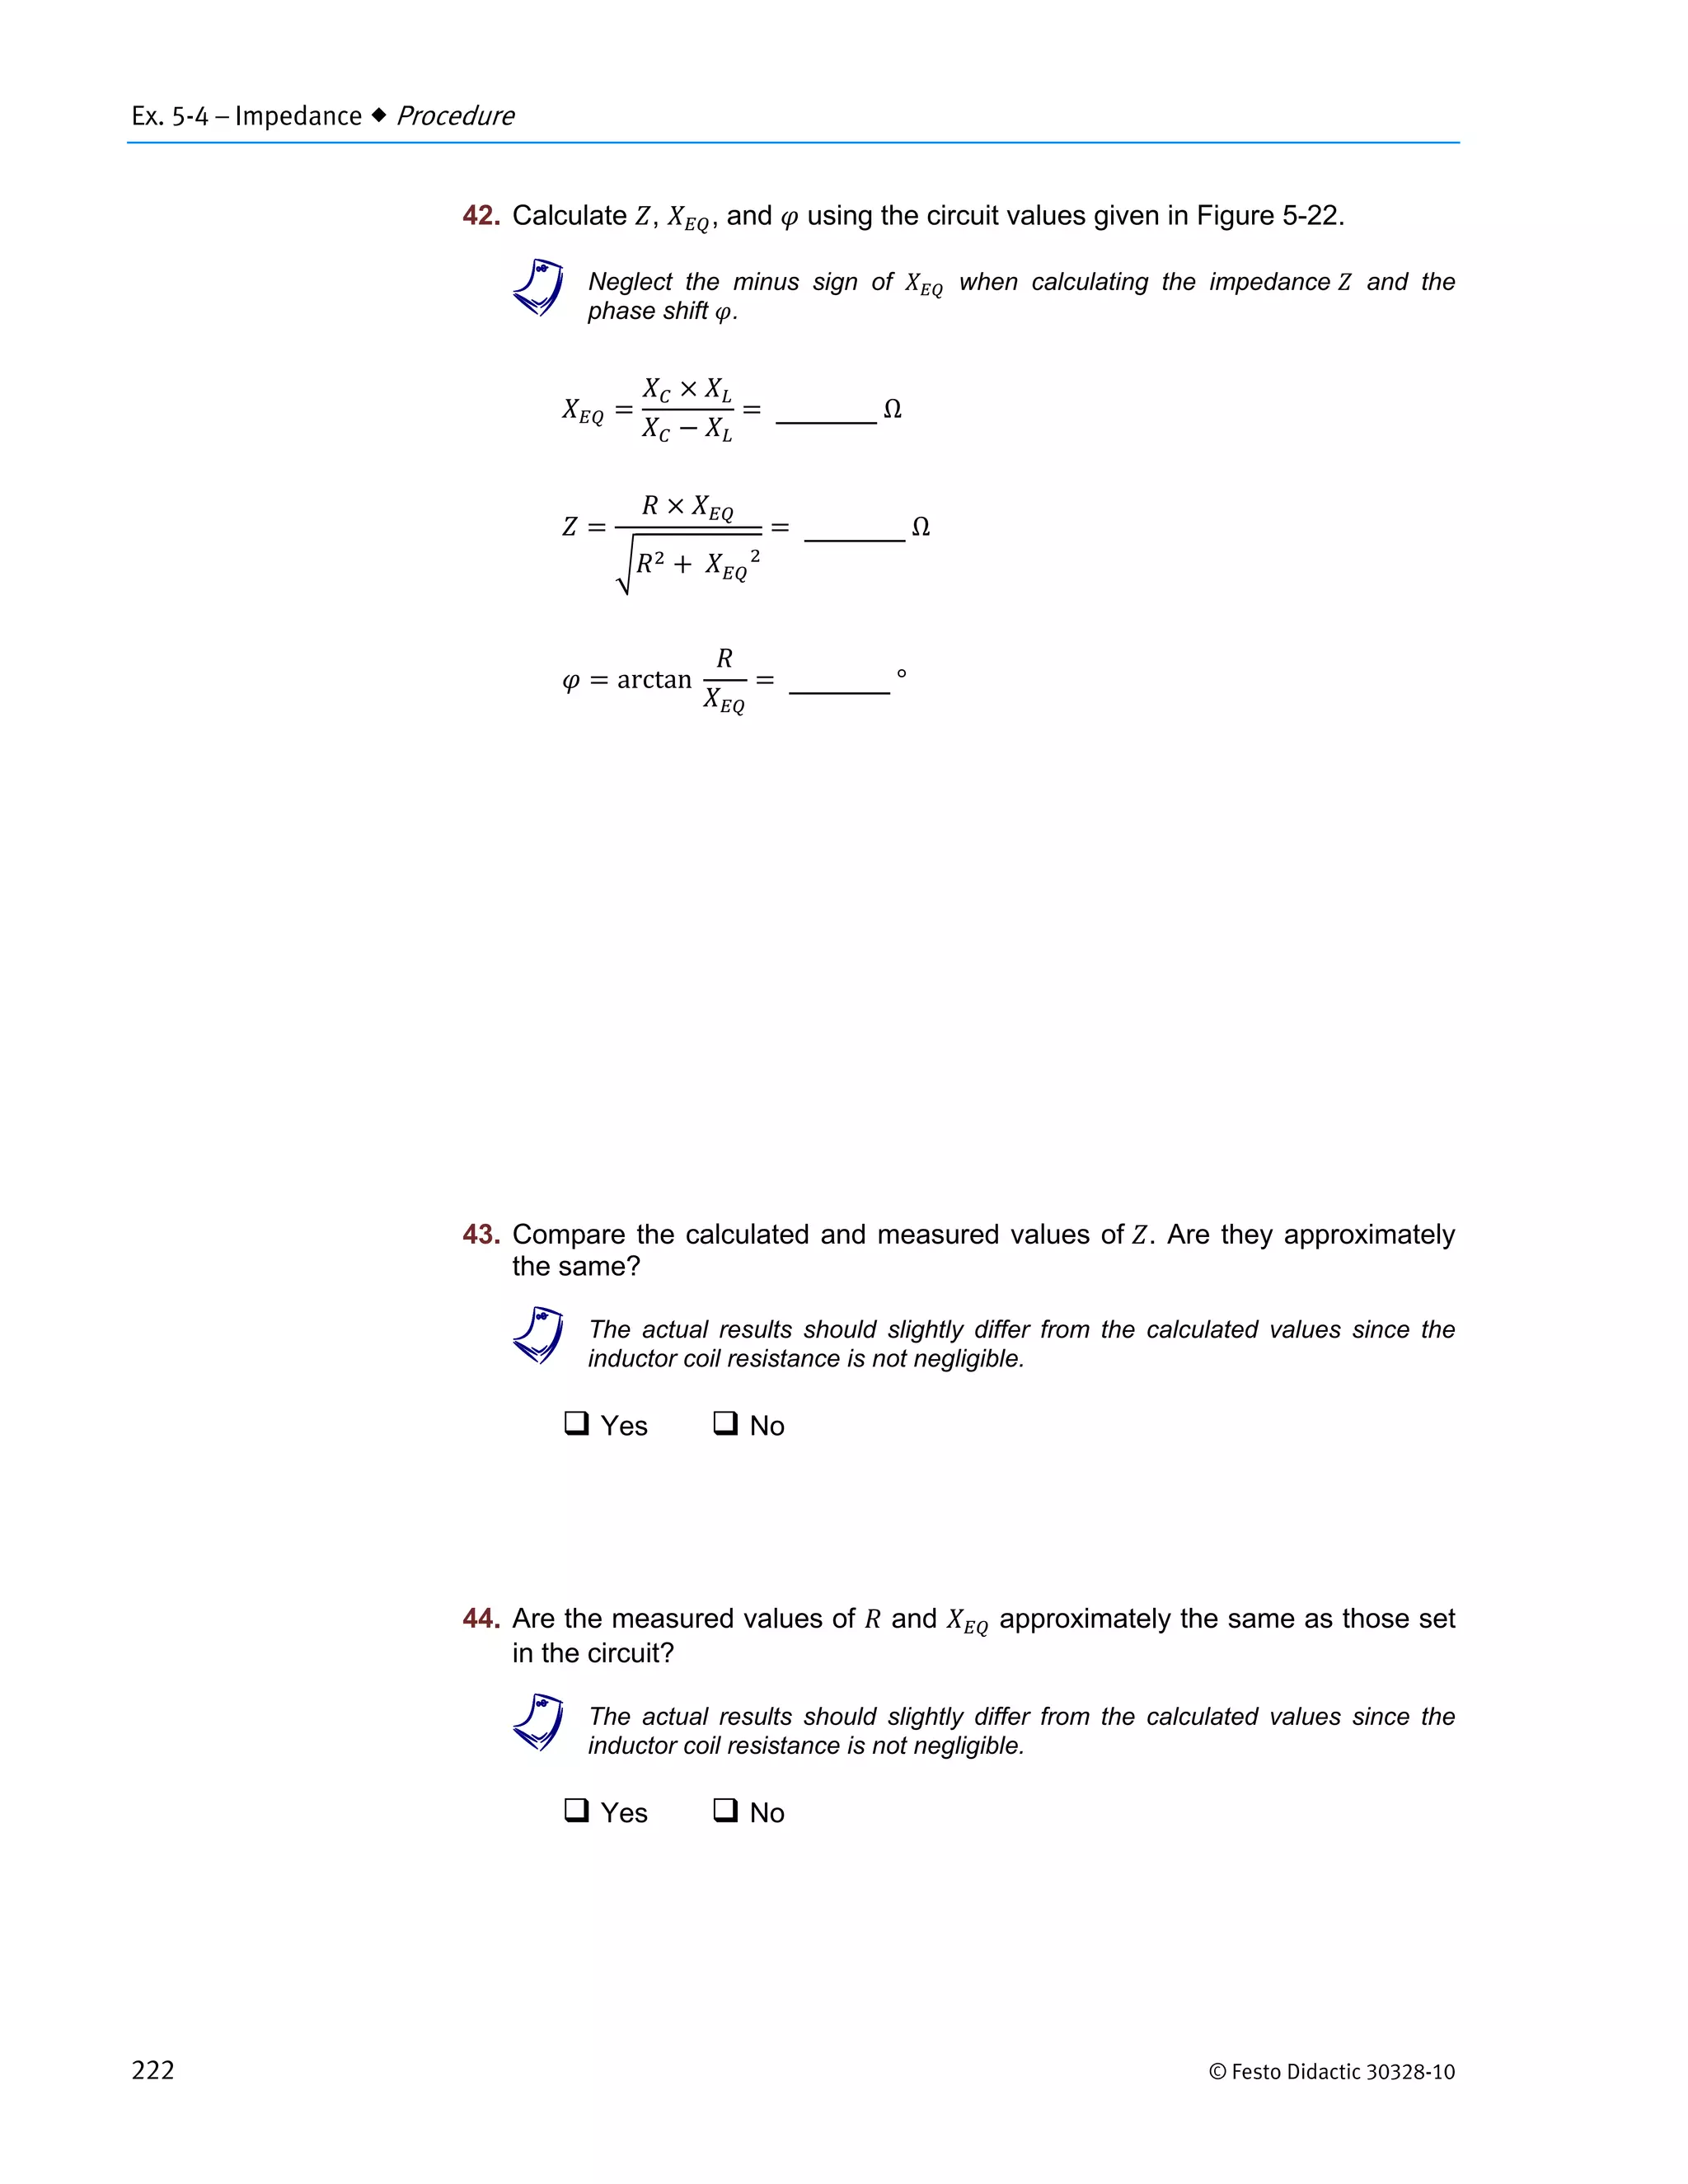
![Ex. 5-4 – Impedance Procedure
© Festo Didactic 30328-10 221
Figure 5-22. Determining impedance in an RLC parallel circuit.
41. Record the values of , , and [equal to ⁄ ] displayed by
the meters.
Ω
Ω
Ω
Local ac power network
(V) (Ω) (Ω) (Ω)
Voltage
(V)
Frequency
(Hz)
120 60 120 80 80 60
If needed, change the , , and "functions" to 2//(E1I1), 2//(E2I2), or
2//(E3I3), and "mode" to "X", "Z", or "R" to obtain the correct values. This ensures the
software is using the parallel calculation functions to calculate and display the
appropriate readings for your measurements.](https://image.slidesharecdn.com/unit5labvoltstudentmanual-190219162405/75/Power-Circuits-and-Transforers-Unit-5-Labvolt-Student-Manual-57-2048.jpg)