Download to read offline


![A
(14%)
B
(14%)
D
(14%)
I
([PERCENTAGE]) E
([PERCENTAGE])
L
([PERCENTAGE])
E
(8%)
K
([PERCENTAGE])
J
([PERCENTAGE])
E
([PERCENTAGE])
E
([PERCENTAGE])
C
([PERCENTAGE])
TOP 5 investment priori4es to help ensure our long term compe44veness
Improved transport links between ci1es e.g.
HS2, HS3 Northern Powerhouse
Improved transport linkages within ci1es and
city regions e.g. Cross Rail 2
Increased airport capacity in the South East
Conven1onal Power Genera1on,
Transmission, Distribu1on
Increase Renewable Energy
Systems Improvement e.g. electrifica1on
Improving UK's main Trunk Roads and
Motorways
Improving Local Road Transport
Flood Defense / Climate Resilience
Ranking Priority
1st
A
B
Improved Transport between ci1es
Improved transport within ci1es
3rd C Digital & IT Infrastructure
4th D Airport Expansion in SE
5th
E
F
G
H
Trunk Road & Motorway Improvement
Increased Renewable Energy
Urban Housing
Social Infrastructure
9th
10th
11th
12th
I
J
K
L
Conven1onal Power
Flood Defence / Climate resilience
Local Road Transport
Systems Improvements, Electrifica1on
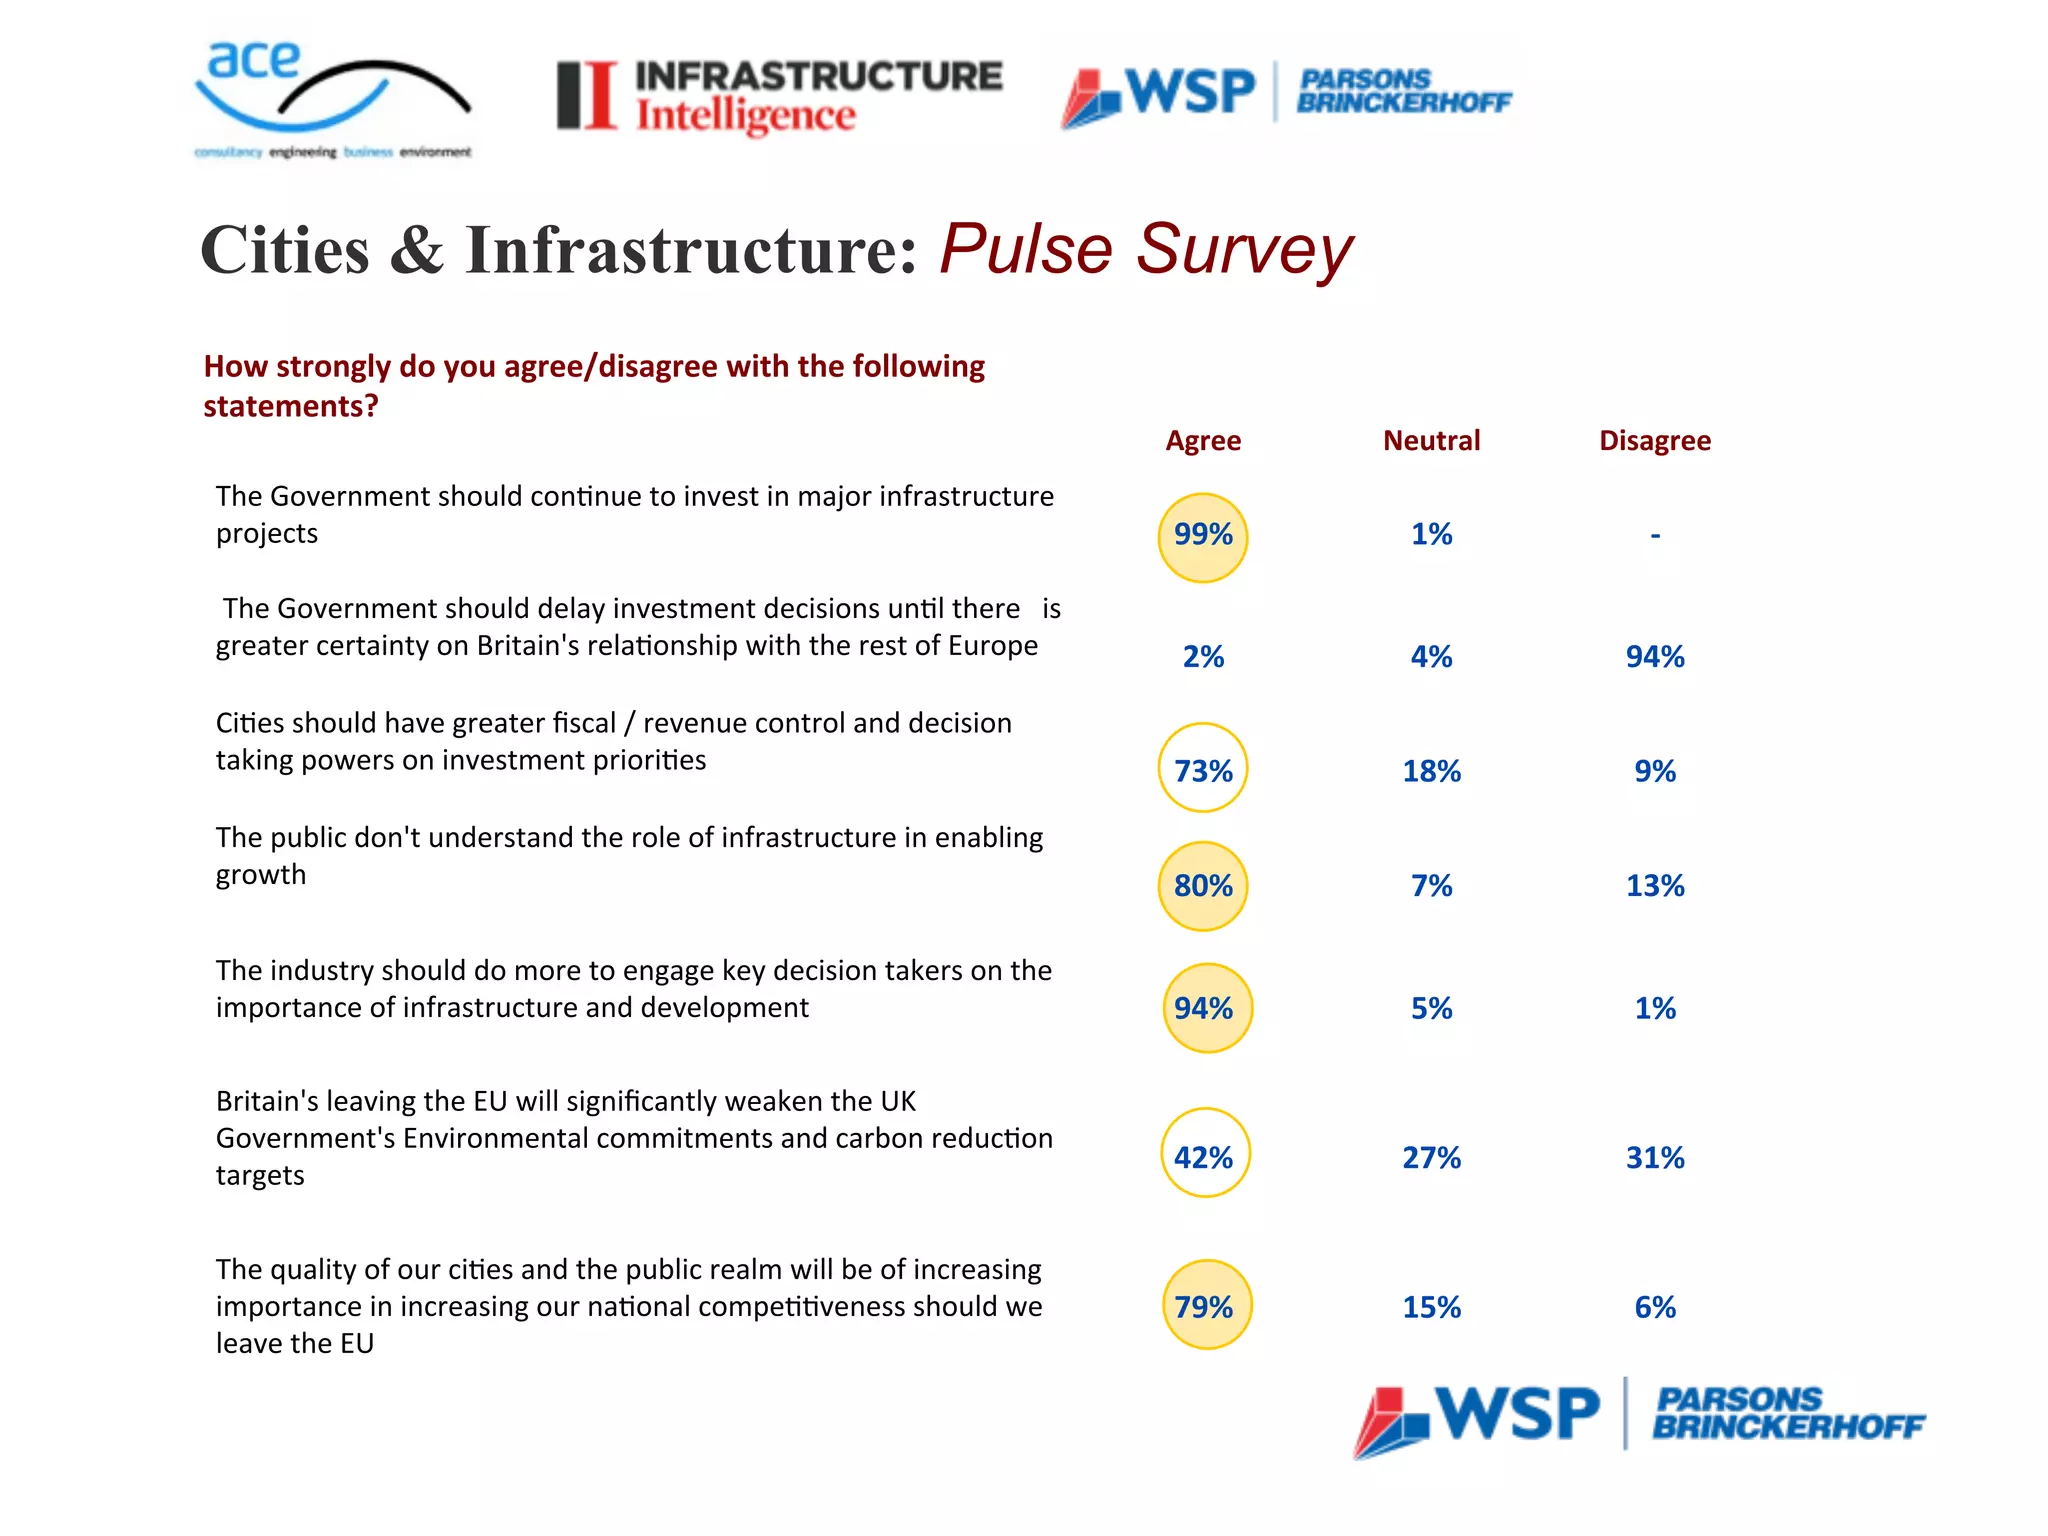
Cities & Infrastructure: Pulse Survey
Single most important areas for Government and policy makers to ensure growth and compe44veness
Na4onal Infrastructure 28%
23%
20%
Beker, integrated inter- urban transport systems
Long term na1onal infrastructure plan with cross party support
Na1onal clean power strategy + support systems
City & City Regions 22%
20%
17%
Beker public transport systems
Beker, integrated mul1-modal transport systems
Devolu1on
Rural 52%
10%
7%
Broad-Band
Community Investment
Planning policies that support economic development](https://image.slidesharecdn.com/c4ir1sharratt-170313123823/75/Global-C4IR-1-Masterclass-Cambridge-Sharratt-WSP-2017-19-2048.jpg)


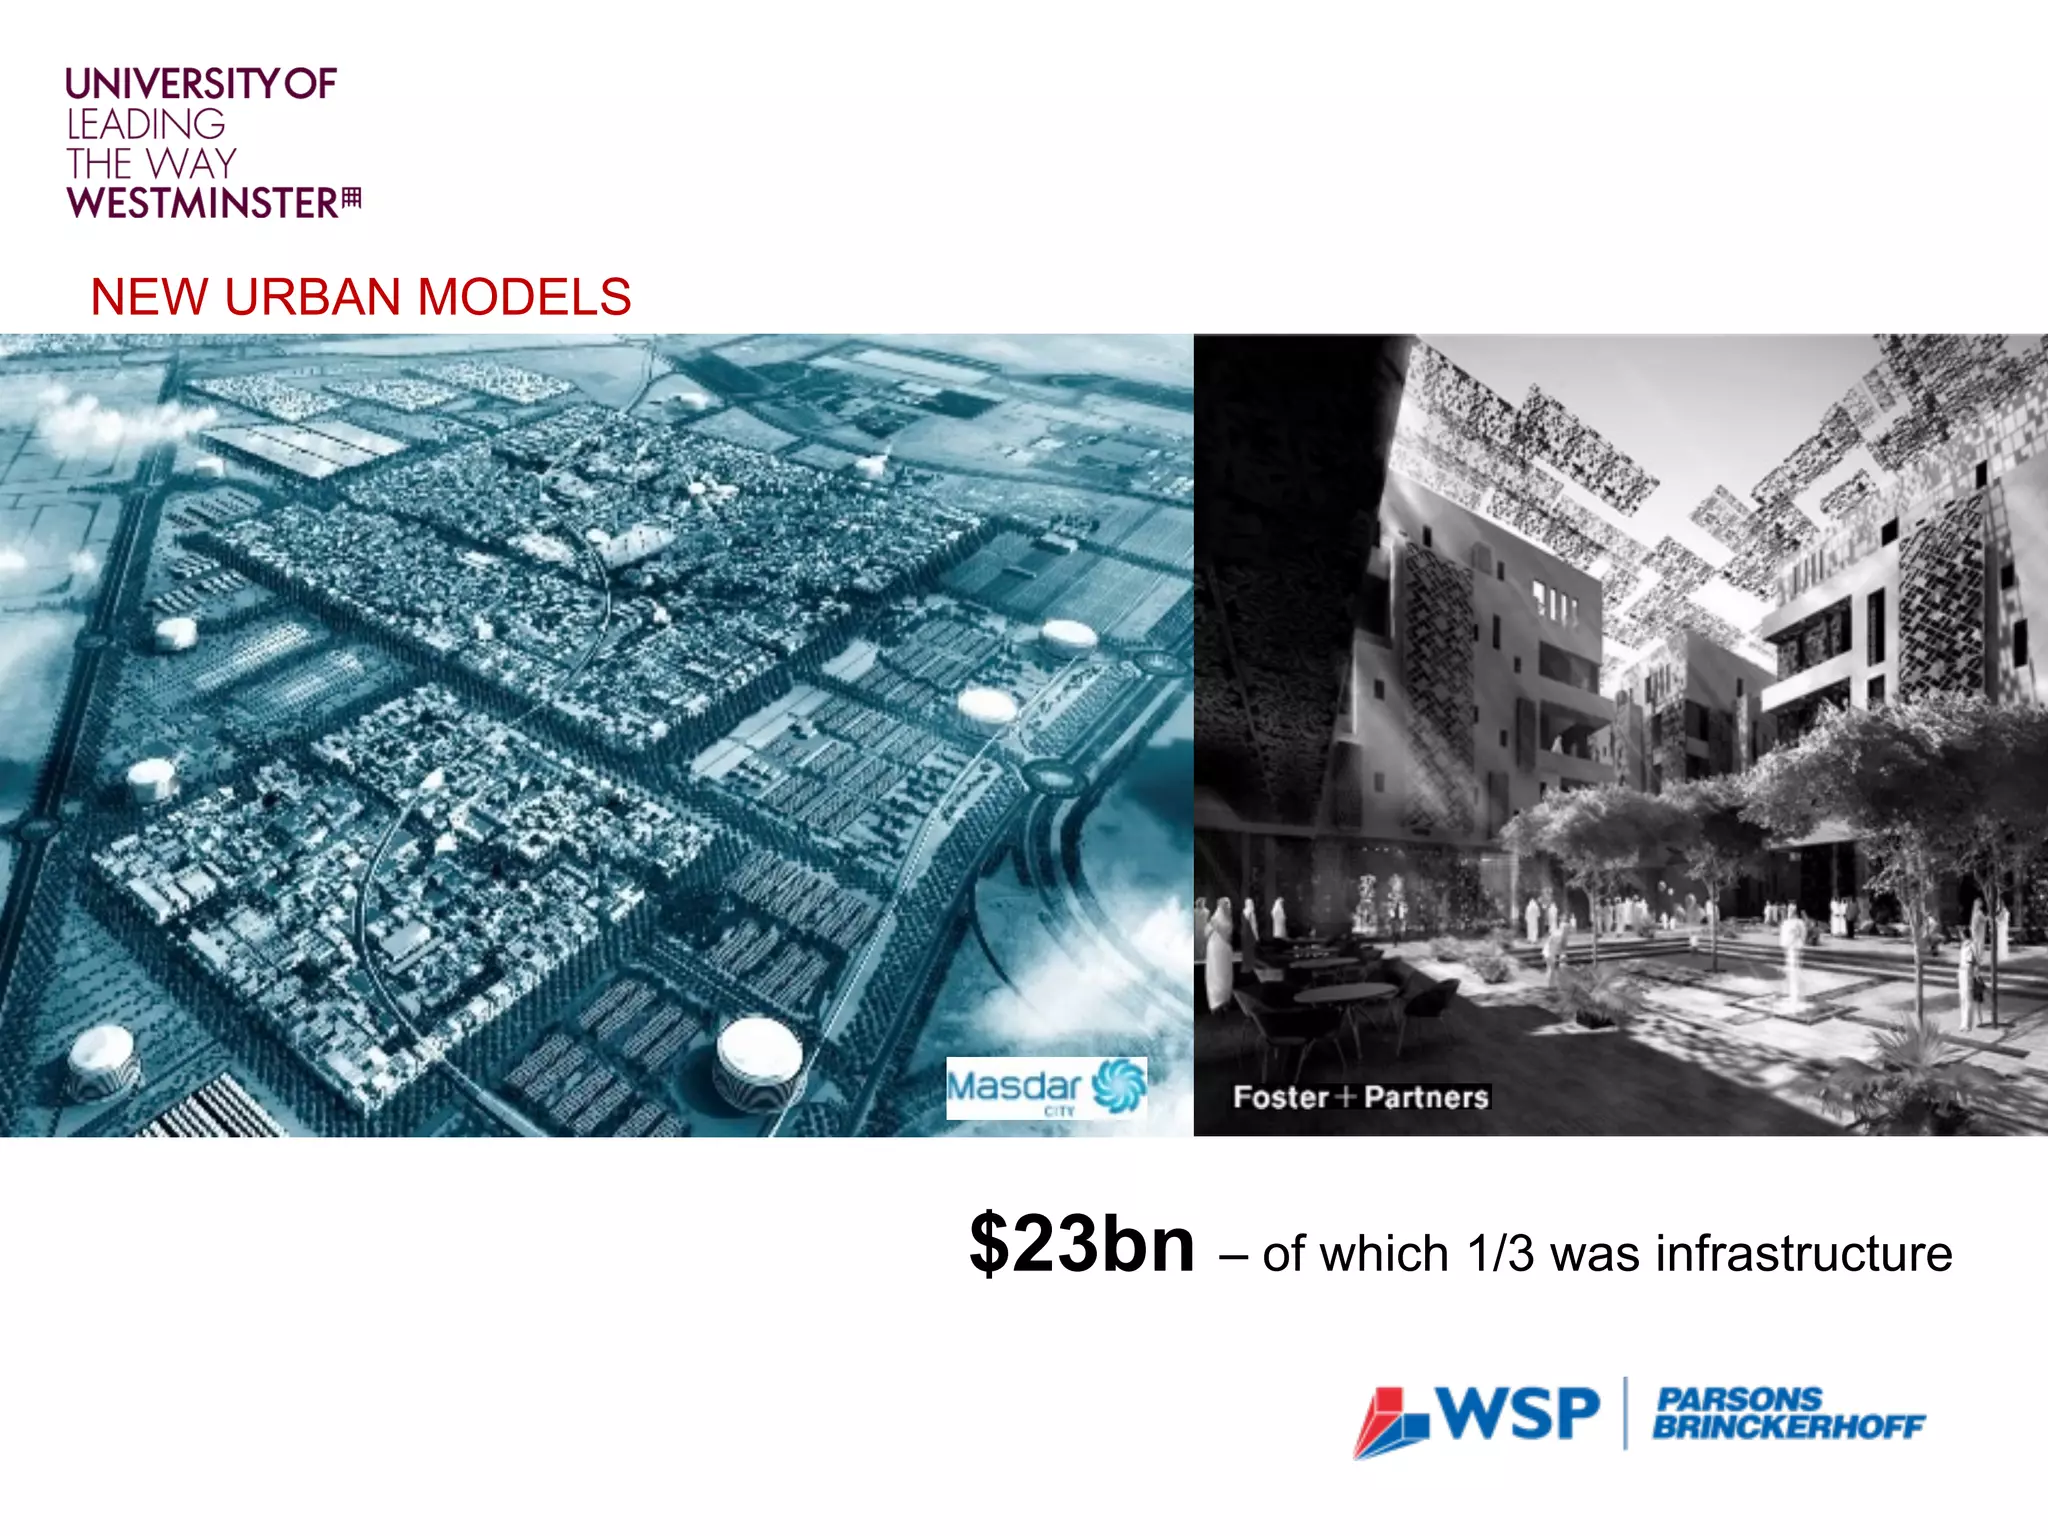
The document discusses the critical role of city regions in the global economy, emphasizing their contribution to GDP and projected infrastructure spending of over $40 trillion to support urban growth. It outlines the challenges faced by cities, including resource constraints and social equity issues, while highlighting the importance of innovative financing models for infrastructure projects. Additionally, it calls for increased engagement with decision-makers regarding infrastructure's role in economic competitiveness and the need to attract new talent to the industry.