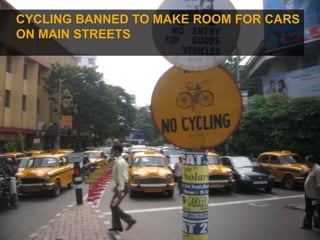
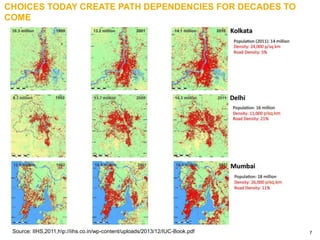
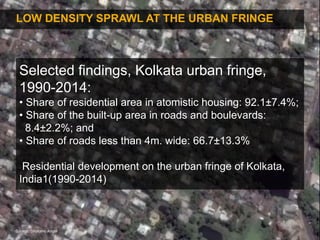
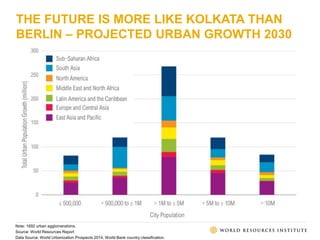
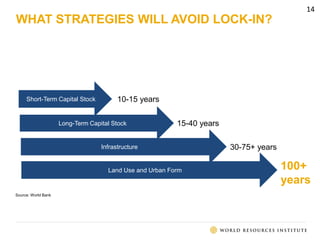
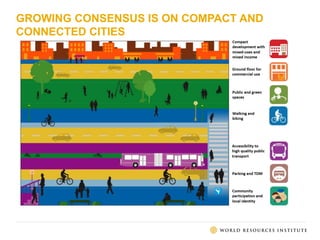
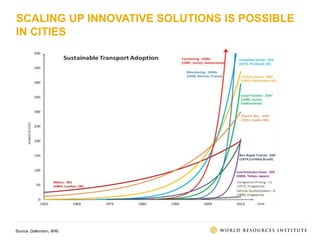
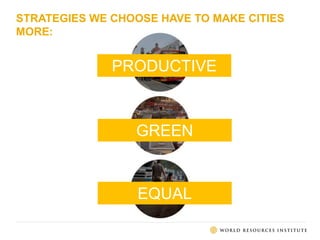
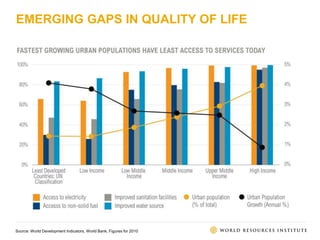
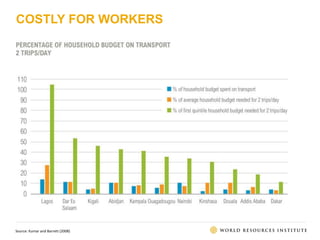
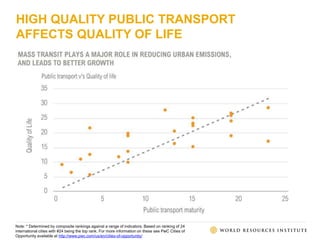
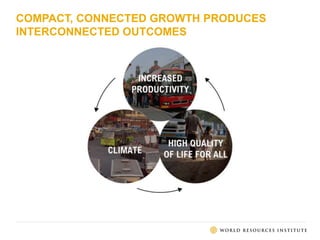
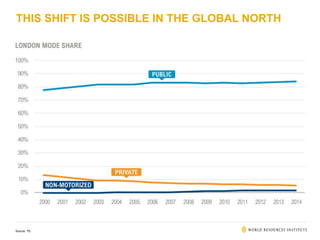
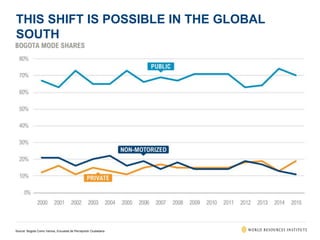
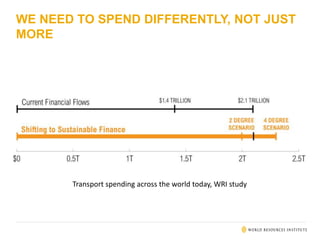
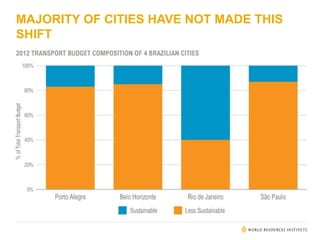
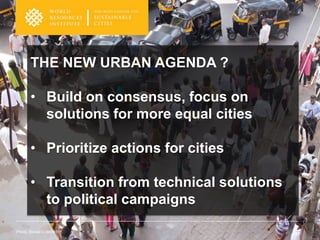
TRANSFORMATIVE
SOLUTIONS:
CITIES FOR PEOPLE
PHOTO: JESS KRAFT/SHUTTERSTOCK
ANI DASGUPTA | GLOBAL DIRECTOR, WRI ROSS CENTER FOR SUSTAINABLE CITIES
May 24, 2016
2
Photo by Stephen Bugno/Flickr.
GDP per capita: $1,110
(2014)
Population : 5.02 million
Poverty Rate: 25%
KOLKATA, INDIA
3
Photo by: VnGrijl/Flickr
KOLKATA HAS BEEN MAKING STREETS WIDER TO
ACCOMMODATE GROWING NUMBER OF CARS
4
Photo by: VnGrijl/Flickr
NARROW SIDEWALKS FORCE PEOPLE ONTO
STREETS, SLOWING TRAFFIC FURTHER
5
CYCLING BANNED TO MAKE ROOM FOR CARS
ON MAIN STREETS
6
Photo by Nicolas Mirguet/Flickr
ONLY 8% PEOPLE IN KOLKATA DRIVE CARS
25% WALK OR CYCLE
7
CHOICES TODAY CREATE PATH DEPENDENCIES FOR DECADES TO
COME
Source: IIHS,2011,hp://iihs.co.in/wp-content/uploads/2013/12/IUC-Book.pdf
8
LOW DENSITY SPRAWL AT THE URBAN FRINGE
Selected findings, Kolkata urban fringe,
1990-2014:
• Share of residential area in atomistic housing: 92.1±7.4%;
• Share of the built-up area in roads and boulevards:
8.4±2.2%; and
• Share of roads less than 4m. wide: 66.7±13.3%
Residential development on the urban fringe of Kolkata,
India1(1990-2014)
Source: Sholomo Angel
THE FUTURE IS MORE LIKE KOLKATA THAN
BERLIN – PROJECTED URBAN GROWTH 2030
Note: 1692 urban agglomerations.
Source: World Resources Report
Data Source: World Urbanization Prospects 2014; World Bank country classification.
(N=769 cities)
WITH GROWTH MOSTLY IN AFRICA AND
SOUTH ASIA 2015-2030
Source: World Resources Report
Data Source: Oxford Economics
CITIES ARE GROWING MOST RAPIDLY IN
LOWER- AND MIDDLE-INCOME COUNTRIES
Note: 1692 urban agglomerations
Source: World Resources Report
Data Sources: World Urbanization Prospects 2014; World Bank country classification
11
COMPARISON OF CITY POPULATION AND BUDGET PER CAPITA IN CITIES
IN GLOBAL SOUTH AND NORTH
Source: World Resources Report
0
2000
4000
6000
8000
10000
12000
14000
16000
City population (1000s) Budget per capita (USD)
HOW WE BUILD CITIES MATTERS
Source: LSE research, drawing on data from Atlanta Regional Commission (2014), Autoritat del Transport
Metropolita (Area de Barcelona) (2013), GenCat (2013), UCSB (2014), D’Onofrio (2014), based on latest data.
Atlanta’s built-up area Barcelona’s built-up area
Population: 5.26 million
Total area: 16,605 km2
Urban area: 7692 km2
Transport emissions: 6.9 tonnes CO2 p.c.
Traffic fatalities: 564 per year
Population: 5 million
Total area: 3263 km2
Urban area: 648 km2
Transport emissions: 1.2 tonnes CO2 p.c.
Traffic fatalities: 31 per year
ATLANTA BARCELONA
WHAT STRATEGIES WILL AVOID LOCK-IN?
Source: World Bank
Short-Term Capital Stock
Long-Term Capital Stock
Infrastructure
Land Use and Urban Form
10-15 years
15-40 years
30-75+ years
100+
years
14
15
SO, HOW DO WE TRANSFORM FROM HERE…
Photo: Mexico City
16
…TO HERE?
Photo: Andreas/Flickr
16
GROWING CONSENSUS IS ON COMPACT AND
CONNECTED CITIES
SCALING UP INNOVATIVE SOLUTIONS IS POSSIBLE
IN CITIES
Source: Dalkmann, WRI
STRATEGIES WE CHOOSE HAVE TO MAKE CITIES
MORE:
PRODUCTIVE
GREEN
EQUAL
ECONOMIC PRODUCTIVITY
Photo: Benoit Colin/WRI
CITIES ARE ENGINES OF GROWTH
AND PROSPERITY
SOURCE: McKinsey Global Institute, Population Division of the United Nations; Angus Maddison via Timetrics;
Global Insight; Census reports of England and Wales; Honda in Steckel & Floud,1997; Bairoch, 1975
65%
global GDP
growth in
major cities
TRAFFIC CONGESTION HURTS PRODUCTIVITY
Sources: IBM Institute for Business Value, Smarter cities for smarter growth. Li-Zeng Mao, Hong-Ge Zhu,
and Li-Ren Duan (2012) The Social Cost of Traffic Congestion and Countermeasures in Beijing.
Sustainable Transportation Systems: pp. 68-76.
HIGH QUALITY PUBLIC TRANSPORT
AFFECTS CITY COMPETIVENESS
Note: * Determined by composite rankings against a range of indicators. Based on ranking of 24
international cities with #24 being the top rank. For more information on these see PwC Cities of
Opportunity available at http://www.pwc.com/us/en/cities-of-opportunity/
HIGH QUALITY PUBLIC TRANSPORT
AFFECTS CITY PRODUCTIVITY
Note: * Determined by composite rankings against a range of indicators. Based on ranking of 24
international cities with #24 being the top rank. For more information on these see PwC Cities of
Opportunity available at http://www.pwc.com/us/en/cities-of-opportunity/
CLIMATE AND ENVIRONMENT
Photo: Benoit Colin/WRI
26
Photo: Flickr/PauloFehlauer; Sources: UN-Habitat, UNFCCC, WHO
23% of global GHG
emissions are from transport
GLOBAL CLIMATE CHANGE TARGETS ARE NOT
POSSIBLE WITHOUT THE TRANSFORMATION OF
CITIES
26
70% of GHG emissions
come from cities
TRANSPORT AND BUILDINGS PROVIDE KEY
OPPORTUNITIES
Photo: Jacek/Flickr Source: IPCC
28
Total stock of motor cars, projections up to 2050
TRACKER
Total number of cars in thousands
1 Footnote
SOURCE: Fulton/IEA 2008
In1,000
CLIMATE GOALS CANNOT BE REACHED ON THE
CURRENT TREND TOWARD MOTORIZATION
Hidalgo and Duduta (2013)
60% OF THE 2030 GLOBAL BUILDING
STOCK IS YET TO BE BUILT
Source: NASA Image. UN World Population Prospects. 2009. UNFCCC
A MORE EQUAL CITY:
HIGH QUALITY OF LIFE FOR ALL
Photo: Benoit Colin/WRI
RISE OF MOTORIZATION RESULTS IN
UNHEALTHY, UNSAFE CITIES
• 1.3MM deaths globally from
traffic incidents
• 90% of the world’s road
traffic deaths occur in low-
and middle-income
countries
• Air pollution linked to 6.7% of
deaths worldwide
Source: WHO
NONE OF THE WORLD’S TOP 50 CITIES BY
POPULATION MEET WHO AIR QUALITY STANDARDS
SOURCE: Mortality data from World Health Organisation:
http://apps.who.int/gho/data/node.wrapper.ENVHEALTH3
INFORMAL SETTLEMENTS ARE GROWING
Source: UN (2014). *CAR: Central African republic, STP: Sao Tome and Principe, DRC:
Democratic Republic of Congo, Non-SSA (av) average in rest of the countries.
CITIES ARE DISCONNECTED
Source: UNEP and FIA Foundation 2013
Most people must walk to work
EMERGING GAPS IN QUALITY OF LIFE
Source: World Development Indicators, World Bank, Figures for 2010
COSTLY FOR WORKERS
Source: Kumar and Barrett (2008)
HIGH QUALITY PUBLIC TRANSPORT
AFFECTS QUALITY OF LIFE
Note: * Determined by composite rankings against a range of indicators. Based on ranking of 24
international cities with #24 being the top rank. For more information on these see PwC Cities of
Opportunity available at http://www.pwc.com/us/en/cities-of-opportunity/
COMPACT, CONNECTED GROWTH PRODUCES
INTERCONNECTED OUTCOMES
THIS SHIFT IS POSSIBLE IN THE GLOBAL NORTH
Source: TfL
THIS SHIFT IS POSSIBLE IN THE GLOBAL
SOUTH
Source: Bogota Como Vamos, Encuesta de Percepción Ciudadana
WE NEED TO SPEND DIFFERENTLY, NOT JUST
MORE
Transport spending across the world today, WRI study
MAJORITY OF CITIES HAVE NOT MADE THIS
SHIFT
THE NEW URBAN AGENDA ?
• Build on consensus, focus on
solutions for more equal cities
• Prioritize actions for cities
• Transition from technical solutions
to political campaigns
Photo: Benoit Colin/WRI

Transformative Solutions: Cities for People

  • 1.
    TRANSFORMATIVE SOLUTIONS: CITIES FOR PEOPLE PHOTO:JESS KRAFT/SHUTTERSTOCK ANI DASGUPTA | GLOBAL DIRECTOR, WRI ROSS CENTER FOR SUSTAINABLE CITIES May 24, 2016
  • 2.
    2 Photo by StephenBugno/Flickr. GDP per capita: $1,110 (2014) Population : 5.02 million Poverty Rate: 25% KOLKATA, INDIA
  • 3.
    3 Photo by: VnGrijl/Flickr KOLKATAHAS BEEN MAKING STREETS WIDER TO ACCOMMODATE GROWING NUMBER OF CARS
  • 4.
    4 Photo by: VnGrijl/Flickr NARROWSIDEWALKS FORCE PEOPLE ONTO STREETS, SLOWING TRAFFIC FURTHER
  • 5.
    5 CYCLING BANNED TOMAKE ROOM FOR CARS ON MAIN STREETS
  • 6.
    6 Photo by NicolasMirguet/Flickr ONLY 8% PEOPLE IN KOLKATA DRIVE CARS 25% WALK OR CYCLE
  • 7.
    7 CHOICES TODAY CREATEPATH DEPENDENCIES FOR DECADES TO COME Source: IIHS,2011,hp://iihs.co.in/wp-content/uploads/2013/12/IUC-Book.pdf
  • 8.
    8 LOW DENSITY SPRAWLAT THE URBAN FRINGE Selected findings, Kolkata urban fringe, 1990-2014: • Share of residential area in atomistic housing: 92.1±7.4%; • Share of the built-up area in roads and boulevards: 8.4±2.2%; and • Share of roads less than 4m. wide: 66.7±13.3% Residential development on the urban fringe of Kolkata, India1(1990-2014) Source: Sholomo Angel
  • 9.
    THE FUTURE ISMORE LIKE KOLKATA THAN BERLIN – PROJECTED URBAN GROWTH 2030 Note: 1692 urban agglomerations. Source: World Resources Report Data Source: World Urbanization Prospects 2014; World Bank country classification.
  • 10.
    (N=769 cities) WITH GROWTHMOSTLY IN AFRICA AND SOUTH ASIA 2015-2030 Source: World Resources Report Data Source: Oxford Economics
  • 11.
    CITIES ARE GROWINGMOST RAPIDLY IN LOWER- AND MIDDLE-INCOME COUNTRIES Note: 1692 urban agglomerations Source: World Resources Report Data Sources: World Urbanization Prospects 2014; World Bank country classification 11
  • 12.
    COMPARISON OF CITYPOPULATION AND BUDGET PER CAPITA IN CITIES IN GLOBAL SOUTH AND NORTH Source: World Resources Report 0 2000 4000 6000 8000 10000 12000 14000 16000 City population (1000s) Budget per capita (USD)
  • 13.
    HOW WE BUILDCITIES MATTERS Source: LSE research, drawing on data from Atlanta Regional Commission (2014), Autoritat del Transport Metropolita (Area de Barcelona) (2013), GenCat (2013), UCSB (2014), D’Onofrio (2014), based on latest data. Atlanta’s built-up area Barcelona’s built-up area Population: 5.26 million Total area: 16,605 km2 Urban area: 7692 km2 Transport emissions: 6.9 tonnes CO2 p.c. Traffic fatalities: 564 per year Population: 5 million Total area: 3263 km2 Urban area: 648 km2 Transport emissions: 1.2 tonnes CO2 p.c. Traffic fatalities: 31 per year ATLANTA BARCELONA
  • 14.
    WHAT STRATEGIES WILLAVOID LOCK-IN? Source: World Bank Short-Term Capital Stock Long-Term Capital Stock Infrastructure Land Use and Urban Form 10-15 years 15-40 years 30-75+ years 100+ years 14
  • 15.
    15 SO, HOW DOWE TRANSFORM FROM HERE… Photo: Mexico City
  • 16.
  • 17.
    GROWING CONSENSUS ISON COMPACT AND CONNECTED CITIES
  • 18.
    SCALING UP INNOVATIVESOLUTIONS IS POSSIBLE IN CITIES Source: Dalkmann, WRI
  • 19.
    STRATEGIES WE CHOOSEHAVE TO MAKE CITIES MORE: PRODUCTIVE GREEN EQUAL
  • 20.
  • 21.
    CITIES ARE ENGINESOF GROWTH AND PROSPERITY SOURCE: McKinsey Global Institute, Population Division of the United Nations; Angus Maddison via Timetrics; Global Insight; Census reports of England and Wales; Honda in Steckel & Floud,1997; Bairoch, 1975 65% global GDP growth in major cities
  • 22.
    TRAFFIC CONGESTION HURTSPRODUCTIVITY Sources: IBM Institute for Business Value, Smarter cities for smarter growth. Li-Zeng Mao, Hong-Ge Zhu, and Li-Ren Duan (2012) The Social Cost of Traffic Congestion and Countermeasures in Beijing. Sustainable Transportation Systems: pp. 68-76.
  • 23.
    HIGH QUALITY PUBLICTRANSPORT AFFECTS CITY COMPETIVENESS Note: * Determined by composite rankings against a range of indicators. Based on ranking of 24 international cities with #24 being the top rank. For more information on these see PwC Cities of Opportunity available at http://www.pwc.com/us/en/cities-of-opportunity/
  • 24.
    HIGH QUALITY PUBLICTRANSPORT AFFECTS CITY PRODUCTIVITY Note: * Determined by composite rankings against a range of indicators. Based on ranking of 24 international cities with #24 being the top rank. For more information on these see PwC Cities of Opportunity available at http://www.pwc.com/us/en/cities-of-opportunity/
  • 25.
  • 26.
    26 Photo: Flickr/PauloFehlauer; Sources:UN-Habitat, UNFCCC, WHO 23% of global GHG emissions are from transport GLOBAL CLIMATE CHANGE TARGETS ARE NOT POSSIBLE WITHOUT THE TRANSFORMATION OF CITIES 26 70% of GHG emissions come from cities
  • 27.
    TRANSPORT AND BUILDINGSPROVIDE KEY OPPORTUNITIES Photo: Jacek/Flickr Source: IPCC
  • 28.
    28 Total stock ofmotor cars, projections up to 2050 TRACKER Total number of cars in thousands 1 Footnote SOURCE: Fulton/IEA 2008 In1,000
  • 29.
    CLIMATE GOALS CANNOTBE REACHED ON THE CURRENT TREND TOWARD MOTORIZATION Hidalgo and Duduta (2013)
  • 30.
    60% OF THE2030 GLOBAL BUILDING STOCK IS YET TO BE BUILT Source: NASA Image. UN World Population Prospects. 2009. UNFCCC
  • 31.
    A MORE EQUALCITY: HIGH QUALITY OF LIFE FOR ALL Photo: Benoit Colin/WRI
  • 32.
    RISE OF MOTORIZATIONRESULTS IN UNHEALTHY, UNSAFE CITIES • 1.3MM deaths globally from traffic incidents • 90% of the world’s road traffic deaths occur in low- and middle-income countries • Air pollution linked to 6.7% of deaths worldwide Source: WHO
  • 33.
    NONE OF THEWORLD’S TOP 50 CITIES BY POPULATION MEET WHO AIR QUALITY STANDARDS SOURCE: Mortality data from World Health Organisation: http://apps.who.int/gho/data/node.wrapper.ENVHEALTH3
  • 34.
    INFORMAL SETTLEMENTS AREGROWING Source: UN (2014). *CAR: Central African republic, STP: Sao Tome and Principe, DRC: Democratic Republic of Congo, Non-SSA (av) average in rest of the countries.
  • 35.
    CITIES ARE DISCONNECTED Source:UNEP and FIA Foundation 2013 Most people must walk to work
  • 36.
    EMERGING GAPS INQUALITY OF LIFE Source: World Development Indicators, World Bank, Figures for 2010
  • 37.
    COSTLY FOR WORKERS Source:Kumar and Barrett (2008)
  • 38.
    HIGH QUALITY PUBLICTRANSPORT AFFECTS QUALITY OF LIFE Note: * Determined by composite rankings against a range of indicators. Based on ranking of 24 international cities with #24 being the top rank. For more information on these see PwC Cities of Opportunity available at http://www.pwc.com/us/en/cities-of-opportunity/
  • 39.
    COMPACT, CONNECTED GROWTHPRODUCES INTERCONNECTED OUTCOMES
  • 40.
    THIS SHIFT ISPOSSIBLE IN THE GLOBAL NORTH Source: TfL
  • 41.
    THIS SHIFT ISPOSSIBLE IN THE GLOBAL SOUTH Source: Bogota Como Vamos, Encuesta de Percepción Ciudadana
  • 42.
    WE NEED TOSPEND DIFFERENTLY, NOT JUST MORE Transport spending across the world today, WRI study
  • 43.
    MAJORITY OF CITIESHAVE NOT MADE THIS SHIFT
  • 44.
    THE NEW URBANAGENDA ? • Build on consensus, focus on solutions for more equal cities • Prioritize actions for cities • Transition from technical solutions to political campaigns Photo: Benoit Colin/WRI