Download as PDF, PPTX

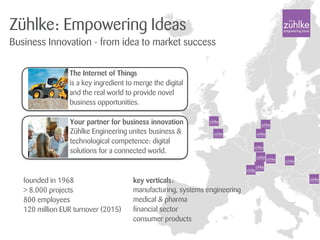
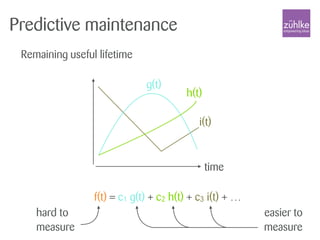
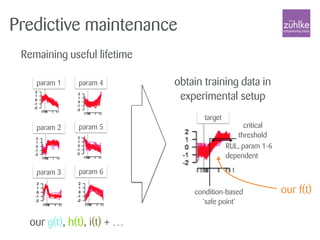
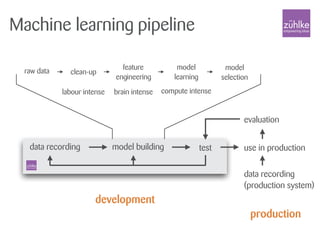
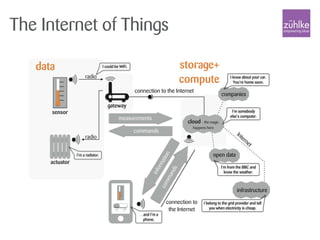
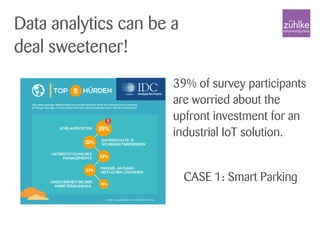
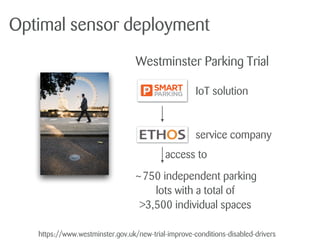
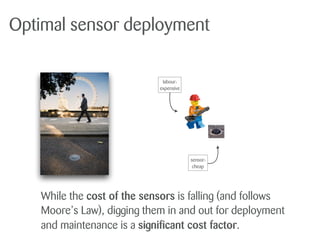
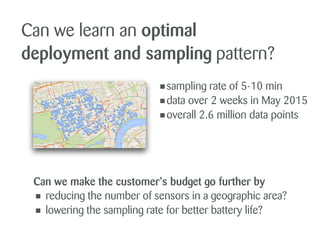

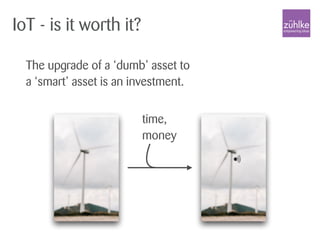
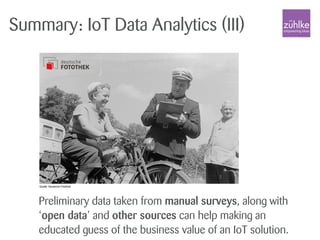

Dr. Boris Adryan discusses the potential of the Internet of Things (IoT) beyond predictive maintenance, highlighting its impact on business innovation through data analytics in various sectors. The presentation covers case studies such as smart parking and asset tracking, emphasizing the economic benefits of optimizing sensor deployment and improving maintenance strategies. Key insights reveal that while IoT data analytics can significantly enhance operational efficiency, upfront investment remains a concern for many businesses.

![[Research] deploying predictive models with the actor framework - Brian Gawalt](https://cdn.slidesharecdn.com/ss_thumbnails/researchdeployingpredictivemodelswiththeactorframework-briangawalt-150820102337-lva1-app6892-thumbnail.jpg?width=640&height=640&fit=bounds)


![[Tutorial] building machine learning models for predictive maintenance applic...](https://cdn.slidesharecdn.com/ss_thumbnails/tutorialbuildingmachinelearningmodelsforpredictivemaintenanceapplications-yanzhang-150820102412-lva1-app6891-thumbnail.jpg?width=640&height=640&fit=bounds)


