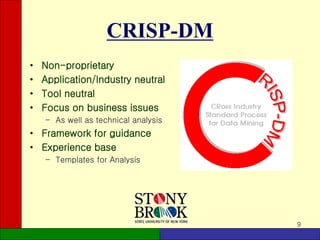
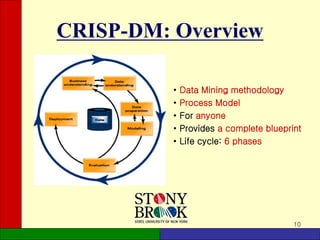
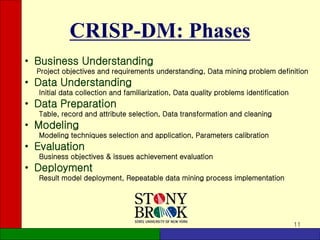
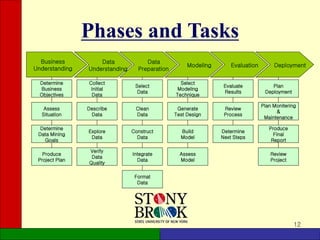
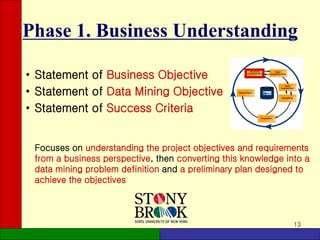
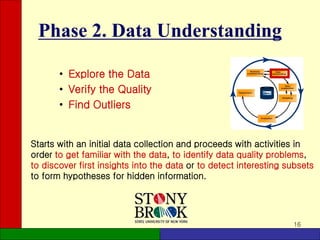
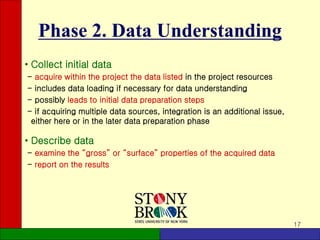
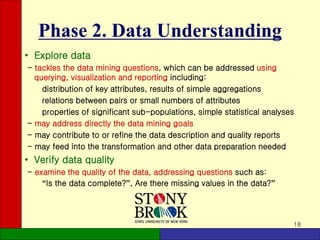
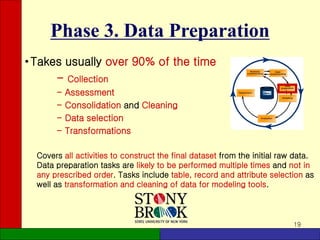
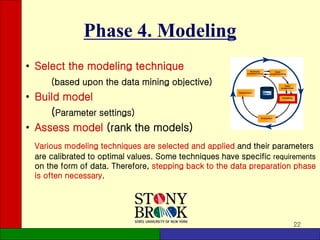
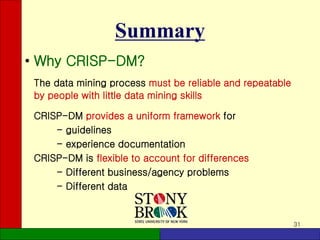
The document provides an overview of the CRISP-DM (Cross-Industry Standard Process for Data Mining) methodology. It describes CRISP-DM as a standard process for data mining projects that consists of 6 phases: business understanding, data understanding, data preparation, modeling, evaluation, and deployment. Each phase has defined tasks to guide users through a complete data mining process from start to finish. The document outlines the objectives and key activities in each phase to give readers a high-level understanding of the CRISP-DM methodology.
Jiawei Han, Micheline Kamber and Jian Pei
Data Mining: Concepts and Techniques, 3rd ed.
The Morgan Kaufmann Series in Data Management Systems
Morgan Kaufmann Publishers, July 2011. ISBN 978-0123814791
Jiawei Han, Micheline Kamber and Jian Pei
Data Mining: Concepts and Techniques, 3rd ed.
The Morgan Kaufmann Series in Data Management Systems
Morgan Kaufmann Publishers, July 2011. ISBN 978-0123814791
This slide deck gives a general overview of Data Visualization, with inspiring examples, the strength and weaknesses of the human visual system, a few technical frameworks that may be used for creating your own visualizations and some design concepts from the data visualization field.
Slides used for a presentation to introduce the field of business analytics. Covers what BA is, how it is a part of business intelligence, and what areas make up BA.
This presentation briefly discusses about the following topics:
Data Analytics Lifecycle
Importance of Data Analytics Lifecycle
Phase 1: Discovery
Phase 2: Data Preparation
Phase 3: Model Planning
Phase 4: Model Building
Phase 5: Communication Results
Phase 6: Operationalize
Data Analytics Lifecycle Example
Big Data, Data Science, Machine learning creating tremendous value in the education sector. Combination of open source with IBM value adds create compelling value. Artificial intelligence will revolutionize the sector with making education more relevant with Cognitive capabilities of students.
Data visualization in data science: exploratory EDA, explanatory. Anscobe's quartet, design principles, visual encoding, design engineering and journalism, choosing the right graph, narrative structures, technology and tools.
A deep dive in data visualization covering some handful tools like Advance excel, Tableau, Qliksense etc.
You can add more content like discussing Google API, Perception and cognition theory,some more readable formats for data visualization and its framework.
In this lecture we analyze document oriented databases. In particular we consider why there are the first approach to nosql and what are the main features. Then, we analyze as example MongoDB. We consider the data model, CRUD operations, write concerns, scaling (replication and sharding).
Finally we presents other document oriented database and when to use or not document oriented databases.
DATA SCIENCE AND BIG DATA ANALYTICSCHAPTER 2 DATA ANA.docxrandyburney60861
DATA SCIENCE AND BIG DATA
ANALYTICS
CHAPTER 2:
DATA ANALYTICS LIFECYCLE
• Data science projects differ from BI projects
• More exploratory in nature
• Critical to have a project process
• Participants should be thorough and rigorous
• Break large projects into smaller pieces
• Spend time to plan and scope the work
• Documenting adds rigor and credibility
DATA ANALYTICS LIFECYCLE
• Data Analytics Lifecycle Overview
• Phase 1: Discovery
• Phase 2: Data Preparation
• Phase 3: Model Planning
• Phase 4: Model Building
• Phase 5: Communicate Results
• Phase 6: Operationalize
• Case Study: GINA
2.1 DATA ANALYTICS
LIFECYCLE OVERVIEW
• The data analytic lifecycle is designed for Big Data problems and
data science projects
• With six phases the project work can occur in several phases
simultaneously
• The cycle is iterative to portray a real project
• Work can return to earlier phases as new information is uncovered
2.1.1 KEY ROLES FOR A
SUCCESSFUL ANALYTICS
PROJECT
KEY ROLES FOR A
SUCCESSFUL ANALYTICS
PROJECT
• Business User – understands the domain area
• Project Sponsor – provides requirements
• Project Manager – ensures meeting objectives
• Business Intelligence Analyst – provides business domain
expertise based on deep understanding of the data
• Database Administrator (DBA) – creates DB environment
• Data Engineer – provides technical skills, assists data
management and extraction, supports analytic sandbox
• Data Scientist – provides analytic techniques and modeling
2.1.2 BACKGROUND AND OVERVIEW
OF DATA ANALYTICS LIFECYCLE
• Data Analytics Lifecycle defines the analytics process and
best practices from discovery to project completion
• The Lifecycle employs aspects of
• Scientific method
• Cross Industry Standard Process for Data Mining (CRISP-DM)
• Process model for data mining
• Davenport’s DELTA framework
• Hubbard’s Applied Information Economics (AIE) approach
• MAD Skills: New Analysis Practices for Big Data by Cohen et al.
https://en.wikipedia.org/wiki/Scientific_method
https://en.wikipedia.org/wiki/Cross_Industry_Standard_Process_for_Data_Mining
http://www.informationweek.com/software/information-management/analytics-at-work-qanda-with-tom-davenport/d/d-id/1085869?
https://en.wikipedia.org/wiki/Applied_information_economics
https://pafnuty.wordpress.com/2013/03/15/reading-log-mad-skills-new-analysis-practices-for-big-data-cohen/
OVERVIEW OF
DATA ANALYTICS LIFECYCLE
2.2 PHASE 1: DISCOVERY
1. Learning the Business Domain
2. Resources
3. Framing the Problem
4. Identifying Key Stakeholders
5. Interviewing the Analytics Sponsor
6. Developing Initial Hypotheses
7. Identifying Potential Data Sources
2.3 PHASE 2: DATA PREPARATION
2.3 PHASE 2: DATA
PREPARATION
• Includes steps to explore, preprocess, and condition
data
• Create robust environment – analytics sandbox
• Data preparation tends to be t.
Building a mind map for test data management.
Overview
1. Test data source
2. Extract or create data
3. Transform data
4. Provision
5. Target
Source: http://debasishbhadra.blogspot.com/2013/12/create-your-own-mindmap-for-test-data.html
Saksham Sarode - Building Effective test Data Management in Distributed Envir...TEST Huddle
EuroSTAR Software Testing Conference 2010 presentation on Building Effective test Data Management in Distributed Environment by Saksham Sarode. See more at: http://conference.eurostarsoftwaretesting.com/past-presentations/
Explore our comprehensive data analysis project presentation on predicting product ad campaign performance. Learn how data-driven insights can optimize your marketing strategies and enhance campaign effectiveness. Perfect for professionals and students looking to understand the power of data analysis in advertising. for more details visit: https://bostoninstituteofanalytics.org/data-science-and-artificial-intelligence/
Show drafts
volume_up
Empowering the Data Analytics Ecosystem: A Laser Focus on Value
The data analytics ecosystem thrives when every component functions at its peak, unlocking the true potential of data. Here's a laser focus on key areas for an empowered ecosystem:
1. Democratize Access, Not Data:
Granular Access Controls: Provide users with self-service tools tailored to their specific needs, preventing data overload and misuse.
Data Catalogs: Implement robust data catalogs for easy discovery and understanding of available data sources.
2. Foster Collaboration with Clear Roles:
Data Mesh Architecture: Break down data silos by creating a distributed data ownership model with clear ownership and responsibilities.
Collaborative Workspaces: Utilize interactive platforms where data scientists, analysts, and domain experts can work seamlessly together.
3. Leverage Advanced Analytics Strategically:
AI-powered Automation: Automate repetitive tasks like data cleaning and feature engineering, freeing up data talent for higher-level analysis.
Right-Tool Selection: Strategically choose the most effective advanced analytics techniques (e.g., AI, ML) based on specific business problems.
4. Prioritize Data Quality with Automation:
Automated Data Validation: Implement automated data quality checks to identify and rectify errors at the source, minimizing downstream issues.
Data Lineage Tracking: Track the flow of data throughout the ecosystem, ensuring transparency and facilitating root cause analysis for errors.
5. Cultivate a Data-Driven Mindset:
Metrics-Driven Performance Management: Align KPIs and performance metrics with data-driven insights to ensure actionable decision making.
Data Storytelling Workshops: Equip stakeholders with the skills to translate complex data findings into compelling narratives that drive action.
Benefits of a Precise Ecosystem:
Sharpened Focus: Precise access and clear roles ensure everyone works with the most relevant data, maximizing efficiency.
Actionable Insights: Strategic analytics and automated quality checks lead to more reliable and actionable data insights.
Continuous Improvement: Data-driven performance management fosters a culture of learning and continuous improvement.
Sustainable Growth: Empowered by data, organizations can make informed decisions to drive sustainable growth and innovation.
By focusing on these precise actions, organizations can create an empowered data analytics ecosystem that delivers real value by driving data-driven decisions and maximizing the return on their data investment.
Chatty Kathy - UNC Bootcamp Final Project Presentation - Final Version - 5.23...John Andrews
SlideShare Description for "Chatty Kathy - UNC Bootcamp Final Project Presentation"
Title: Chatty Kathy: Enhancing Physical Activity Among Older Adults
Description:
Discover how Chatty Kathy, an innovative project developed at the UNC Bootcamp, aims to tackle the challenge of low physical activity among older adults. Our AI-driven solution uses peer interaction to boost and sustain exercise levels, significantly improving health outcomes. This presentation covers our problem statement, the rationale behind Chatty Kathy, synthetic data and persona creation, model performance metrics, a visual demonstration of the project, and potential future developments. Join us for an insightful Q&A session to explore the potential of this groundbreaking project.
Project Team: Jay Requarth, Jana Avery, John Andrews, Dr. Dick Davis II, Nee Buntoum, Nam Yeongjin & Mat Nicholas
Techniques to optimize the pagerank algorithm usually fall in two categories. One is to try reducing the work per iteration, and the other is to try reducing the number of iterations. These goals are often at odds with one another. Skipping computation on vertices which have already converged has the potential to save iteration time. Skipping in-identical vertices, with the same in-links, helps reduce duplicate computations and thus could help reduce iteration time. Road networks often have chains which can be short-circuited before pagerank computation to improve performance. Final ranks of chain nodes can be easily calculated. This could reduce both the iteration time, and the number of iterations. If a graph has no dangling nodes, pagerank of each strongly connected component can be computed in topological order. This could help reduce the iteration time, no. of iterations, and also enable multi-iteration concurrency in pagerank computation. The combination of all of the above methods is the STICD algorithm. [sticd] For dynamic graphs, unchanged components whose ranks are unaffected can be skipped altogether.
2. 2
References
• Pete Chapman (NCR), Julian Clinton (SPSS), Randy Kerber (NCR),
Thomas Khabaza (SPSS), Thomas Reinartz, (DaimlerChrysler), Colin
Shearer (SPSS) and Rüdiger Wirth (DaimlerChrysler) “CRISP-DM 1.0 -
Step-by-step data mining guide”
• P. Gonzalez-Aranda, E.Menasalvas, S.Millan, F. Segovia “Towards a
Methodology for Data Mining Project Development: The Importance of
Abstraction”
• Laura Squier “What is Data Mining?” PPT
• “The CRISP-DM Model: The New Blueprint for DataMining”, Colin
Shearer, JOURNAL of Data Warehousing, Volume 5, Number 4,
p. 13-22, 2000
6. 6
Why Should There be a Standard Process?
The data mining process must be reliable and
repeatable by people with little data mining
background.
7. 7
Why Should There be a Standard Process?
• Framework for recording experience
– Allows projects to be replicated
• Aid to project planning and management
• “Comfort factor” for new adopters
– Demonstrates maturity of Data Mining
– Reduces dependency on “stars”
8. 8
Process Standardization
• Initiative launched in late 1996 by three “veterans” of data mining market.
Daimler Chrysler (then Daimler-Benz), SPSS (then ISL) , NCR
• Developed and refined through series of workshops (from 1997-1999)
• Over 300 organization contributed to the process model
• Published CRISP-DM 1.0 (1999)
• Over 200 members of the CRISP-DM SIG worldwide
- DM Vendors - SPSS, NCR, IBM, SAS, SGI, Data Distilleries, Syllogic, etc.
- System Suppliers / consultants - Cap Gemini, ICL Retail, Deloitte & Touche, etc.
- End Users - BT, ABB, Lloyds Bank, AirTouch, Experian, etc.
10. 10
CRISP-DM: Overview
• Data Mining methodology
• Process Model
• For anyone
• Provides a complete blueprint
• Life cycle: 6 phases
11. 11
CRISP-DM: Phases
• Business Understanding
Project objectives and requirements understanding, Data mining problem definition
• Data Understanding
Initial data collection and familiarization, Data quality problems identification
• Data Preparation
Table, record and attribute selection, Data transformation and cleaning
• Modeling
Modeling techniques selection and application, Parameters calibration
• Evaluation
Business objectives & issues achievement evaluation
• Deployment
Result model deployment, Repeatable data mining process implementation
12. 12
Phases and Tasks
Business
Understanding
Data
Understanding
Data
Preparation
Modeling Deployment
Evaluation
Format
Data
Integrate
Data
Construct
Data
Clean
Data
Select
Data
Determine
Business
Objectives
Review
Project
Produce
Final
Report
Plan Monitering
&
Maintenance
Plan
Deployment
Determine
Next Steps
Review
Process
Evaluate
Results
Assess
Model
Build
Model
Generate
Test Design
Select
Modeling
Technique
Assess
Situation
Explore
Data
Describe
Data
Collect
Initial
Data
Determine
Data Mining
Goals
Verify
Data
Quality
Produce
Project Plan
13. 13
Phase 1. Business Understanding
• Statement of Business Objective
• Statement of Data Mining Objective
• Statement of Success Criteria
Focuses on understanding the project objectives and requirements
from a business perspective, then converting this knowledge into a
data mining problem definition and a preliminary plan designed to
achieve the objectives
14. 14
Phase 1. Business Understanding
• Determine business objectives
- thoroughly understand, from a business perspective, what the client
really wants to accomplish
- uncover important factors, at the beginning, that can influence the
outcome of the project
- neglecting this step is to expend a great deal of effort producing the
right answers to the wrong questions
• Assess situation
- more detailed fact-finding about all of the resources, constraints,
assumptions and other factors that should be considered
- flesh out the details
15. 15
Phase 1. Business Understanding
• Determine data mining goals
- a business goal states objectives in business terminology
- a data mining goal states project objectives in technical terms
ex) the business goal: “Increase catalog sales to existing customers.”
a data mining goal: “Predict how many widgets a customer will buy,
given their purchases over the past three years,
demographic information (age, salary, city) and
the price of the item.”
• Produce project plan
- describe the intended plan for achieving the data mining goals and the
business goals
- the plan should specify the anticipated set of steps to be performed
during the rest of the project including an initial selection of tools and
techniques
16. 16
Phase 2. Data Understanding
• Explore the Data
• Verify the Quality
• Find Outliers
Starts with an initial data collection and proceeds with activities in
order to get familiar with the data, to identify data quality problems,
to discover first insights into the data or to detect interesting subsets
to form hypotheses for hidden information.
17. 17
Phase 2. Data Understanding
• Collect initial data
- acquire within the project the data listed in the project resources
- includes data loading if necessary for data understanding
- possibly leads to initial data preparation steps
- if acquiring multiple data sources, integration is an additional issue,
either here or in the later data preparation phase
• Describe data
- examine the “gross” or “surface” properties of the acquired data
- report on the results
18. 18
Phase 2. Data Understanding
• Explore data
- tackles the data mining questions, which can be addressed using
querying, visualization and reporting including:
distribution of key attributes, results of simple aggregations
relations between pairs or small numbers of attributes
properties of significant sub-populations, simple statistical analyses
- may address directly the data mining goals
- may contribute to or refine the data description and quality reports
- may feed into the transformation and other data preparation needed
• Verify data quality
- examine the quality of the data, addressing questions such as:
“Is the data complete?”, Are there missing values in the data?”
19. 19
Phase 3. Data Preparation
•Takes usually over 90% of the time
- Collection
- Assessment
- Consolidation and Cleaning
- Data selection
- Transformations
Covers all activities to construct the final dataset from the initial raw data.
Data preparation tasks are likely to be performed multiple times and not in
any prescribed order. Tasks include table, record and attribute selection as
well as transformation and cleaning of data for modeling tools.
20. 20
Phase 3. Data Preparation
• Select data
- decide on the data to be used for analysis
- criteria include relevance to the data mining goals, quality and technical
constraints such as limits on data volume or data types
- covers selection of attributes as well as selection of records in a table
• Clean data
- raise the data quality to the level required by the selected analysis
techniques
- may involve selection of clean subsets of the data, the insertion of
suitable defaults or more ambitious techniques such as the estimation
of missing data by modeling
21. 21
Phase 3. Data Preparation
• Construct data
- constructive data preparation operations such as the production of
derived attributes, entire new records or transformed values for existing
attributes
• Integrate data
- methods whereby information is combined from multiple tables or
records to create new records or values
• Format data
- formatting transformations refer to primarily syntactic modifications
made to the data that do not change its meaning, but might be required
by the modeling tool
22. 22
Phase 4. Modeling
• Select the modeling technique
(based upon the data mining objective)
• Build model
(Parameter settings)
• Assess model (rank the models)
Various modeling techniques are selected and applied and their parameters
are calibrated to optimal values. Some techniques have specific requirements
on the form of data. Therefore, stepping back to the data preparation phase
is often necessary.
23. 23
Phase 4. Modeling
• Select modeling technique
- select the actual modeling technique that is to be used
ex) decision tree, neural network
- if multiple techniques are applied, perform this task for each techniques
separately
• Generate test design
- before actually building a model, generate a procedure or mechanism
to test the model’s quality and validity
ex) In classification, it is common to use error rates as quality measures
for data mining models. Therefore, typically separate the dataset into
train and test set, build the model on the train set and estimate its
quality on the separate test set
24. 24
Phase 4. Modeling
• Build model
- run the modeling tool on the prepared dataset to create one or more
models
• Assess model
- interprets the models according to his domain knowledge, the data
mining success criteria and the desired test design
- judges the success of the application of modeling and discovery
techniques more technically
- contacts business analysts and domain experts later in order to discuss
the data mining results in the business context
- only consider models whereas the evaluation phase also takes into
account all other results that were produced in the course of the project
25. 25
Phase 5. Evaluation
• Evaluation of model
- how well it performed on test data
• Methods and criteria
- depend on model type
• Interpretation of model
- important or not, easy or hard depends on algorithm
Thoroughly evaluate the model and review the steps executed to construct
the model to be certain it properly achieves the business objectives. A key
objective is to determine if there is some important business issue that has
not been sufficiently considered. At the end of this phase, a decision on the
use of the data mining results should be reached
26. 26
Phase 5. Evaluation
• Evaluate results
- assesses the degree to which the model meets the business
objectives
- seeks to determine if there is some business reason why this
model is deficient
- test the model(s) on test applications in the real application if
time and budget constraints permit
- also assesses other data mining results generated
- unveil additional challenges, information or hints for future
directions
27. 27
Phase 5. Evaluation
• Review process
- do a more thorough review of the data mining engagement in order to
determine if there is any important factor or task that has somehow
been overlooked
- review the quality assurance issues
ex) “Did we correctly build the model?”
• Determine next steps
- decides how to proceed at this stage
- decides whether to finish the project and move on to deployment if
appropriate or whether to initiate further iterations or set up new data
mining projects
- include analyses of remaining resources and budget that influences the
decisions
28. 28
Phase 6. Deployment
• Determine how the results need to be utilized
• Who needs to use them?
• How often do they need to be used
• Deploy Data Mining results by
Scoring a database, utilizing results as business rules,
interactive scoring on-line
The knowledge gained will need to be organized and presented in a way that
the customer can use it. However, depending on the requirements, the
deployment phase can be as simple as generating a report or as complex as
implementing a repeatable data mining process across the enterprise.
29. 29
Phase 6. Deployment
• Plan deployment
- in order to deploy the data mining result(s) into the business, takes the
evaluation results and concludes a strategy for deployment
- document the procedure for later deployment
• Plan monitoring and maintenance
- important if the data mining results become part of the day-to-day
business and it environment
- helps to avoid unnecessarily long periods of incorrect usage of data
mining results
- needs a detailed on monitoring process
- takes into account the specific type of deployment
30. 30
Phase 6. Deployment
• Produce final report
- the project leader and his team write up a final report
- may be only a summary of the project and its experiences
- may be a final and comprehensive presentation of the data mining
result(s)
• Review project
- assess what went right and what went wrong, what was done well and
what needs to be improved
31. 31
Summary
• Why CRISP-DM?
The data mining process must be reliable and repeatable
by people with little data mining skills
CRISP-DM provides a uniform framework for
- guidelines
- experience documentation
CRISP-DM is flexible to account for differences
- Different business/agency problems
- Different data