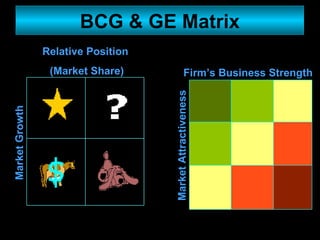
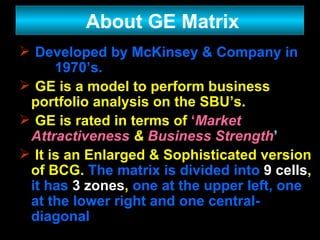
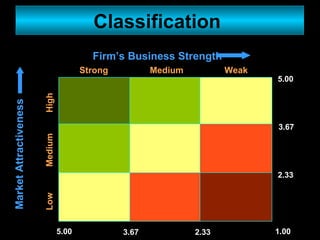
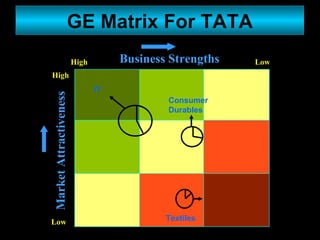
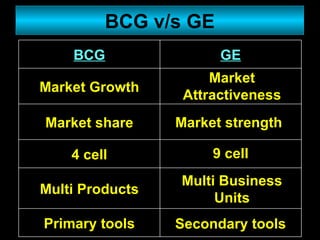
General Electric  (GE)  Matrix
Roadmap For The Presentation ROADMAP STRATEGIC PLANNING BCG & GE MATRIX ABOUT GE CLASSIFICATION STRATEGIES BCG v/s GE CASE STUDY
It is the management task concerned with the growth and future of business enterprise. It provides the route map for the firm and helps to take decision in the future with a greater awareness Strategic Planning
BCG & GE Matrix Market Attractiveness Firm’s Business Strength Market Growth Relative Position (Market Share)
Developed by McKinsey & Company in  1970’s. GE is a model to perform business portfolio analysis on the SBU’s. GE is rated in terms of  ‘ Market Attractiveness   &   Business Strength ’ It is an Enlarged & Sophisticated version of BCG.  The matrix is divided into   9   cells ,  it has   3 zones ,  one at the upper left, one at the lower right and one central-diagonal About GE Matrix
The  upper left  zone represents business that are  most important  to the company:  the  lower right  zone represents business that are  least important : and  the  central diagonal  zone represents businesses that are  medium  in their importance. Using the ratings in the matrix, the firm can appropriately set its objectively and strategies in respect of each of its businesses .
This Planning matrix ,holds that a company can suitably rate its different businesses for the purpose of strategic planning on the basis of two main parameters-   (1) Industry attractiveness , and  (2) Company’s Business Strength . When the industry concerned is highly attractive and the company has the best of strengths for excelling in that industry, the business is rated as the most important one to the company.  When the industry concerned is least attractive and the company's strength for excelling  in that industry is also very low, the business is rated as the least important one. The other businesses will occupy a position somewhere between the two extremes.  This is the idea of GE Matrix.
Classification  Market Attractiveness Strong Medium Weak Low Medium High Firm’s Business Strength 5.00 1.00 2.33 3.67 5.00 3.67 2.33
Overview Firm’s Business Strengths Market Attractiveness Low High Low High Attractive Moderate Attractive Unattractive
Annual market growth rate Overall market size Historical profit margin Current size of market Market structure Market rivalry Demand variability Global opportunities Market Attractiveness
Current market share Brand image Brand equity Production capacity Corporate image Profit margins relative to competitors R & D performance Managerial personal Promotional effectiveness Business Strength
Strategies Invest to Build Challenge for leadership Build selectively on strength Protect Position Invest to grow Effort on maintaining strength Build Selectively Invest in most attractive segment Build up ability to counter competition Emphasize profitability by raising productivity
Strategies Protect & Refocus Manage for current earning Defend strength Selectivity for Earning Protect existing program Investments in profitable segments  Build Selectively  Specialize around limited strength Seek ways to overcome weaknesses Withdraw if indication of sustainable  growth are lacking
Strategies Manage for Earnings Protect position in profitable segment Upgrade product line Minimize investment Limited Expansion for Harvest Look for ways to expand  without high risk  Harvest  Sell at time that will maximize cash value Cut fixed costs and avoid investment  meanwhile
Case Study
Overview Business Strengths Market Attractiveness Low High Low High Attractive Moderate Attractive Unattractive
Case Study of TATA TATA  IT (Information Technology) :  TCS Consumer Durable :  Automobiles,    Titan etc.  Textiles :  Tata Fabrics, West Sides etc
GE Matrix For TATA Business Strengths Market Attractiveness Low High Low High IT Consumer Durables Textiles
BCG v/s GE Market Attractiveness Market strength  9 cell Multi Business Units Secondary tools Market Growth Multi Products Primary tools 4 cell Market share GE BCG
Corporate Strategies -  Bani Banerjee   Marketing Management -  Philip Kotler Strategic Planning -  V S Ramaswamy Bibliography
 

Ge

  • 1.
    General Electric (GE) Matrix
  • 2.
    Roadmap For ThePresentation ROADMAP STRATEGIC PLANNING BCG & GE MATRIX ABOUT GE CLASSIFICATION STRATEGIES BCG v/s GE CASE STUDY
  • 3.
    It is themanagement task concerned with the growth and future of business enterprise. It provides the route map for the firm and helps to take decision in the future with a greater awareness Strategic Planning
  • 4.
    BCG & GEMatrix Market Attractiveness Firm’s Business Strength Market Growth Relative Position (Market Share)
  • 5.
    Developed by McKinsey& Company in 1970’s. GE is a model to perform business portfolio analysis on the SBU’s. GE is rated in terms of ‘ Market Attractiveness & Business Strength ’ It is an Enlarged & Sophisticated version of BCG. The matrix is divided into 9 cells , it has 3 zones , one at the upper left, one at the lower right and one central-diagonal About GE Matrix
  • 6.
    The upperleft zone represents business that are most important to the company: the lower right zone represents business that are least important : and the central diagonal zone represents businesses that are medium in their importance. Using the ratings in the matrix, the firm can appropriately set its objectively and strategies in respect of each of its businesses .
  • 7.
    This Planning matrix,holds that a company can suitably rate its different businesses for the purpose of strategic planning on the basis of two main parameters- (1) Industry attractiveness , and (2) Company’s Business Strength . When the industry concerned is highly attractive and the company has the best of strengths for excelling in that industry, the business is rated as the most important one to the company. When the industry concerned is least attractive and the company's strength for excelling in that industry is also very low, the business is rated as the least important one. The other businesses will occupy a position somewhere between the two extremes. This is the idea of GE Matrix.
  • 8.
    Classification MarketAttractiveness Strong Medium Weak Low Medium High Firm’s Business Strength 5.00 1.00 2.33 3.67 5.00 3.67 2.33
  • 9.
    Overview Firm’s BusinessStrengths Market Attractiveness Low High Low High Attractive Moderate Attractive Unattractive
  • 10.
    Annual market growthrate Overall market size Historical profit margin Current size of market Market structure Market rivalry Demand variability Global opportunities Market Attractiveness
  • 11.
    Current market shareBrand image Brand equity Production capacity Corporate image Profit margins relative to competitors R & D performance Managerial personal Promotional effectiveness Business Strength
  • 12.
    Strategies Invest toBuild Challenge for leadership Build selectively on strength Protect Position Invest to grow Effort on maintaining strength Build Selectively Invest in most attractive segment Build up ability to counter competition Emphasize profitability by raising productivity
  • 13.
    Strategies Protect &Refocus Manage for current earning Defend strength Selectivity for Earning Protect existing program Investments in profitable segments Build Selectively Specialize around limited strength Seek ways to overcome weaknesses Withdraw if indication of sustainable growth are lacking
  • 14.
    Strategies Manage forEarnings Protect position in profitable segment Upgrade product line Minimize investment Limited Expansion for Harvest Look for ways to expand without high risk Harvest Sell at time that will maximize cash value Cut fixed costs and avoid investment meanwhile
  • 15.
  • 16.
    Overview Business StrengthsMarket Attractiveness Low High Low High Attractive Moderate Attractive Unattractive
  • 17.
    Case Study ofTATA TATA IT (Information Technology) : TCS Consumer Durable : Automobiles, Titan etc. Textiles : Tata Fabrics, West Sides etc
  • 18.
    GE Matrix ForTATA Business Strengths Market Attractiveness Low High Low High IT Consumer Durables Textiles
  • 19.
    BCG v/s GEMarket Attractiveness Market strength 9 cell Multi Business Units Secondary tools Market Growth Multi Products Primary tools 4 cell Market share GE BCG
  • 20.
    Corporate Strategies - Bani Banerjee Marketing Management - Philip Kotler Strategic Planning - V S Ramaswamy Bibliography
  • 21.