This document discusses the GE/McKinsey matrix, which was developed in the 1970s to help companies evaluate their business units. The GE matrix uses two factors - business strength and industry attractiveness - to categorize business units into nine cells of a 3x3 grid. It aims to identify business units that are strong and in attractive industries, warranting high investment, versus those in weak industries or with weak business strengths. The document outlines the various factors used to evaluate business strength and industry attractiveness, provides an example of how business units are plotted on the matrix, and compares the GE matrix to the BCG matrix.
![NETAJI NAGAR DAY COLLEGE
M.COM PART-1 [ Session 2012-2014]
INTRODUCTION
• This matrix was developed in 1970s by the
General Electric Company with the assistance of the
consulting firm, McKinsey & Co, USA. This is also
called GE multifactor portfolio matrix.
• The G.E Model is an alternative technique used in
brand marketing and product management to help
a company decide what products to its product portfolio
and which market opportunities are worthy of continued
investment.
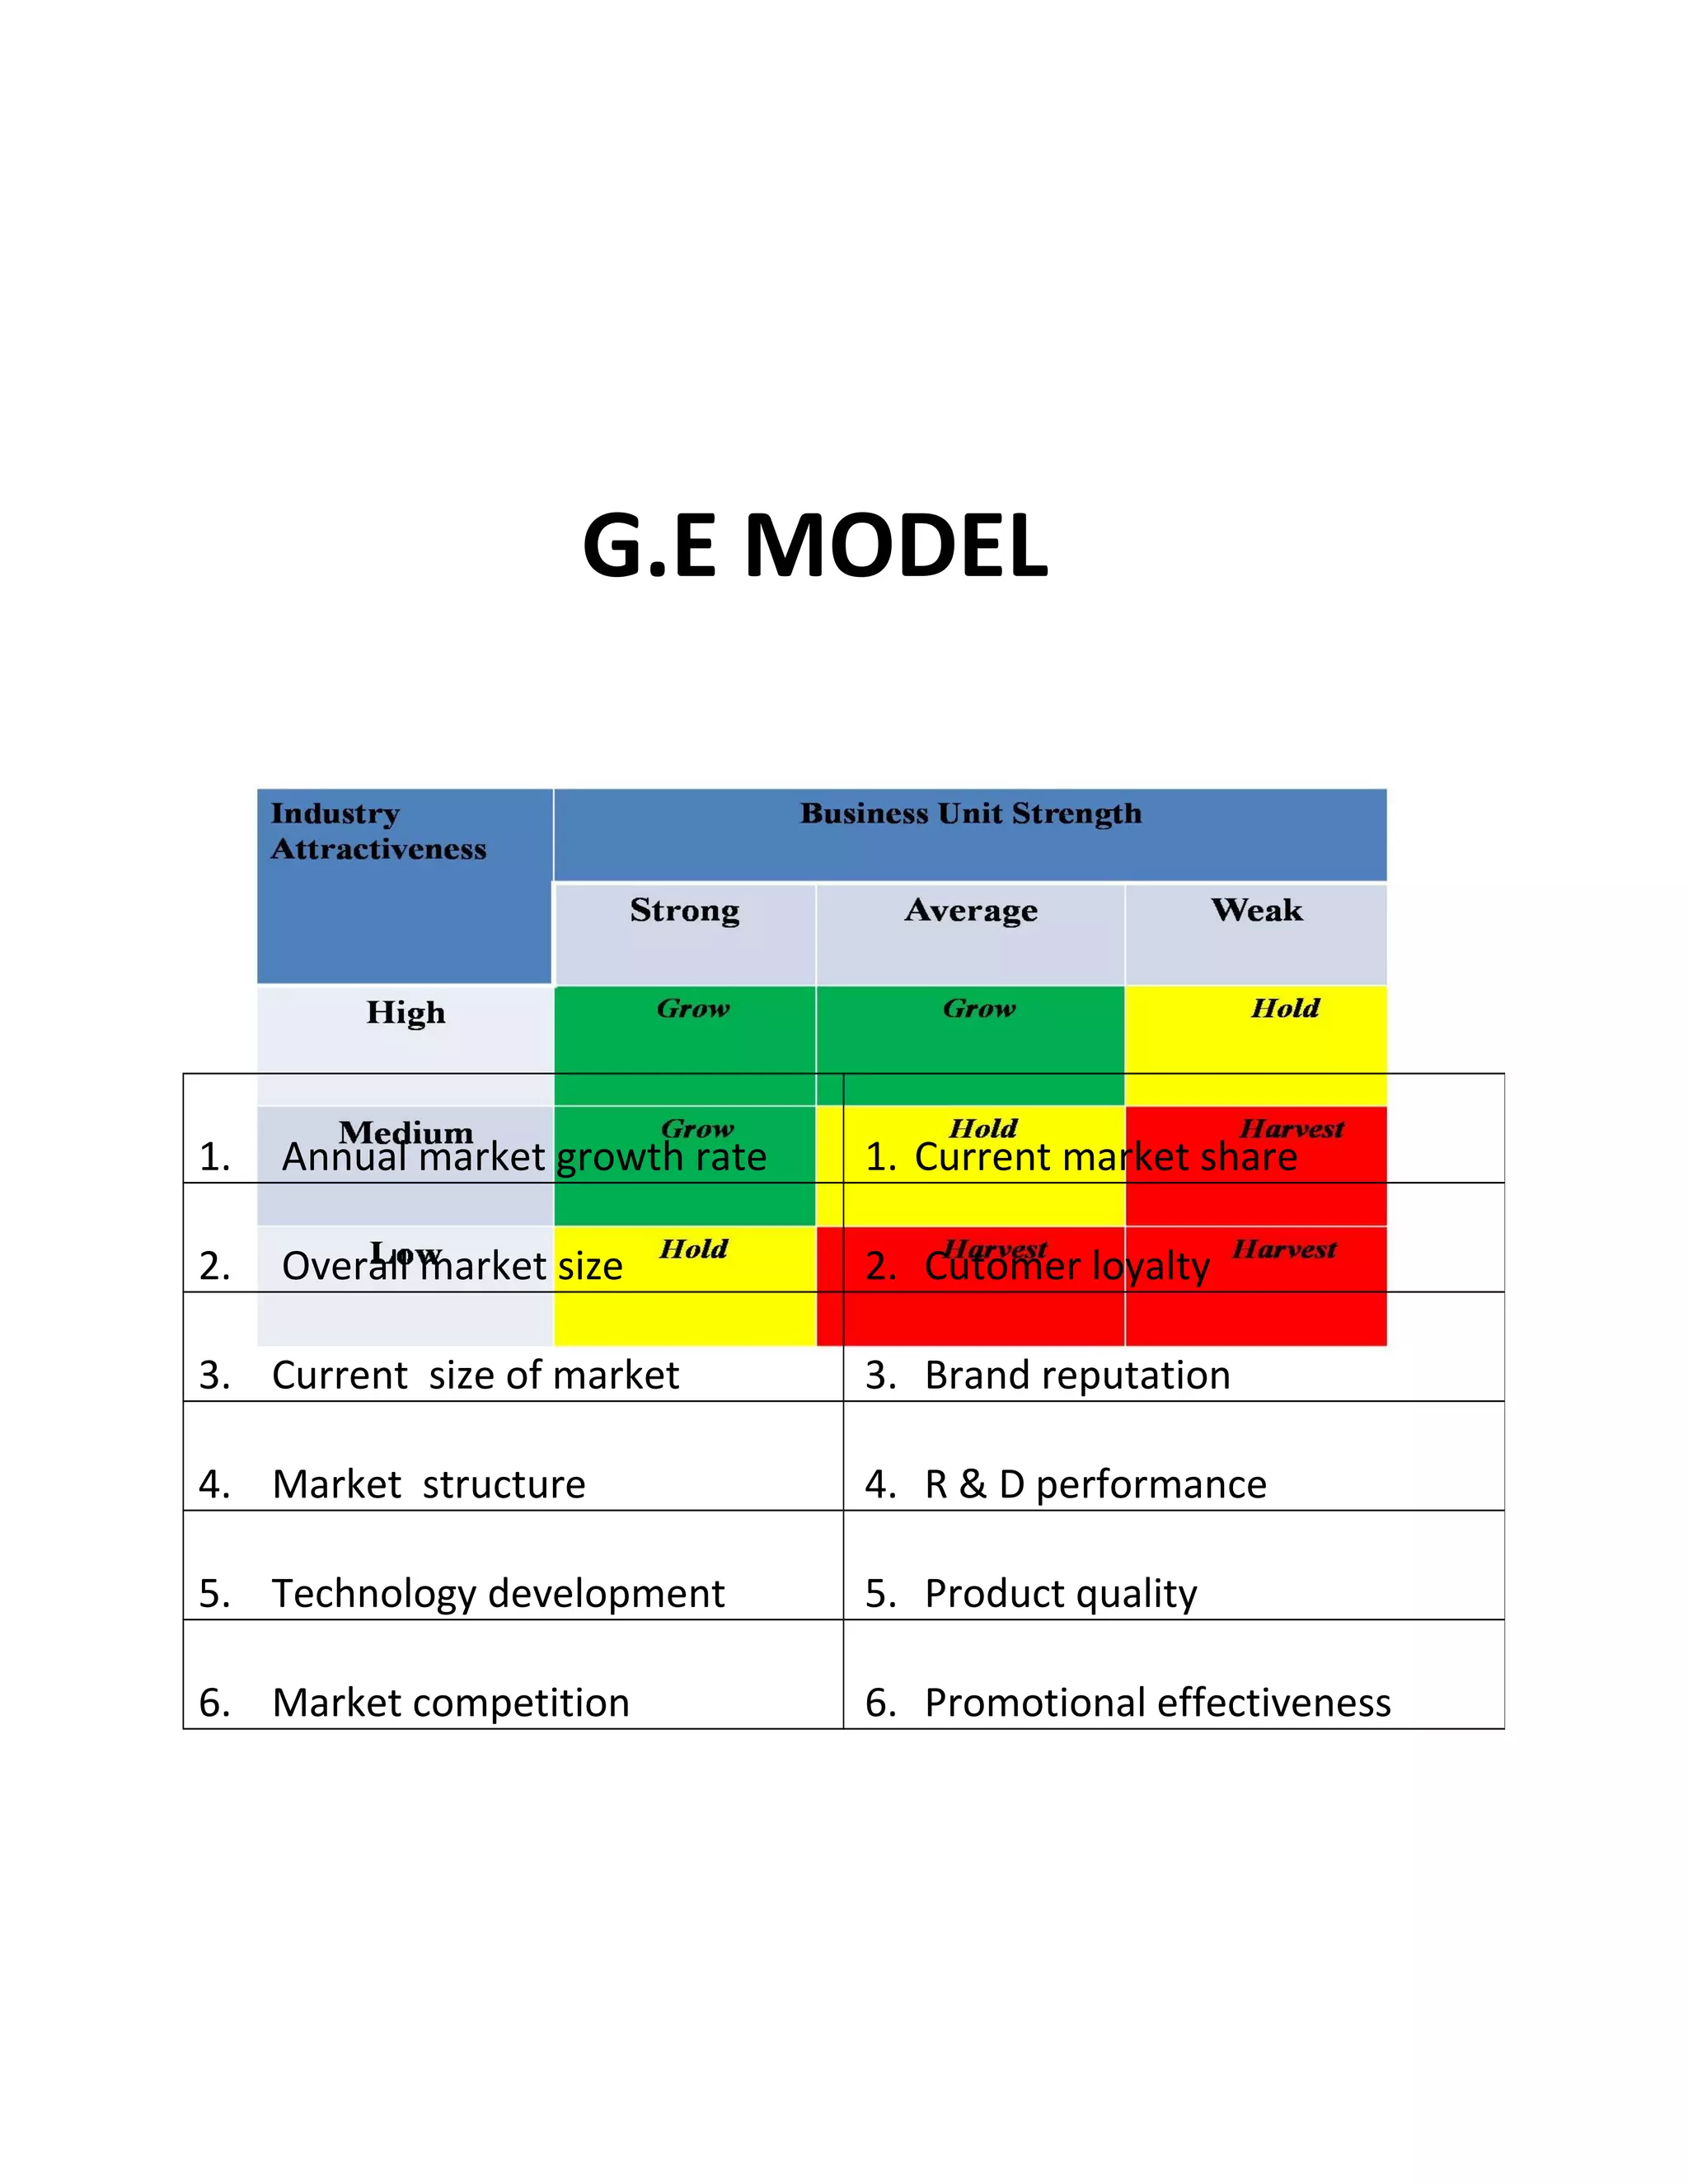
• This matrix consists of nine cells (3X3) based on two key
variables :
1. Business Strength](https://image.slidesharecdn.com/generalelectricmodel11-180111093645/75/General-electric-model-small-presentation-2-2048.jpg)