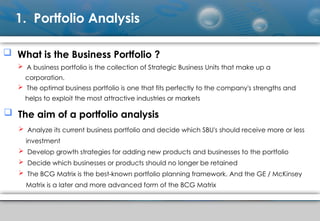
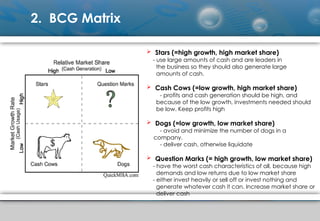
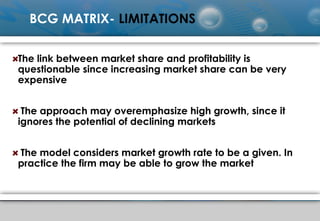
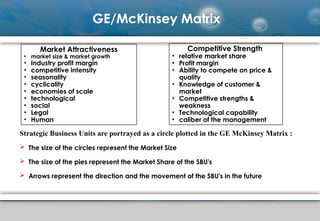
Portfolio Analysis
BCG Matrix, GE/Mckinsey Matrix >
Contents
BCG Matrix
GE/Mckinsey Matrix
Advantages and Limitation of
Portfolio analysis
Portfolio Analysis
1. Portfolio Analysis
 What is the Business Portfolio ?
 A business portfolio is the collection of Strategic Business Units that make up a
corporation.
 The optimal business portfolio is one that fits perfectly to the company's strengths and
helps to exploit the most attractive industries or markets
 The aim of a portfolio analysis
 Analyze its current business portfolio and decide which SBU's should receive more or less
investment
 Develop growth strategies for adding new products and businesses to the portfolio
 Decide which businesses or products should no longer be retained
 The BCG Matrix is the best-known portfolio planning framework. And the GE / McKinsey
Matrix is a later and more advanced form of the BCG Matrix
1. The Boston Matrix
(Also called the BCG Matrix, the
Growth-Share
Matrix and Portfolio Analysis)
BCG
The origin of the Boston Matrix lies with the Boston Consulting
Group in the early 1970s. It was devised as a clear and simple
method for helping corporations decide which parts of their
business they should allocate their available cash to. Today, this
is as important as ever because of the limited availability of
credit.
=>a good tool for thinking about where to apply other finite
resources: people, time and equipment.
Understanding the Model
• To understand the Boston Matrix which need to understand how
market share and market growth interrelate.
• MARKET SHARE is the percentage of the total market that is being
serviced by the company, measured either in revenue terms or unit
volume terms. The higher the market share, the higher proportion of
the market it can control.
• The Boston Matrix assumes that if the firm can enjoy a high market
share it will normally be making money (this assumption is based on
the idea that it will have been in the market long enough to have
learned how to be profitable, and will be enjoying scale economies
that give the firm an advantage).
Understanding the Model
• The question it asks is, "Should you be investing your resources
into that product line just because it is making you money?"
The answer is, "not necessarily."
This is where market growth comes into play.
• MARKET GROWTH a measure of a market's attractiveness.
Markets experiencing high growth are ones where the total market
is expanding, which should provide the opportunity for businesses
to make more money, even if their market share remains stable.
By contrast, competition in low growth markets is often bitter, and
while it might have high market share now, what will the situation
look like in a few months or a few years? This makes low growth
markets less attractive.
2. BCG Matrix
 Stars (=high growth, high market share)
- use large amounts of cash and are leaders in
the business so they should also generate large
amounts of cash.
 Cash Cows (=low growth, high market share)
- profits and cash generation should be high, and
because of the low growth, investments needed should
be low. Keep profits high
 Dogs (=low growth, low market share)
- avoid and minimize the number of dogs in a
company.
- deliver cash, otherwise liquidate
 Question Marks (= high growth, low market share)
- have the worst cash characteristics of all, because high
demands and low returns due to low market share
- either invest heavily or sell off or invest nothing and
generate whatever cash it can. Increase market share or
deliver cash
Star Strategies
• Leader expanding industry
• Generates large profits
• Requires substantial investments
to sustain growth
• Farthest down on experience
curve relative to competition
• Increase sales – e.g.new
markets, new channels of
distribution
• Increase market share
Stars:
High Market Share / High Market Growth
Problem Child or ?
• Low market share in expanding
industry
• Needs substantial cash to improve
its position
• Slow progress on experience curve
• Increase sales or
increase market share
• Leave market
Question Marks (Problem Child):
Low Market Share / High Market Growth
CASH COW
• Leader in mature or declining
industry
• Can generate funds for other
SBUs
• Maintain market share e.g.ensure
quality, build customer loyalty,
develop substitute brands
• Maximize Cash Flow e.g.
increase usage rate, rate of
replacement, modify expense
structure, raise prices
Cash Cows:
High Market Share / Low Market Growth
• Here, the firm is well-established, so it's easy to
get attention and exploit new opportunities.
However it's only worth expending a certain
amount of effort, because the market isn't growing
and the opportunities are limited.
DOGS
• Low market share in a mature or
declining industry
• Slow progress on experience
curve
• Cost disadvantages and few
growth opportunities
• Harvest or Divest
• Concentrate on niches requiring
limited effort
Dogs: Low Market Share / Low Market
Growth
How to Use The Tool:
• STEP 3: Determine what to do with each product/
product line. There are typically four different strategies
to apply:
• Build Market Share: Make further investments (for eg: to
maintain Star status, or turn a Question Mark into a Star)
• Hold: Maintain the status quo (do nothing)
• Harvest: Reduce the investment (enjoy positive cash
flow and maximize profits from a Star or Cash Cow)
• Divest: For example, get rid of the Dogs, and use the
capital to invest in Stars and some Question Marks.
Strategy Implications BCG
• CASH COW – Leader in mature or declining industry
– HOLD - Maintain share and cost leadership until further
investment becomes marginal
– Maximize cash flow
• DOGS – Low market share in a mature or declining
industry
– DIVEST Plan an orderly withdrawal so as to maximize cash
flow or concentrate on niches that require limited effort
BCG MATRIX- LIMITATIONS
The link between market share and profitability is
questionable since increasing market share can be very
expensive
The approach may overemphasize high growth, since it
ignores the potential of declining markets
The model considers market growth rate to be a given. In
practice the firm may be able to grow the market
GE/McKinsey Matrix
THE GE / MCKINSEY MATRIX ATTEMPT TO
IMPROVE UPON THE BCG MATRIX
Market (Industry) attractiveness replaces
market growth as the dimension of industry
attractiveness.
 Competitive strength replaces market
share as the dimension by which the
competitive position of each SBU is
assessed.
 GE / McKinsey Matrix works with a 3 x 3
grid, while the BCG Matrix has only 2 x 2.
This also allows for more sophistication
GE/McKinsey Matrix
Market Attractiveness
• market size & market growth
• Industry profit margin
• competitive intensity
• seasonality
• cyclicality
• economies of scale
• technological
• social
• Legal
• Human
Competitive Strength
• relative market share
• Profit margin
• Ability to compete on price &
quality
• Knowledge of customer &
market
• Competitive strengths &
weakness
• Technological capability
• caliber of the management
Strategic Business Units are portrayed as a circle plotted in the GE McKinsey Matrix :
 The size of the circles represent the Market Size
 The size of the pies represent the Market Share of the SBU's
 Arrows represent the direction and the movement of the SBU's in the future
LIMITATIONS OF GE/MCKINSEY MATRIX
 Interactions between Strategic Business Units
are not considered
Deal only with two dimensions & misleading the
other factors
Market share & cost are not directly proportional
A high market share in a low growth industry
does not necessarily result in large cash flow
No portfolio analysis treat the sources of value
creation from diversification strategies
 Core competencies are not represented
4. Advantages and limitation of Portfolio analysis
 Portfolio offers certain advantages
 It encourages top management to evaluate
each of the corporation’s businesses individually
and to set objectives and allocate resources for
each
 It stimulates the use of externally oriented data to
supplement management’s judgment
 It raises the issue of cash flow availability for use in
expansion and growth
 Its graphic depiction facilitates communication
 Portfolio have some very real limitations Matrix
 It is not easy to define market segments
 It suggests the use of standard strategies that
can miss opportunities or be impractical
 It provides an illusion of scientific rigor when in
reality positions are based on subjective
judgments
 It is not always clear what makes an industry
attractive or what stage a product is at in its
lifecycle
INDIAN CONTEXT
-No organised evidence is available
regarding the use & application of
these tools
-A realm of conjecture
-Need to convert as an Empirical
evidence & select suitable tools
Comprehensive Portfolio Performance Analysis

Comprehensive Portfolio Performance Analysis

  • 1.
    Portfolio Analysis BCG Matrix,GE/Mckinsey Matrix >
  • 2.
    Contents BCG Matrix GE/Mckinsey Matrix Advantagesand Limitation of Portfolio analysis Portfolio Analysis
  • 3.
    1. Portfolio Analysis What is the Business Portfolio ?  A business portfolio is the collection of Strategic Business Units that make up a corporation.  The optimal business portfolio is one that fits perfectly to the company's strengths and helps to exploit the most attractive industries or markets  The aim of a portfolio analysis  Analyze its current business portfolio and decide which SBU's should receive more or less investment  Develop growth strategies for adding new products and businesses to the portfolio  Decide which businesses or products should no longer be retained  The BCG Matrix is the best-known portfolio planning framework. And the GE / McKinsey Matrix is a later and more advanced form of the BCG Matrix
  • 4.
    1. The BostonMatrix (Also called the BCG Matrix, the Growth-Share Matrix and Portfolio Analysis)
  • 5.
    BCG The origin ofthe Boston Matrix lies with the Boston Consulting Group in the early 1970s. It was devised as a clear and simple method for helping corporations decide which parts of their business they should allocate their available cash to. Today, this is as important as ever because of the limited availability of credit. =>a good tool for thinking about where to apply other finite resources: people, time and equipment.
  • 6.
  • 7.
    Understanding the Model •To understand the Boston Matrix which need to understand how market share and market growth interrelate. • MARKET SHARE is the percentage of the total market that is being serviced by the company, measured either in revenue terms or unit volume terms. The higher the market share, the higher proportion of the market it can control. • The Boston Matrix assumes that if the firm can enjoy a high market share it will normally be making money (this assumption is based on the idea that it will have been in the market long enough to have learned how to be profitable, and will be enjoying scale economies that give the firm an advantage).
  • 8.
    Understanding the Model •The question it asks is, "Should you be investing your resources into that product line just because it is making you money?" The answer is, "not necessarily." This is where market growth comes into play. • MARKET GROWTH a measure of a market's attractiveness. Markets experiencing high growth are ones where the total market is expanding, which should provide the opportunity for businesses to make more money, even if their market share remains stable. By contrast, competition in low growth markets is often bitter, and while it might have high market share now, what will the situation look like in a few months or a few years? This makes low growth markets less attractive.
  • 9.
    2. BCG Matrix Stars (=high growth, high market share) - use large amounts of cash and are leaders in the business so they should also generate large amounts of cash.  Cash Cows (=low growth, high market share) - profits and cash generation should be high, and because of the low growth, investments needed should be low. Keep profits high  Dogs (=low growth, low market share) - avoid and minimize the number of dogs in a company. - deliver cash, otherwise liquidate  Question Marks (= high growth, low market share) - have the worst cash characteristics of all, because high demands and low returns due to low market share - either invest heavily or sell off or invest nothing and generate whatever cash it can. Increase market share or deliver cash
  • 10.
    Star Strategies • Leaderexpanding industry • Generates large profits • Requires substantial investments to sustain growth • Farthest down on experience curve relative to competition • Increase sales – e.g.new markets, new channels of distribution • Increase market share
  • 11.
    Stars: High Market Share/ High Market Growth
  • 12.
    Problem Child or? • Low market share in expanding industry • Needs substantial cash to improve its position • Slow progress on experience curve • Increase sales or increase market share • Leave market
  • 13.
    Question Marks (ProblemChild): Low Market Share / High Market Growth
  • 14.
    CASH COW • Leaderin mature or declining industry • Can generate funds for other SBUs • Maintain market share e.g.ensure quality, build customer loyalty, develop substitute brands • Maximize Cash Flow e.g. increase usage rate, rate of replacement, modify expense structure, raise prices
  • 15.
    Cash Cows: High MarketShare / Low Market Growth • Here, the firm is well-established, so it's easy to get attention and exploit new opportunities. However it's only worth expending a certain amount of effort, because the market isn't growing and the opportunities are limited.
  • 16.
    DOGS • Low marketshare in a mature or declining industry • Slow progress on experience curve • Cost disadvantages and few growth opportunities • Harvest or Divest • Concentrate on niches requiring limited effort
  • 17.
    Dogs: Low MarketShare / Low Market Growth
  • 18.
    How to UseThe Tool:
  • 19.
    • STEP 3:Determine what to do with each product/ product line. There are typically four different strategies to apply: • Build Market Share: Make further investments (for eg: to maintain Star status, or turn a Question Mark into a Star) • Hold: Maintain the status quo (do nothing) • Harvest: Reduce the investment (enjoy positive cash flow and maximize profits from a Star or Cash Cow) • Divest: For example, get rid of the Dogs, and use the capital to invest in Stars and some Question Marks.
  • 20.
  • 21.
    Strategy Implications BCG •CASH COW – Leader in mature or declining industry – HOLD - Maintain share and cost leadership until further investment becomes marginal – Maximize cash flow • DOGS – Low market share in a mature or declining industry – DIVEST Plan an orderly withdrawal so as to maximize cash flow or concentrate on niches that require limited effort
  • 22.
    BCG MATRIX- LIMITATIONS Thelink between market share and profitability is questionable since increasing market share can be very expensive The approach may overemphasize high growth, since it ignores the potential of declining markets The model considers market growth rate to be a given. In practice the firm may be able to grow the market
  • 24.
    GE/McKinsey Matrix THE GE/ MCKINSEY MATRIX ATTEMPT TO IMPROVE UPON THE BCG MATRIX Market (Industry) attractiveness replaces market growth as the dimension of industry attractiveness.  Competitive strength replaces market share as the dimension by which the competitive position of each SBU is assessed.  GE / McKinsey Matrix works with a 3 x 3 grid, while the BCG Matrix has only 2 x 2. This also allows for more sophistication
  • 29.
    GE/McKinsey Matrix Market Attractiveness •market size & market growth • Industry profit margin • competitive intensity • seasonality • cyclicality • economies of scale • technological • social • Legal • Human Competitive Strength • relative market share • Profit margin • Ability to compete on price & quality • Knowledge of customer & market • Competitive strengths & weakness • Technological capability • caliber of the management Strategic Business Units are portrayed as a circle plotted in the GE McKinsey Matrix :  The size of the circles represent the Market Size  The size of the pies represent the Market Share of the SBU's  Arrows represent the direction and the movement of the SBU's in the future
  • 39.
    LIMITATIONS OF GE/MCKINSEYMATRIX  Interactions between Strategic Business Units are not considered Deal only with two dimensions & misleading the other factors Market share & cost are not directly proportional A high market share in a low growth industry does not necessarily result in large cash flow No portfolio analysis treat the sources of value creation from diversification strategies  Core competencies are not represented
  • 40.
    4. Advantages andlimitation of Portfolio analysis  Portfolio offers certain advantages  It encourages top management to evaluate each of the corporation’s businesses individually and to set objectives and allocate resources for each  It stimulates the use of externally oriented data to supplement management’s judgment  It raises the issue of cash flow availability for use in expansion and growth  Its graphic depiction facilitates communication
  • 41.
     Portfolio havesome very real limitations Matrix  It is not easy to define market segments  It suggests the use of standard strategies that can miss opportunities or be impractical  It provides an illusion of scientific rigor when in reality positions are based on subjective judgments  It is not always clear what makes an industry attractive or what stage a product is at in its lifecycle
  • 42.
    INDIAN CONTEXT -No organisedevidence is available regarding the use & application of these tools -A realm of conjecture -Need to convert as an Empirical evidence & select suitable tools