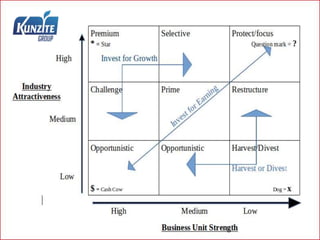
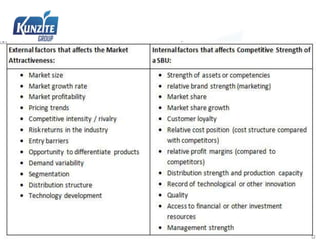
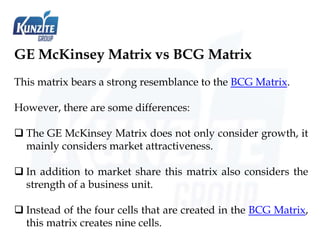
GE Nine(9)
Cell Matrix
What is GE nine cell matrix?
Inthe1970s,General Electric (GE) commissioned
McKinsey & Company to develop a portfolio
analysis matrix for screening its business units.
This matrix or GE Matrix is a variant of
the Boston Consulting Group (BCG) portfolio
analysis.
GE Nine(9) Cell Matrix. GE nine-box matrix is
a strategy tool that offers a systematic
approach for the multi business enterprises to
prioritize their investments among the various
business units. It is a framework that evaluates
business portfolio and provides further
strategic implications. This matrix has also
many points in common with the MABA
analysis. MABA is an acronym that stands
for Market, Attractiveness, Business
position and Assessment.
Industry attractiveness indicates how hard or
easy it will be for a company to compete in the
market and earn profits. The more profitable
the industry is the more attractive it becomes.
When evaluating the industry attractiveness,
analysts should look how an industry will
change in the long run rather than in the near
future, because the investments needed for the
product usually require long lasting
commitment.
Each business is appraised in terms of two
major dimensions – Market Attractiveness and
Business Strength. If one of these factors is
missing, then the business will not produce
desired results. Neither a strong company
operating in an unattractive market, nor a
weak company operating in an attractive
market will do very well
Three different strategies can be distinguished and
adopted using the GE McKinsey Matrix:
Green zone Invest/ grow
Suggests you to ‘go ahead’, to grow and build,
pushing you through expansion strategies.
Businesses in the green zone attract major
investment.
Yellow zone , Hold
Cautions you to ‘wait and see’ indicating hold and
maintain type of strategies aimed at stability.
Red zone Harvest / sell
Indicates that you have to adopt
turnover strategies of divestment
and liquidation or rebuilding
approach.
 The size of the market :- The size of the market
is an essential parameter to analyze the height of
the market attractiveness. If the market is large, the
producer will have more opportunities to sell
the product in the market. This will increase the
potential of that particular market which in turn
will increase the profitability of it. This means that
the market will have a higher potential of the profit
margin is at a lower value.
Market Attractiveness
 The growth rate , Historical and expected
market growth rate
Now after the size of the market, the second
important factor which can affect the market
attractiveness is the growth rate. If there is a market
that is not growing as expected, this would mean that
its revenue potential is finite or constant.
 Margins and pricing trends: Now since the
revenues are determined by analyzing the
volume and the margin, these two factors play an
essential role when it comes to the determination
of the profitability and the extent of the market
attractiveness. Now suppose that there are two
different markets but are having the same market
size, and are having profit margins which are
completely different from each other, in cases like
these their different marginal points will be
having the potential of being able to generate the
different revenues.
Also if the pricing trends are different as well, then in cases like
these, if the prices are decreasing, then it is highly likely that
they might continue to do the same, thus eroding the profit
margins. And if there is a case in the prices are increasing, then
here they can be seen an increase in the revenue opportunity in
that particular market
 Product life cycle changes
 Changes in demand
 Competitors
 Seasonality
 Availability of labor
 Market segmentation
 Price development
 Threats and opportunities (component of SWOT
Analysis)
Business Strength
The matrix measures how strong, in terms of
competition, a particular business unit is
against its rivals. In other words, managers try
to determine whether a business unit has a
sustainable competitive advantage (or at least
temporary competitive advantage) or not.
 Total market share
 Market share growth compared to rivals
 Brand strength (use brand value for this)
 Profitability of the company
 Customer loyalty
 Value of core competences
 Quality and distribution
 Strength of a value chain
 Level of product differentiation
 Production flexibility
 Financial Strengths
Before we can plot anything on the grid, first we need
to decide how we will determine both Industry
Attractiveness and Business Unit Strength.
Industry Attractiveness
 Porter 5 Forces
 Economic Factors
 Financial Norms
 Socio Political Consideration -Government Regulations
Business Unit Strength
 Cost Position
 Level of Differentiation
 Financial Strength
 Human Assets
 Response Time
 Public Approval
Advantages
 Helps to prioritize the limited resources in order to
achieve the best returns.
 Managers become more aware of how their
products or business units perform.
 It’s more sophisticated business portfolio
framework than the BCG matrix.
 Identifies the strategic steps the company needs to
make to improve the performance of its business
portfolio.
GE McKinsey Matrix vs BCG Matrix
This matrix bears a strong resemblance to the BCG Matrix.
However, there are some differences:
 The GE McKinsey Matrix does not only consider growth, it
mainly considers market attractiveness.
 In addition to market share this matrix also considers the
strength of a business unit.
 Instead of the four cells that are created in the BCG Matrix,
this matrix creates nine cells.
Ge nine(9) cell matrix

Ge nine(9) cell matrix

  • 1.
  • 2.
    What is GEnine cell matrix? Inthe1970s,General Electric (GE) commissioned McKinsey & Company to develop a portfolio analysis matrix for screening its business units. This matrix or GE Matrix is a variant of the Boston Consulting Group (BCG) portfolio analysis.
  • 3.
    GE Nine(9) CellMatrix. GE nine-box matrix is a strategy tool that offers a systematic approach for the multi business enterprises to prioritize their investments among the various business units. It is a framework that evaluates business portfolio and provides further strategic implications. This matrix has also many points in common with the MABA analysis. MABA is an acronym that stands for Market, Attractiveness, Business position and Assessment.
  • 5.
    Industry attractiveness indicateshow hard or easy it will be for a company to compete in the market and earn profits. The more profitable the industry is the more attractive it becomes. When evaluating the industry attractiveness, analysts should look how an industry will change in the long run rather than in the near future, because the investments needed for the product usually require long lasting commitment.
  • 6.
    Each business isappraised in terms of two major dimensions – Market Attractiveness and Business Strength. If one of these factors is missing, then the business will not produce desired results. Neither a strong company operating in an unattractive market, nor a weak company operating in an attractive market will do very well
  • 7.
    Three different strategiescan be distinguished and adopted using the GE McKinsey Matrix: Green zone Invest/ grow Suggests you to ‘go ahead’, to grow and build, pushing you through expansion strategies. Businesses in the green zone attract major investment. Yellow zone , Hold Cautions you to ‘wait and see’ indicating hold and maintain type of strategies aimed at stability.
  • 8.
    Red zone Harvest/ sell Indicates that you have to adopt turnover strategies of divestment and liquidation or rebuilding approach.
  • 11.
     The sizeof the market :- The size of the market is an essential parameter to analyze the height of the market attractiveness. If the market is large, the producer will have more opportunities to sell the product in the market. This will increase the potential of that particular market which in turn will increase the profitability of it. This means that the market will have a higher potential of the profit margin is at a lower value. Market Attractiveness
  • 12.
     The growthrate , Historical and expected market growth rate Now after the size of the market, the second important factor which can affect the market attractiveness is the growth rate. If there is a market that is not growing as expected, this would mean that its revenue potential is finite or constant.
  • 13.
     Margins andpricing trends: Now since the revenues are determined by analyzing the volume and the margin, these two factors play an essential role when it comes to the determination of the profitability and the extent of the market attractiveness. Now suppose that there are two different markets but are having the same market size, and are having profit margins which are completely different from each other, in cases like these their different marginal points will be having the potential of being able to generate the different revenues.
  • 14.
    Also if thepricing trends are different as well, then in cases like these, if the prices are decreasing, then it is highly likely that they might continue to do the same, thus eroding the profit margins. And if there is a case in the prices are increasing, then here they can be seen an increase in the revenue opportunity in that particular market
  • 15.
     Product lifecycle changes  Changes in demand  Competitors  Seasonality  Availability of labor  Market segmentation  Price development  Threats and opportunities (component of SWOT Analysis)
  • 16.
    Business Strength The matrixmeasures how strong, in terms of competition, a particular business unit is against its rivals. In other words, managers try to determine whether a business unit has a sustainable competitive advantage (or at least temporary competitive advantage) or not.
  • 17.
     Total marketshare  Market share growth compared to rivals  Brand strength (use brand value for this)  Profitability of the company  Customer loyalty  Value of core competences  Quality and distribution
  • 18.
     Strength ofa value chain  Level of product differentiation  Production flexibility  Financial Strengths
  • 21.
    Before we canplot anything on the grid, first we need to decide how we will determine both Industry Attractiveness and Business Unit Strength. Industry Attractiveness  Porter 5 Forces  Economic Factors  Financial Norms  Socio Political Consideration -Government Regulations Business Unit Strength  Cost Position  Level of Differentiation  Financial Strength  Human Assets  Response Time  Public Approval
  • 23.
    Advantages  Helps toprioritize the limited resources in order to achieve the best returns.  Managers become more aware of how their products or business units perform.  It’s more sophisticated business portfolio framework than the BCG matrix.  Identifies the strategic steps the company needs to make to improve the performance of its business portfolio.
  • 24.
    GE McKinsey Matrixvs BCG Matrix This matrix bears a strong resemblance to the BCG Matrix. However, there are some differences:  The GE McKinsey Matrix does not only consider growth, it mainly considers market attractiveness.  In addition to market share this matrix also considers the strength of a business unit.  Instead of the four cells that are created in the BCG Matrix, this matrix creates nine cells.