Downloaded 1,392 times
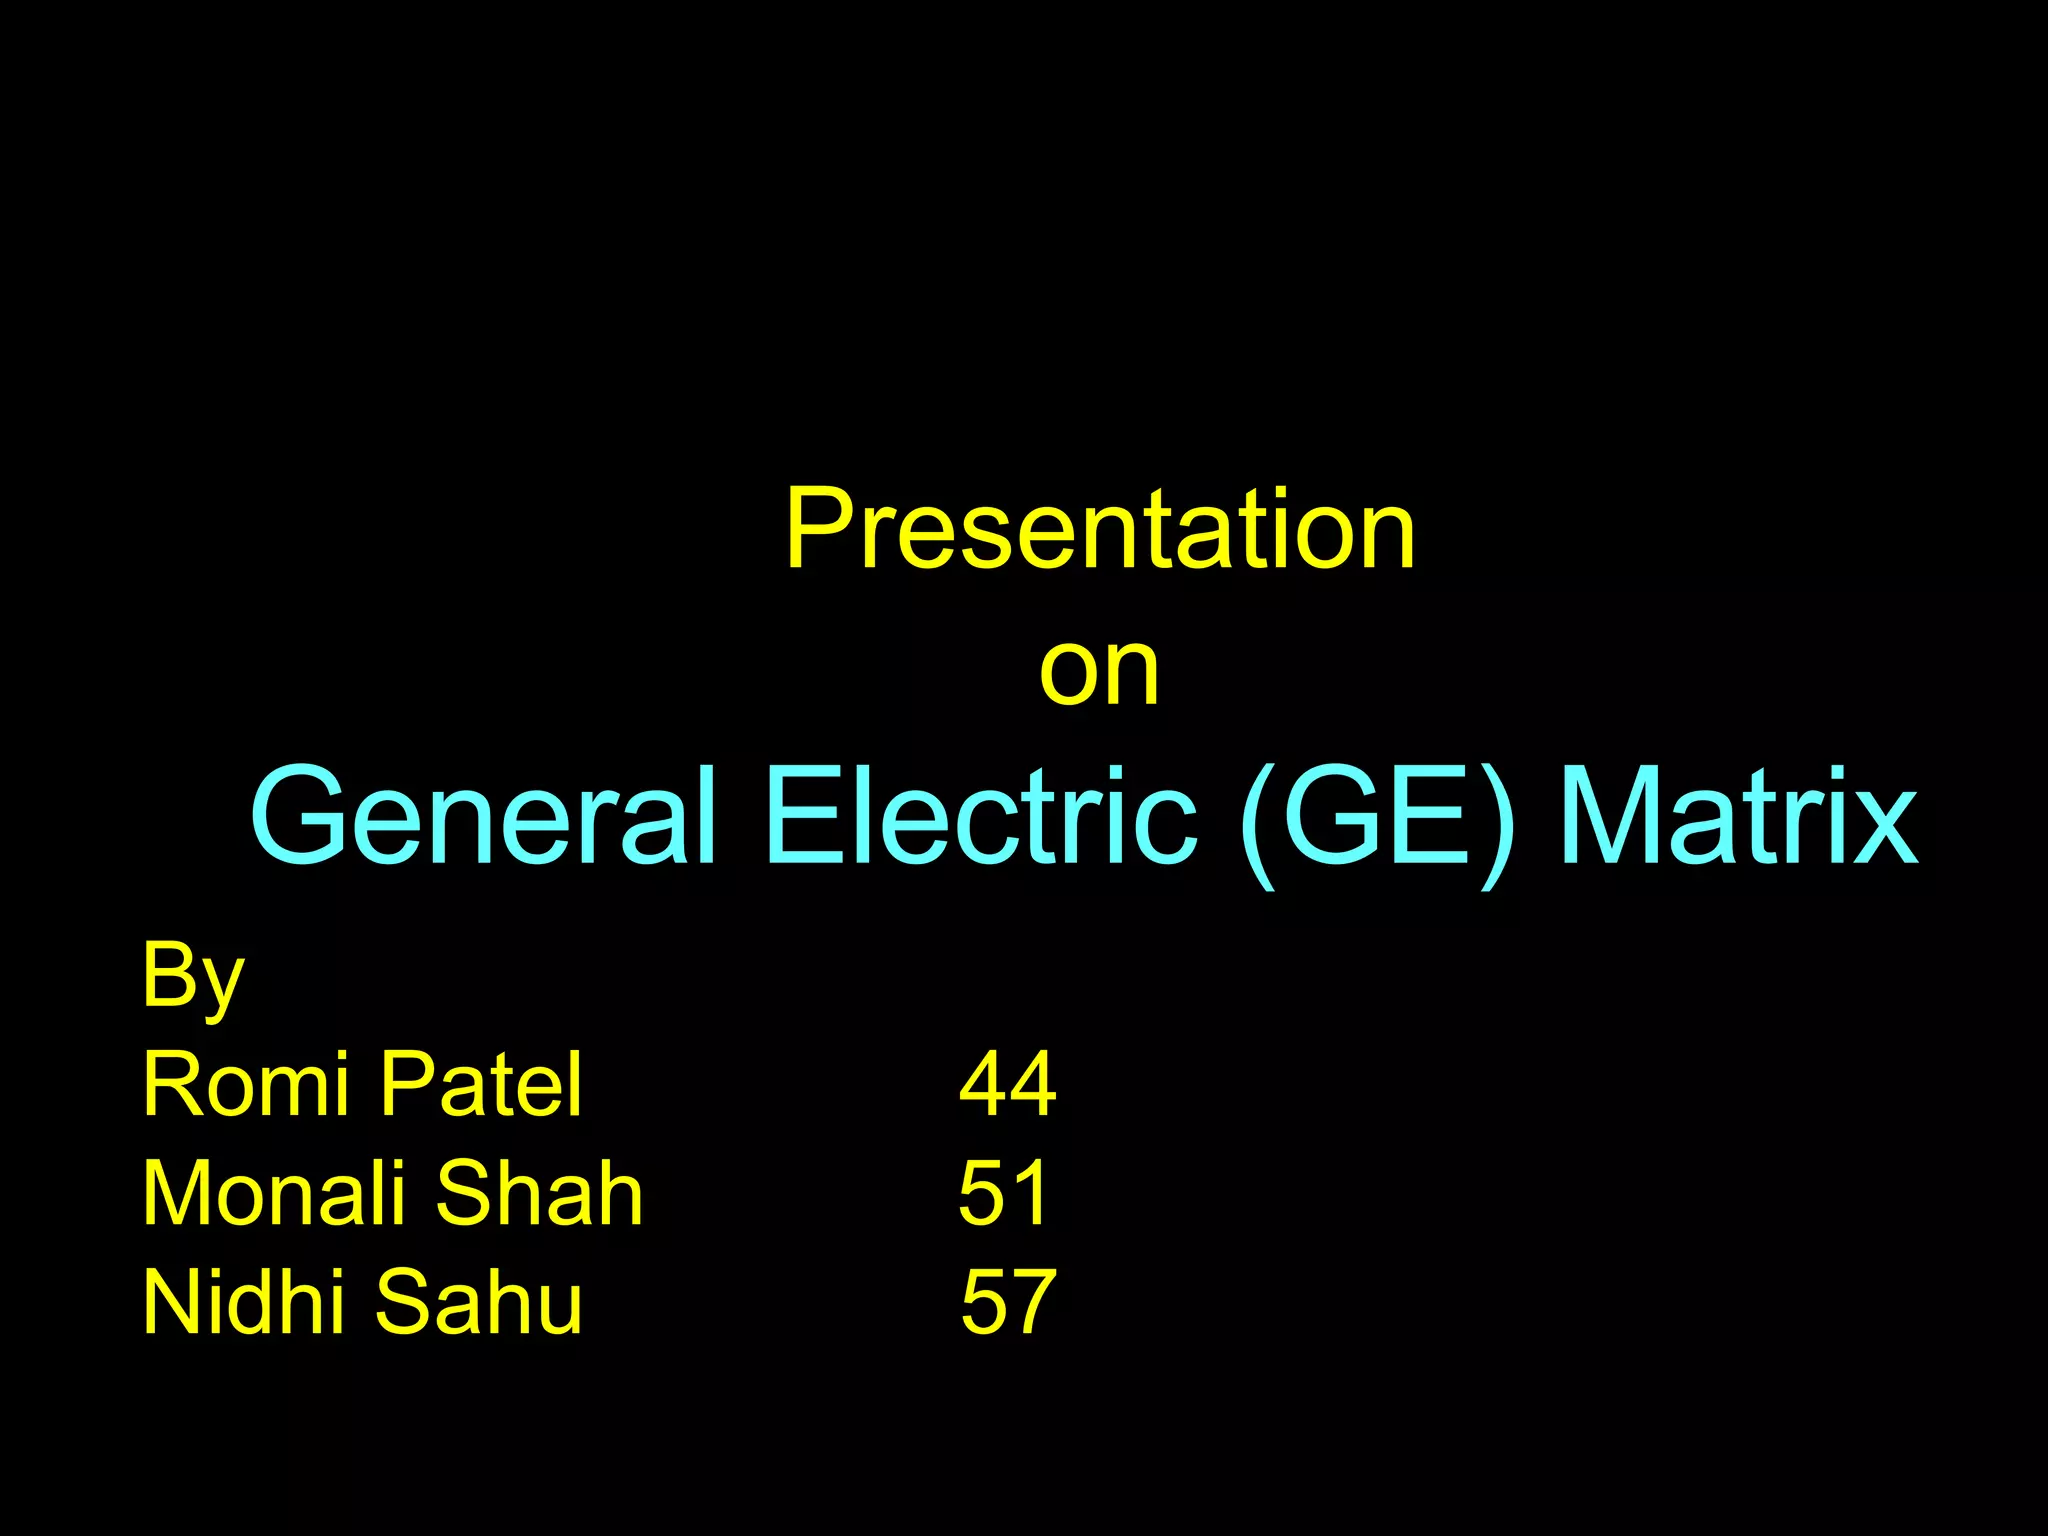
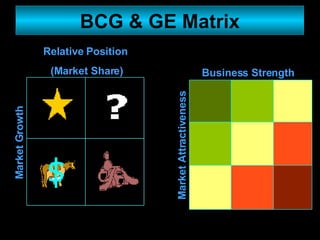
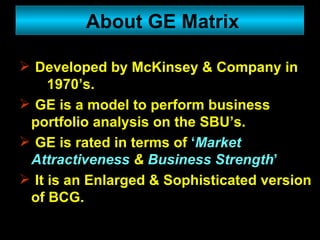
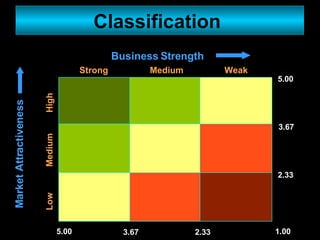

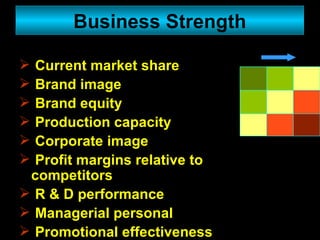
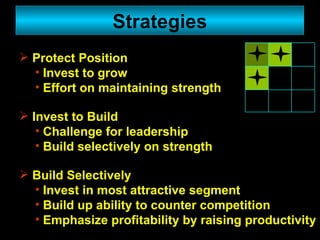
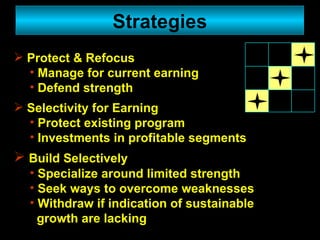

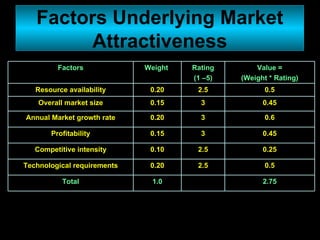
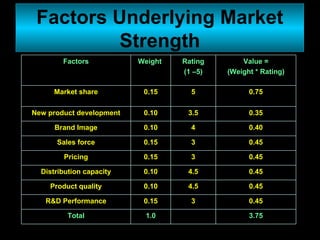


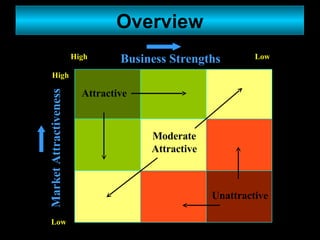
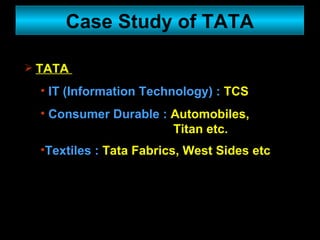
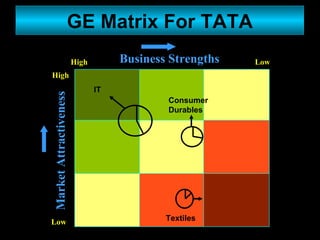
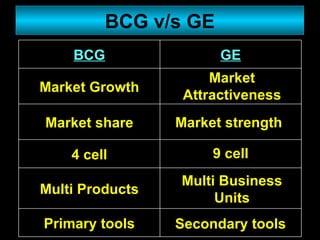


The document presents a roadmap for a presentation on General Electric's (GE) matrix, which is used to analyze business portfolio. It discusses strategic planning, the BCG matrix, GE matrix, and how GE classifies businesses based on their market attractiveness and business strength. It then provides examples of different strategies associated with each classification in the GE matrix and factors considered in assessing market attractiveness and business strength. Finally, it gives a case study comparing Tata's businesses using the BCG and GE matrices.


![Sb Us[1]](https://cdn.slidesharecdn.com/ss_thumbnails/sb-us11571-thumbnail.jpg?width=640&height=640&fit=bounds)


![Nike Ppt[1]](https://cdn.slidesharecdn.com/ss_thumbnails/nike-ppt14822-thumbnail.jpg?width=640&height=640&fit=bounds)

![Mrktg Price[1]](https://cdn.slidesharecdn.com/ss_thumbnails/mrktg-price12559-thumbnail.jpg?width=640&height=640&fit=bounds)


