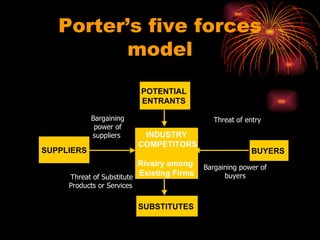
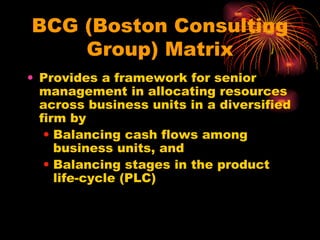
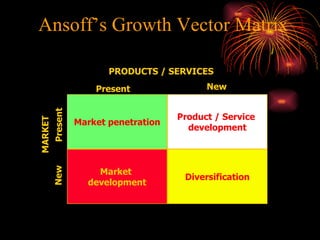
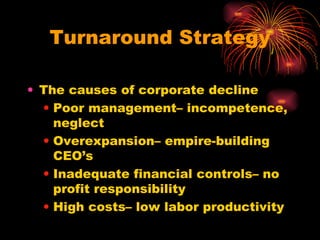
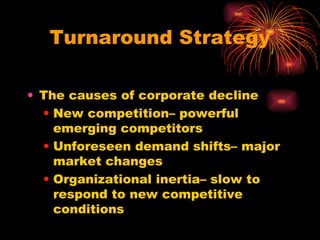
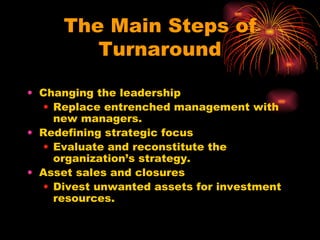
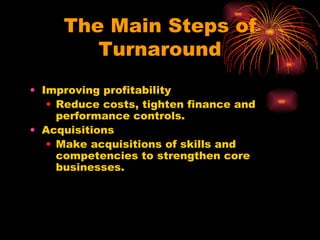
Strategic and Marketing Planning
Benefits of Planning Consistency Commitment Responsibility Communication Benefits of Planning Direction
#1: Top Down #2: Bottom Up #3: Goals Down, Plans Up Approaches to Planning
The Strategy Hierarchy SBU Strategy Marketing Strategy Marketing objectives Product markets strategies Corporate Level Functional Level of SBU Strategic Business Unit Level Corporate Strategy Mission and vision Objectives Business portfolio strategy Resource development Corporate values SBU Strategy Business definition Objectives Product market portfolio Competitive strategy Resource allocation and management SBU Strategy Finance and administration Strategy Production  and operation  strategy R&D Strategy Technology Product  development Human  resources Strategy Strategic Planning Investment Management Growth & Company Position Strategy
Corporate, Business and Marketing Strategy Model Corporate Strategy Building core competencies Business portfolio Capital investments and resource allocation Corporate culture Corporate structure Product/market portfolio Resource allocation Product-markets Business culture Strategic cost management Markets Products and services Profit-yielding strategies Brand management Profit improvement Business Strategy Distinctive competencies Developing competitive position Competitive advantage Marketing Strategy Developing market position Customer satisfaction Focus Customer value creation, maintenance and defence Focus Economic value added Focus Economic value added Shareholder Value Business Value Customer Value
Strategic-Planning, Implementation, and Control Process Planning Measuring results Diagnosing results Taking corrective action Implementation Corporate planning Division planning Business planning Product planning Organising Implementing Control
Objectives Address Two Questions: Where  do we want to be? When   do we expect to get there? Corporate Plan Objectives
Planning Terms Vision :  the long term, “ I have a dream ” Mission:  purpose of organisation Objective:  a shorter term goal leading to the achievement of the Mission Strategy:  a description of the method of achieving the objective Tactic:  the short term application of the strategy
Porter’s five forces model SUBSTITUTES  INDUSTRY COMPETITORS Rivalry among  Existing Firms BUYERS  POTENTIAL  ENTRANTS  Threat of entry  Bargaining power of suppliers  Bargaining power of buyers Threat of Substitute Products or Services  SUPPLIERS
Porter’s five-forces model  (2) Bargaining power o f   suppliers Threat of new entrants Competitive r ivalry Threat of substitutes Bargaining power o f   buyers Where there are numerous or equally balanced competitors,  there is slow industry growth, lack of differentiation, low buyer switching costs, high fixed costs, overcapacity, perishable products (and services) and high exit barriers.
Porter’s five-forces model  (3) Bargaining power of   suppliers Threat of new entrants Competitive r ivalry Threat of substitutes Bargaining power of   buyers When there are only a few large buyers in the market ,  the buying volume is large ,   there is  low differentiation between competitive products , the value of the industry product is low, the seller’s quality is relatively unimportant to the buyer, there are low switching costs for the buyer or high switching costs for the seller,  the buyer is a low profit earner, the buyer has access to full market information  or the buying company could forward integrate and become a competitor.
Porter’s five-forces model  (4) Bargaining power o f   suppliers Threat of new entrants Competitive r ivalry Threat of s ubstitutes Bargaining power o f   buyers When the barriers to industry entry are low ,  there  are: no cost advantages for existing competitors a lack of product  differentiation low capital costs for market  entry relatively easy access to  distribution channels.
Porter’s five-forces model  (5) When there are only a few large suppliers ,  the supplier’s product is highly differentiated or unique , t he supplier sells the same product to other industries  or a supplier could forward-integrate and enter the market as a competitor. Bargaining power o f   suppliers Threat of new entrants Competitive r ivalry Threat of substitutes Bargaining power of   buyers
Porter’s five-forces model  (6) Bargaining power o f   suppliers Threat of new entrants Competitive r ivalry Threat of s ubstitutes Bargaining power o f   buyers When substitute products are close in performance and price to the industry’s product ,  there are low switching cost s  and switching is a commonplace occurrence .
Business Portfolio Analysis
Outline Introduction BCG (Boston Consulting Group) Matrix GE(General Electric)/McKinsey Multi-Factor Matrix
Introduction The creation of SBUs enables the setting of SBU’s mission and objectives and the allocation of resources across SBUs in the organization Senior management need to have a framework to evaluate SBUs and to assign limited resources among them; hence portfolio analysis Many models but only 2 are covered here: BCG,  & GE models
BCG (Boston Consulting Group) Matrix Provides a framework for senior management in allocating resources across business units in a diversified firm by Balancing cash flows among business units, and Balancing stages in the product life-cycle (PLC)
The BCG Matrix (Log Scale)
BCG Matrix (cont’d) The horizontal axis is the Relative Market Share shown in a log scale Vertical line is  usually  set as 1.0 Relative Market Share An SBU to the left of this line means it is the market leader in the industry or segment in which it operates Conversely, an SBU to the right of this line (1.0 RMS) means it is not the leader The vertical axis is the industry growth rate . The horizontal rate is usually set at 10% market growth
The BCG Matrix High Low High  Low  Market Growth Rate Relative Market Share
The Strategic Implications of the BCG Cash cows Investments sufficient to maintain competitive position. Cash surpluses used in developing and nurturing stars and selected question mark firms. Stars Aggressive investments to support continued growth and consolidate competitive position of firms.
The Strategic Implications of the BCG Question marks Selective investments; divestiture for weak firms or those with uncertain prospects and lack of strategic fit. Dogs Divestiture, harvesting, or liquidation and industry exit. Co then considers acquisitions, divestments and new ventures to get a “balanced” portfolio
Question Marks  (Problem Children) Investment—heavy initial capacity expenditures and high R&D costs Earnings—negative to low Cash-flow—negative (net cash user) Strategy Implications If possible to dominate segment, go after share.  If not, redefine the business or withdraw
Stars Investment—continue to invest for capacity expansion Earnings—Low to high earnings Cash-flow—Negative (net cash user) Strategy Implications Continue to increase market share—even at the expense of short-term earnings
Cows Investment—Capacity maintenance Earnings—High  Cash-flow—Positive (net cash contributor) Strategy Implications Maintain market share and cost leadership until further investment becomes marginal
Dogs Investment Gradually reduce capacity Earnings—High to low Cash-flow Positive (net cash contributor) if deliberately reducing capacity Strategy Implications Plan an orderly withdrawal to maximize cash flow
Example of a BCG Matrix for a Engineering company in India High Low High  Low  Product Sales Growth Rate Relative Market Share Lighting Switchgear Transformer Fan Pumps Motor
BCG Matrix ( Three Paths to Success) Continuously generate cash cows and use the cash throw-up by the  cash cows  to invest in the question marks that are not self-sustaining Stars  need a lot of reinvestments and as the market matures, stars will degenerate into cash cows and the process will be repeated. As for  dogs , segment the markets and nurse the dogs to health or manage for cash
Three Paths to Success (cont’d) High Low High  Low  Market Growth Rate Relative Market Share
BCG Matrix ( Three Paths to Failure) Over invest in cash cows and under invest in question marks Trade further opportunities for present cash flow Under invest in the stars Allow competitors to gain share in a high growth market Over milked the cash cows
Three Paths to Failure (cont’d) High Low High  Low  Market Growth Rate Relative Market Share
Limitations on Portfolio Planning Flaws in portfolio planning: The BCG model is simplistic if used blindly; considers only two competitive environment factors– relative market share and industry growth rate. High relative market share is no guarantee of a cost savings or competitive advantage (but normally does a good job of predicting cash flow) Low relative market share is not always an indicator of competitive failure or lack of profitability (but normally does a good job of predicting cash flow).
Limitations on Portfolio Planning Flaws in portfolio planning: Multifactor models (e.g., the McKinsey matrix or the GE Grid) are better though imperfect.  Importantly, goals other than cash flow may be more critical (such as ROI).  If so, use the BCG with caution Fail to look at “dependencies” among SBUs wrt transferring competencies, economies of scope,etc.
GE(General Electric)/McKinsey Multi-Factor Matrix Originally developed by GE’s planners drawing on McKinsey’s approaches Market attractiveness is based on as many relevant factors as are appropriate in a given context Business-position assessment also made on a many factors SBU needs to be rated on each factor
GE Multifactor Portfolio Matrix Business Strength Industry attractiveness High High Medium Medium Low Low Invest/Grow Selectivity /earnings Harvest  /Divest Protect Position Invest to Build Build selectively Build selectively Selectively manage for earnings Limited expansion or harvest Protect & refocus Divest Manage for earnings
GE Multifactor Portfolio Matrix (Cont’d) Invest/Grow Selectivity /earnings Harvest  /Divest Business Strength Industry attractiveness High High Medium Medium Low Low
Some Limitations of the GE Model Subjective measurements across SBUs Process also highly subjective From the selection and weighting of factors to the subsequent development of both a firm’s position and the market attractiveness  Businesses may have been evaluated with respect to different criteria Sensitive to how a product market is defined
Ansoff’s Growth Vector Matrix Market penetration Market  development Diversification Product / Service  development Present New Present New MARKET PRODUCTS / SERVICES
Using the Ansoff Matrix in the Objective-setting Process Market penetration (1) Market  development (3) Diversification (4) Product / Service  development (2) Established New Established New MARKET PRODUCTS / SERVICES High Risk
The Strategic-Planning Gap Sales 10 5 0 Time (years ) Desired sales Integrative growth Intensive growth Current portfolio Strategic- planning gap Diversification   growth
Integrative Growth Backward Integration Forward Integration Horizontal Integration
Diversification Growth Concentric diversification  A process that occurs when new products related to current products are introduced into new markets.  Conglomerate diversification  A process that occurs when new products unrelated to current technology, products or markets are introduced into new markets.
Corp as a Portfolio of “Competencies” Identify current competencies Compare competencies to opportunities and threats Develop an agenda for corporate development Advantage is that this method recognizes need to add value by looking at inter-dependencies
From Agenda to Action Based on the analysis of the portfolio and “what do you have to do” the next step is “how to you get there” Internal New Ventures Acquisitions Joint Ventures
Internal New Venturing Internal new venturing is attractive when: Entering as a science-based company. Entering an emerging industry with no established competitors. Good if company has key competencies that can be leveraged
Internal New Venturing Pitfalls of new venturing (very high failure rate): Scale of entry– Low-scale entry reduces probability of long-term success (low share drives high costs and low revenue) Commercialization– Failure to develop a product that meets basic customer needs. Poor Implementation– Using “shotgun” approach, not setting clear strategic objectives, abandoning projects too soon.
Internal New Venturing Guidelines for successful new venturing: Adopt a structural approach with clear strategic objectives setting R&D direction. Foster close links between R&D and marketing. Use project teams to reduce development time.
Internal New Venturing Guidelines for successful new venturing: Use a selection process to pick venture projects with the highest probability of success. Monitor progress of ventures in gaining initial market share goals. Large-scale entry is important for venture success.
Acquisition is an attractive strategy when: Competencies important in a new business area are lacking in the entering firm. Speed of entry is considered important. Acquisition is perceived as a less risky form of entry. Barriers to entry can be overcome  by acquisition of a firm in the  industry targeted for entry. Acquisitions as an Entry Strategy
Acquisitions as an Entry Strategy Pitfalls of acquisitions: Failing to follow through on postacquisition  integration of the acquired firm. Overestimating the economic  benefits of the acquisition. Underestimating the expense  of an acquisition. Failing to properly screen candidates  before acquisition.
Acquisitions as an Entry Strategy Guidelines for successful acquisitions: Properly identify acquisition targets and conduct a thorough preacquisition screening of the target firm. Use a bidding strategy with proper timing to avoid overpaying for an acquisition.
Acquisitions as an Entry Strategy Guidelines for successful acquisitions: Follow through on post acquisition integration synergy-producing activities of the acquired firm. Dispose of unwanted residual acquisition assets.
Joint Ventures as an Entry Strategy Attractions Sharing new project costs and risks. Increasing the probability of success  in establishing the new business.
Joint Ventures as an Entry Strategy Drawbacks Requires a sharing of control with partner firms. Requires that partner firms share profits. Risks giving away critical knowledge. Risks creating a potential competitor.
Restructuring Why restructure? Pull-back from overdiversification. Attacks by competitors on core  businesses. Diminished strategic advantages of  vertical integration and diversification.
Restructuring Exit strategies Divestment– spinoffs of profitable SBUs to investors; management buy outs (MBOs). Harvest– halting investment, maximizing cash flow. Liquidation– Cease operations, write off assets.
Turnaround Strategy The causes of corporate decline Poor management– incompetence, neglect Overexpansion– empire-building CEO’s Inadequate financial controls– no profit responsibility High costs– low labor productivity
Turnaround Strategy The causes of corporate decline New competition– powerful emerging competitors Unforeseen demand shifts– major market changes Organizational inertia– slow to respond to new competitive conditions
The Main Steps of Turnaround Changing the leadership Replace entrenched management with new managers. Redefining strategic focus Evaluate and reconstitute the organization’s strategy. Asset sales and closures Divest unwanted assets for investment resources.
The Main Steps of Turnaround Improving profitability Reduce costs, tighten finance and performance controls.  Acquisitions Make acquisitions of skills and competencies to strengthen core businesses.
Successful Planning Successful marketing planning requires: Commitment Time Understanding
The McKinsey 7-S Framework Skills Shared values Staff Style Strategy Structure Systems
Profit improvement options Profit Improvement Sales Growth Productivity Improvement Market Penetration Existing Assets Market Development Product Development Change Asset base Improve product sales  mix  ( margin) Increase Price Increase usage Take  competitors’ customers Improve asset utilisation (experience and  efficiency New Segments Convert non-users Existing Markets New Markets Cost Reduction Investment innovation diversification Divestment redeployment of capital resources Growth focus Cash and margin focus Capital utilisation  focus
Extended Marketing Mix 1.   PRODUCT & SERVICE Variety Quality Design Features Brand name Packaging Sizes Add-ons Warranties Returns 7.  PROMOTION Advertising Sales Promotion Personal selling Direct marketing Public relations 6.  PLACEMENT for customer service Channels Coverage Locations Inventory  Logistics management 2.  PRICE List price Discounts Allowances Settlement and  credit terms 3.  PEOPLE People interacting with people is how many service situations might be described.  Relationships are important in marketing 4.  PROCESS In the case of ‘high-contact’ services, customers are involved in the process.  Technology is also important in conversion operations and service delivery 5.  PHYSICAL EVIDENCE Services are mostly intangible.  Thus  the  meaning of other tools and techniques used in measures of satisfaction are important TARGET CUSTOMERS INTENDED  POSITIONING
The Marketing Environment Target Consumers Product Place Price Promotion Marketing Implementation Marketing Planning Marketing Control Marketing Analysis Competitors Marketing Channels Publics Suppliers Demographic- Economic Environment Technological- Natural Environment Political- Legal Environment Social- Cultural Environment

Marketing Strategy

  • 1.
  • 2.
    Benefits of PlanningConsistency Commitment Responsibility Communication Benefits of Planning Direction
  • 3.
    #1: Top Down#2: Bottom Up #3: Goals Down, Plans Up Approaches to Planning
  • 4.
    The Strategy HierarchySBU Strategy Marketing Strategy Marketing objectives Product markets strategies Corporate Level Functional Level of SBU Strategic Business Unit Level Corporate Strategy Mission and vision Objectives Business portfolio strategy Resource development Corporate values SBU Strategy Business definition Objectives Product market portfolio Competitive strategy Resource allocation and management SBU Strategy Finance and administration Strategy Production and operation strategy R&D Strategy Technology Product development Human resources Strategy Strategic Planning Investment Management Growth & Company Position Strategy
  • 5.
    Corporate, Business andMarketing Strategy Model Corporate Strategy Building core competencies Business portfolio Capital investments and resource allocation Corporate culture Corporate structure Product/market portfolio Resource allocation Product-markets Business culture Strategic cost management Markets Products and services Profit-yielding strategies Brand management Profit improvement Business Strategy Distinctive competencies Developing competitive position Competitive advantage Marketing Strategy Developing market position Customer satisfaction Focus Customer value creation, maintenance and defence Focus Economic value added Focus Economic value added Shareholder Value Business Value Customer Value
  • 6.
    Strategic-Planning, Implementation, andControl Process Planning Measuring results Diagnosing results Taking corrective action Implementation Corporate planning Division planning Business planning Product planning Organising Implementing Control
  • 7.
    Objectives Address TwoQuestions: Where do we want to be? When do we expect to get there? Corporate Plan Objectives
  • 8.
    Planning Terms Vision: the long term, “ I have a dream ” Mission: purpose of organisation Objective: a shorter term goal leading to the achievement of the Mission Strategy: a description of the method of achieving the objective Tactic: the short term application of the strategy
  • 9.
    Porter’s five forcesmodel SUBSTITUTES INDUSTRY COMPETITORS Rivalry among Existing Firms BUYERS POTENTIAL ENTRANTS Threat of entry Bargaining power of suppliers Bargaining power of buyers Threat of Substitute Products or Services SUPPLIERS
  • 10.
    Porter’s five-forces model (2) Bargaining power o f suppliers Threat of new entrants Competitive r ivalry Threat of substitutes Bargaining power o f buyers Where there are numerous or equally balanced competitors, there is slow industry growth, lack of differentiation, low buyer switching costs, high fixed costs, overcapacity, perishable products (and services) and high exit barriers.
  • 11.
    Porter’s five-forces model (3) Bargaining power of suppliers Threat of new entrants Competitive r ivalry Threat of substitutes Bargaining power of buyers When there are only a few large buyers in the market , the buying volume is large , there is low differentiation between competitive products , the value of the industry product is low, the seller’s quality is relatively unimportant to the buyer, there are low switching costs for the buyer or high switching costs for the seller, the buyer is a low profit earner, the buyer has access to full market information or the buying company could forward integrate and become a competitor.
  • 12.
    Porter’s five-forces model (4) Bargaining power o f suppliers Threat of new entrants Competitive r ivalry Threat of s ubstitutes Bargaining power o f buyers When the barriers to industry entry are low , there are: no cost advantages for existing competitors a lack of product differentiation low capital costs for market entry relatively easy access to distribution channels.
  • 13.
    Porter’s five-forces model (5) When there are only a few large suppliers , the supplier’s product is highly differentiated or unique , t he supplier sells the same product to other industries or a supplier could forward-integrate and enter the market as a competitor. Bargaining power o f suppliers Threat of new entrants Competitive r ivalry Threat of substitutes Bargaining power of buyers
  • 14.
    Porter’s five-forces model (6) Bargaining power o f suppliers Threat of new entrants Competitive r ivalry Threat of s ubstitutes Bargaining power o f buyers When substitute products are close in performance and price to the industry’s product , there are low switching cost s and switching is a commonplace occurrence .
  • 15.
  • 16.
    Outline Introduction BCG(Boston Consulting Group) Matrix GE(General Electric)/McKinsey Multi-Factor Matrix
  • 17.
    Introduction The creationof SBUs enables the setting of SBU’s mission and objectives and the allocation of resources across SBUs in the organization Senior management need to have a framework to evaluate SBUs and to assign limited resources among them; hence portfolio analysis Many models but only 2 are covered here: BCG, & GE models
  • 18.
    BCG (Boston ConsultingGroup) Matrix Provides a framework for senior management in allocating resources across business units in a diversified firm by Balancing cash flows among business units, and Balancing stages in the product life-cycle (PLC)
  • 19.
    The BCG Matrix(Log Scale)
  • 20.
    BCG Matrix (cont’d)The horizontal axis is the Relative Market Share shown in a log scale Vertical line is usually set as 1.0 Relative Market Share An SBU to the left of this line means it is the market leader in the industry or segment in which it operates Conversely, an SBU to the right of this line (1.0 RMS) means it is not the leader The vertical axis is the industry growth rate . The horizontal rate is usually set at 10% market growth
  • 21.
    The BCG MatrixHigh Low High Low Market Growth Rate Relative Market Share
  • 22.
    The Strategic Implicationsof the BCG Cash cows Investments sufficient to maintain competitive position. Cash surpluses used in developing and nurturing stars and selected question mark firms. Stars Aggressive investments to support continued growth and consolidate competitive position of firms.
  • 23.
    The Strategic Implicationsof the BCG Question marks Selective investments; divestiture for weak firms or those with uncertain prospects and lack of strategic fit. Dogs Divestiture, harvesting, or liquidation and industry exit. Co then considers acquisitions, divestments and new ventures to get a “balanced” portfolio
  • 24.
    Question Marks (Problem Children) Investment—heavy initial capacity expenditures and high R&D costs Earnings—negative to low Cash-flow—negative (net cash user) Strategy Implications If possible to dominate segment, go after share. If not, redefine the business or withdraw
  • 25.
    Stars Investment—continue toinvest for capacity expansion Earnings—Low to high earnings Cash-flow—Negative (net cash user) Strategy Implications Continue to increase market share—even at the expense of short-term earnings
  • 26.
    Cows Investment—Capacity maintenanceEarnings—High Cash-flow—Positive (net cash contributor) Strategy Implications Maintain market share and cost leadership until further investment becomes marginal
  • 27.
    Dogs Investment Graduallyreduce capacity Earnings—High to low Cash-flow Positive (net cash contributor) if deliberately reducing capacity Strategy Implications Plan an orderly withdrawal to maximize cash flow
  • 28.
    Example of aBCG Matrix for a Engineering company in India High Low High Low Product Sales Growth Rate Relative Market Share Lighting Switchgear Transformer Fan Pumps Motor
  • 29.
    BCG Matrix (Three Paths to Success) Continuously generate cash cows and use the cash throw-up by the cash cows to invest in the question marks that are not self-sustaining Stars need a lot of reinvestments and as the market matures, stars will degenerate into cash cows and the process will be repeated. As for dogs , segment the markets and nurse the dogs to health or manage for cash
  • 30.
    Three Paths toSuccess (cont’d) High Low High Low Market Growth Rate Relative Market Share
  • 31.
    BCG Matrix (Three Paths to Failure) Over invest in cash cows and under invest in question marks Trade further opportunities for present cash flow Under invest in the stars Allow competitors to gain share in a high growth market Over milked the cash cows
  • 32.
    Three Paths toFailure (cont’d) High Low High Low Market Growth Rate Relative Market Share
  • 33.
    Limitations on PortfolioPlanning Flaws in portfolio planning: The BCG model is simplistic if used blindly; considers only two competitive environment factors– relative market share and industry growth rate. High relative market share is no guarantee of a cost savings or competitive advantage (but normally does a good job of predicting cash flow) Low relative market share is not always an indicator of competitive failure or lack of profitability (but normally does a good job of predicting cash flow).
  • 34.
    Limitations on PortfolioPlanning Flaws in portfolio planning: Multifactor models (e.g., the McKinsey matrix or the GE Grid) are better though imperfect. Importantly, goals other than cash flow may be more critical (such as ROI). If so, use the BCG with caution Fail to look at “dependencies” among SBUs wrt transferring competencies, economies of scope,etc.
  • 35.
    GE(General Electric)/McKinsey Multi-FactorMatrix Originally developed by GE’s planners drawing on McKinsey’s approaches Market attractiveness is based on as many relevant factors as are appropriate in a given context Business-position assessment also made on a many factors SBU needs to be rated on each factor
  • 36.
    GE Multifactor PortfolioMatrix Business Strength Industry attractiveness High High Medium Medium Low Low Invest/Grow Selectivity /earnings Harvest /Divest Protect Position Invest to Build Build selectively Build selectively Selectively manage for earnings Limited expansion or harvest Protect & refocus Divest Manage for earnings
  • 37.
    GE Multifactor PortfolioMatrix (Cont’d) Invest/Grow Selectivity /earnings Harvest /Divest Business Strength Industry attractiveness High High Medium Medium Low Low
  • 38.
    Some Limitations ofthe GE Model Subjective measurements across SBUs Process also highly subjective From the selection and weighting of factors to the subsequent development of both a firm’s position and the market attractiveness Businesses may have been evaluated with respect to different criteria Sensitive to how a product market is defined
  • 39.
    Ansoff’s Growth VectorMatrix Market penetration Market development Diversification Product / Service development Present New Present New MARKET PRODUCTS / SERVICES
  • 40.
    Using the AnsoffMatrix in the Objective-setting Process Market penetration (1) Market development (3) Diversification (4) Product / Service development (2) Established New Established New MARKET PRODUCTS / SERVICES High Risk
  • 41.
    The Strategic-Planning GapSales 10 5 0 Time (years ) Desired sales Integrative growth Intensive growth Current portfolio Strategic- planning gap Diversification growth
  • 42.
    Integrative Growth BackwardIntegration Forward Integration Horizontal Integration
  • 43.
    Diversification Growth Concentricdiversification A process that occurs when new products related to current products are introduced into new markets. Conglomerate diversification A process that occurs when new products unrelated to current technology, products or markets are introduced into new markets.
  • 44.
    Corp as aPortfolio of “Competencies” Identify current competencies Compare competencies to opportunities and threats Develop an agenda for corporate development Advantage is that this method recognizes need to add value by looking at inter-dependencies
  • 45.
    From Agenda toAction Based on the analysis of the portfolio and “what do you have to do” the next step is “how to you get there” Internal New Ventures Acquisitions Joint Ventures
  • 46.
    Internal New VenturingInternal new venturing is attractive when: Entering as a science-based company. Entering an emerging industry with no established competitors. Good if company has key competencies that can be leveraged
  • 47.
    Internal New VenturingPitfalls of new venturing (very high failure rate): Scale of entry– Low-scale entry reduces probability of long-term success (low share drives high costs and low revenue) Commercialization– Failure to develop a product that meets basic customer needs. Poor Implementation– Using “shotgun” approach, not setting clear strategic objectives, abandoning projects too soon.
  • 48.
    Internal New VenturingGuidelines for successful new venturing: Adopt a structural approach with clear strategic objectives setting R&D direction. Foster close links between R&D and marketing. Use project teams to reduce development time.
  • 49.
    Internal New VenturingGuidelines for successful new venturing: Use a selection process to pick venture projects with the highest probability of success. Monitor progress of ventures in gaining initial market share goals. Large-scale entry is important for venture success.
  • 50.
    Acquisition is anattractive strategy when: Competencies important in a new business area are lacking in the entering firm. Speed of entry is considered important. Acquisition is perceived as a less risky form of entry. Barriers to entry can be overcome by acquisition of a firm in the industry targeted for entry. Acquisitions as an Entry Strategy
  • 51.
    Acquisitions as anEntry Strategy Pitfalls of acquisitions: Failing to follow through on postacquisition integration of the acquired firm. Overestimating the economic benefits of the acquisition. Underestimating the expense of an acquisition. Failing to properly screen candidates before acquisition.
  • 52.
    Acquisitions as anEntry Strategy Guidelines for successful acquisitions: Properly identify acquisition targets and conduct a thorough preacquisition screening of the target firm. Use a bidding strategy with proper timing to avoid overpaying for an acquisition.
  • 53.
    Acquisitions as anEntry Strategy Guidelines for successful acquisitions: Follow through on post acquisition integration synergy-producing activities of the acquired firm. Dispose of unwanted residual acquisition assets.
  • 54.
    Joint Ventures asan Entry Strategy Attractions Sharing new project costs and risks. Increasing the probability of success in establishing the new business.
  • 55.
    Joint Ventures asan Entry Strategy Drawbacks Requires a sharing of control with partner firms. Requires that partner firms share profits. Risks giving away critical knowledge. Risks creating a potential competitor.
  • 56.
    Restructuring Why restructure?Pull-back from overdiversification. Attacks by competitors on core businesses. Diminished strategic advantages of vertical integration and diversification.
  • 57.
    Restructuring Exit strategiesDivestment– spinoffs of profitable SBUs to investors; management buy outs (MBOs). Harvest– halting investment, maximizing cash flow. Liquidation– Cease operations, write off assets.
  • 58.
    Turnaround Strategy Thecauses of corporate decline Poor management– incompetence, neglect Overexpansion– empire-building CEO’s Inadequate financial controls– no profit responsibility High costs– low labor productivity
  • 59.
    Turnaround Strategy Thecauses of corporate decline New competition– powerful emerging competitors Unforeseen demand shifts– major market changes Organizational inertia– slow to respond to new competitive conditions
  • 60.
    The Main Stepsof Turnaround Changing the leadership Replace entrenched management with new managers. Redefining strategic focus Evaluate and reconstitute the organization’s strategy. Asset sales and closures Divest unwanted assets for investment resources.
  • 61.
    The Main Stepsof Turnaround Improving profitability Reduce costs, tighten finance and performance controls. Acquisitions Make acquisitions of skills and competencies to strengthen core businesses.
  • 62.
    Successful Planning Successfulmarketing planning requires: Commitment Time Understanding
  • 63.
    The McKinsey 7-SFramework Skills Shared values Staff Style Strategy Structure Systems
  • 64.
    Profit improvement optionsProfit Improvement Sales Growth Productivity Improvement Market Penetration Existing Assets Market Development Product Development Change Asset base Improve product sales mix ( margin) Increase Price Increase usage Take competitors’ customers Improve asset utilisation (experience and efficiency New Segments Convert non-users Existing Markets New Markets Cost Reduction Investment innovation diversification Divestment redeployment of capital resources Growth focus Cash and margin focus Capital utilisation focus
  • 65.
    Extended Marketing Mix1. PRODUCT & SERVICE Variety Quality Design Features Brand name Packaging Sizes Add-ons Warranties Returns 7. PROMOTION Advertising Sales Promotion Personal selling Direct marketing Public relations 6. PLACEMENT for customer service Channels Coverage Locations Inventory Logistics management 2. PRICE List price Discounts Allowances Settlement and credit terms 3. PEOPLE People interacting with people is how many service situations might be described. Relationships are important in marketing 4. PROCESS In the case of ‘high-contact’ services, customers are involved in the process. Technology is also important in conversion operations and service delivery 5. PHYSICAL EVIDENCE Services are mostly intangible. Thus the meaning of other tools and techniques used in measures of satisfaction are important TARGET CUSTOMERS INTENDED POSITIONING
  • 66.
    The Marketing EnvironmentTarget Consumers Product Place Price Promotion Marketing Implementation Marketing Planning Marketing Control Marketing Analysis Competitors Marketing Channels Publics Suppliers Demographic- Economic Environment Technological- Natural Environment Political- Legal Environment Social- Cultural Environment

Editor's Notes

  • #29 Objective: Continuously generate cash cows Money earned by a cash cow is not reinvested in that part of the business but in a question mark with the intent to gain share; hoping to turn a ? into a star. As the market matures, and competition lessens, that star will degenerate into a cash cow and the process will be repeated. With a new cash cow, the firm has a steady source of funds to pursue future avenues of growth.
  • #36 Attempt to explain why different SBU had different profitability