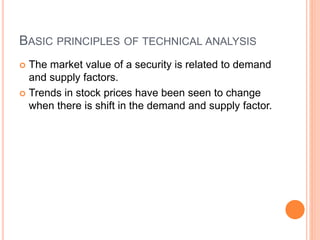
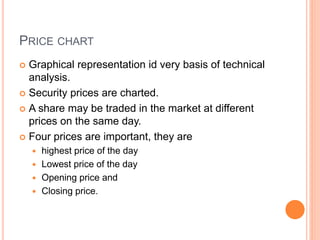
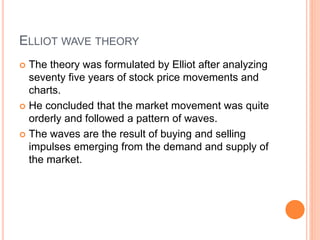
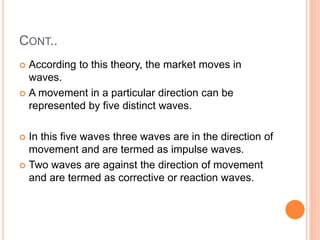
TECHNICAL; ANALYSIS
CONCEPT
 Technical analysis is used to mean fairly wide range
of techniques, all based on the concept that past
information on prices and trading volume of stocks
gives a picture of what lies ahead.
 It attempt to explain forecast changes in security
prices by studying only the market data rather than
information about a company.
 The technical analyst believe that the price of a
stock depends on supply and demand in the market
place.
CON..
 Technical analyst concentrate the movement of
share prices.
 Forecasting technique that utilize historical share
price data.
SEVERAL WAYS THE TECHNICIAN THINKS
 Technician believe that behind the fundamental are
important factor
 Technicians are not committed to buy and hold
policy
 Technician do not separate income from capital
gains.
 Technician act more quickly to make commitments
and take profits and losses
 Technician insist that the market always repeats
DOW THEORY
 Formulated by Charles H.Dow
 He formulated a hypothesis that the stock market
does not move on a random basis.
 According to Dow theory the market has three
movements.
 Primary movement, secondary movement and
minor movements.
 The primary movement is the long range cycle that
carries the entire market up or down, this is the long
term trend in the market.
 The secondary reaction act as a restraining force
on the primary movement. These are in opposite
direction to the primary movement.
 The minor movements which are the day-to-day
fluctuations in the market.
 According to Dow theory the price movements in
the market can be identified by means of line chart.
 In line chart the closing prices of shares or the
closing values of market index may be plotted
against the corresponding trading day.
 Bullish trend
 In the first phase the prices would advance with the
revival of confidence in the future of business.
 This will prompt the investor to buy shares of
companies.
 Bearish trend
 In the first phase prices begin to fall due to
abandonment of hopes.
 Second phase companies start lower profit
 Third phase, prices fall still further due to distress
selling.
BASIC PRINCIPLES OF TECHNICAL ANALYSIS
 The market value of a security is related to demand
and supply factors.
 Trends in stock prices have been seen to change
when there is shift in the demand and supply factor.
PRICE CHART
 Graphical representation id very basis of technical
analysis.
 Security prices are charted.
 A share may be traded in the market at different
prices on the same day.
 Four prices are important, they are
 highest price of the day
 Lowest price of the day
 Opening price and
 Closing price.
BHARTI INFRA- MARKET PRICE MOVEMENT
Date
Open
Price
High
Price
Low
Price
Last
Traded
Price
Close
Price
28-Dec-12 200 200.85 188.65 191 191.65
31-Dec-12 191.85 195.5 188.25 193.65 193.7
1-Jan-13 194.7 199.8 194 197.65 197.75
2-Jan-13 198.3 204.35 197 202.2 201.5
3-Jan-13 200 206.5 200 204.7 204.35
4-Jan-13 205 210 202.35 207 207.15
7-Jan-13 207.85 209 206.1 207 207.4
8-Jan-13 207.55 211.05 201.7 203.2 202.95
9-Jan-13 204.25 207.9 203.3 204.95 205.05
10-Jan-13 205 207 203 205 205.1
Source :www.nseindia.com
CONT..
 The closing price is very important price because
that is used in most analysis.
 The prices are plotted in XY graph, where X
represent trading days and Y axis represent the
prices.
CONT..
180
185
190
195
200
205
210
Bharti Infra- price movement
Series1
PRICE CHARTS
 Line Chart
 Bar chart
 Japanese Candlestick Chart
LINE CHART
 The closing price of a share is plotted on the XV
graph on a day to day basis.
 The closing price of each day would be represented
by point on XY graph.
 All these points would be connected by a straight
line would indicate the trend of the market.
BAR CHART
In this chart the highest, lowest and closing price of each
day are plotted.
A bar is formed by joining the highest and the lowest price
of a particular day by a vertical line.
The top of the bar represent highest price of the day, the
bottom of the bar represent the lowest price of the
day.
A small horizontal hash on the right of the bar is used to
represent the closing price of the day
CHART TYPES – BAR CHART
 Vertical line represents highs/lows of the day
 Horizontal line represents closing price
 Red = down
 Blue/Black = up
Daily High
Daily Low
Closing Price
Price Gap
JAPANESE CANDLESTICK CHART
 This chart shows the highest, lowest price, opening
price and closing price of shares on a day-to-day
basis.
 The highest price and lowest price of a day are
joined by a vertical bar.
 The opening and closing price of the day which
would fall between the highest and lowest prices
which is represented by a rectangle.
 Three types of candlesticks,
 White candle stick
 Black candle stick and
 Doji candlestick
CON..
 A white candlestick is used to represent a situation
where the closing price of the day is higher than the
opening price.
 A black candlestick represents the closing price of
the day is lower than the opening price.
 A Doji candlestick is the one where the opening and
closing price of the day is same.
ELLIOT WAVE THEORY
 The theory was formulated by Elliot after analyzing
seventy five years of stock price movements and
charts.
 He concluded that the market movement was quite
orderly and followed a pattern of waves.
 The waves are the result of buying and selling
impulses emerging from the demand and supply of
the market.
CONT..
 According to this theory, the market moves in
waves.
 A movement in a particular direction can be
represented by five distinct waves.
 In this five waves three waves are in the direction of
movement and are termed as impulse waves.
 Two waves are against the direction of movement
and are termed as corrective or reaction waves.

Technical analysis

  • 1.
  • 2.
    CONCEPT  Technical analysisis used to mean fairly wide range of techniques, all based on the concept that past information on prices and trading volume of stocks gives a picture of what lies ahead.  It attempt to explain forecast changes in security prices by studying only the market data rather than information about a company.  The technical analyst believe that the price of a stock depends on supply and demand in the market place.
  • 3.
    CON..  Technical analystconcentrate the movement of share prices.  Forecasting technique that utilize historical share price data.
  • 4.
    SEVERAL WAYS THETECHNICIAN THINKS  Technician believe that behind the fundamental are important factor  Technicians are not committed to buy and hold policy  Technician do not separate income from capital gains.  Technician act more quickly to make commitments and take profits and losses  Technician insist that the market always repeats
  • 5.
    DOW THEORY  Formulatedby Charles H.Dow  He formulated a hypothesis that the stock market does not move on a random basis.  According to Dow theory the market has three movements.  Primary movement, secondary movement and minor movements.
  • 6.
     The primarymovement is the long range cycle that carries the entire market up or down, this is the long term trend in the market.  The secondary reaction act as a restraining force on the primary movement. These are in opposite direction to the primary movement.  The minor movements which are the day-to-day fluctuations in the market.  According to Dow theory the price movements in the market can be identified by means of line chart.
  • 7.
     In linechart the closing prices of shares or the closing values of market index may be plotted against the corresponding trading day.
  • 8.
     Bullish trend In the first phase the prices would advance with the revival of confidence in the future of business.  This will prompt the investor to buy shares of companies.  Bearish trend  In the first phase prices begin to fall due to abandonment of hopes.  Second phase companies start lower profit  Third phase, prices fall still further due to distress selling.
  • 9.
    BASIC PRINCIPLES OFTECHNICAL ANALYSIS  The market value of a security is related to demand and supply factors.  Trends in stock prices have been seen to change when there is shift in the demand and supply factor.
  • 10.
    PRICE CHART  Graphicalrepresentation id very basis of technical analysis.  Security prices are charted.  A share may be traded in the market at different prices on the same day.  Four prices are important, they are  highest price of the day  Lowest price of the day  Opening price and  Closing price.
  • 11.
    BHARTI INFRA- MARKETPRICE MOVEMENT Date Open Price High Price Low Price Last Traded Price Close Price 28-Dec-12 200 200.85 188.65 191 191.65 31-Dec-12 191.85 195.5 188.25 193.65 193.7 1-Jan-13 194.7 199.8 194 197.65 197.75 2-Jan-13 198.3 204.35 197 202.2 201.5 3-Jan-13 200 206.5 200 204.7 204.35 4-Jan-13 205 210 202.35 207 207.15 7-Jan-13 207.85 209 206.1 207 207.4 8-Jan-13 207.55 211.05 201.7 203.2 202.95 9-Jan-13 204.25 207.9 203.3 204.95 205.05 10-Jan-13 205 207 203 205 205.1 Source :www.nseindia.com
  • 12.
    CONT..  The closingprice is very important price because that is used in most analysis.  The prices are plotted in XY graph, where X represent trading days and Y axis represent the prices.
  • 13.
  • 14.
    PRICE CHARTS  LineChart  Bar chart  Japanese Candlestick Chart
  • 15.
    LINE CHART  Theclosing price of a share is plotted on the XV graph on a day to day basis.  The closing price of each day would be represented by point on XY graph.  All these points would be connected by a straight line would indicate the trend of the market.
  • 16.
    BAR CHART In thischart the highest, lowest and closing price of each day are plotted. A bar is formed by joining the highest and the lowest price of a particular day by a vertical line. The top of the bar represent highest price of the day, the bottom of the bar represent the lowest price of the day. A small horizontal hash on the right of the bar is used to represent the closing price of the day
  • 17.
    CHART TYPES –BAR CHART  Vertical line represents highs/lows of the day  Horizontal line represents closing price  Red = down  Blue/Black = up Daily High Daily Low Closing Price Price Gap
  • 18.
    JAPANESE CANDLESTICK CHART This chart shows the highest, lowest price, opening price and closing price of shares on a day-to-day basis.  The highest price and lowest price of a day are joined by a vertical bar.  The opening and closing price of the day which would fall between the highest and lowest prices which is represented by a rectangle.
  • 19.
     Three typesof candlesticks,  White candle stick  Black candle stick and  Doji candlestick
  • 20.
    CON..  A whitecandlestick is used to represent a situation where the closing price of the day is higher than the opening price.  A black candlestick represents the closing price of the day is lower than the opening price.  A Doji candlestick is the one where the opening and closing price of the day is same.
  • 21.
    ELLIOT WAVE THEORY The theory was formulated by Elliot after analyzing seventy five years of stock price movements and charts.  He concluded that the market movement was quite orderly and followed a pattern of waves.  The waves are the result of buying and selling impulses emerging from the demand and supply of the market.
  • 22.
    CONT..  According tothis theory, the market moves in waves.  A movement in a particular direction can be represented by five distinct waves.  In this five waves three waves are in the direction of movement and are termed as impulse waves.  Two waves are against the direction of movement and are termed as corrective or reaction waves.