Downloaded 13,284 times

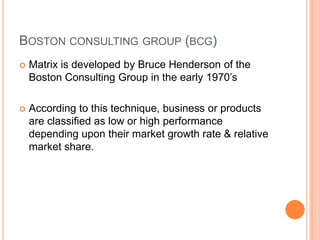


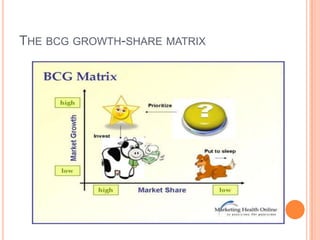
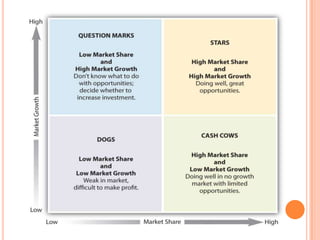
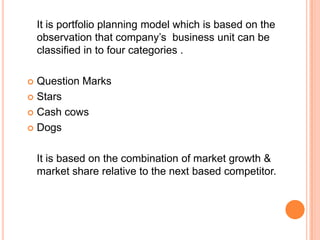

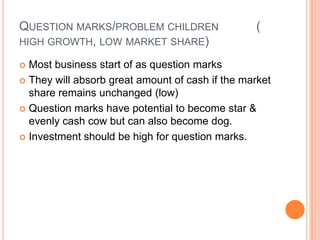
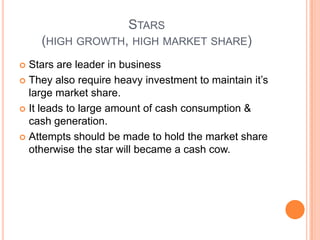
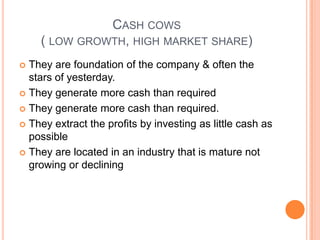
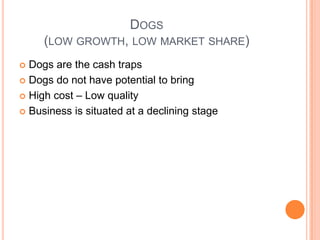
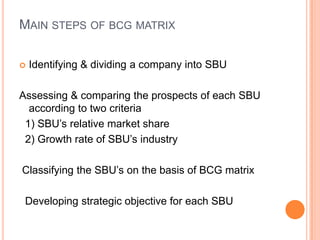


The document discusses the Boston Consulting Group (BCG) Matrix, which classifies business units into four categories based on their relative market share and market growth rate: Question Marks, Stars, Cash Cows, and Dogs. Question Marks have high growth but low market share, requiring high investment. Stars have high growth and market share but also require heavy investment. Cash Cows have low growth but high market share, generating cash with little investment. Dogs have low growth and market share and are cash traps. The BCG Matrix helps assess a product portfolio, cash demands, resource allocation, and divestment decisions.