Download as PPSX, PPTX


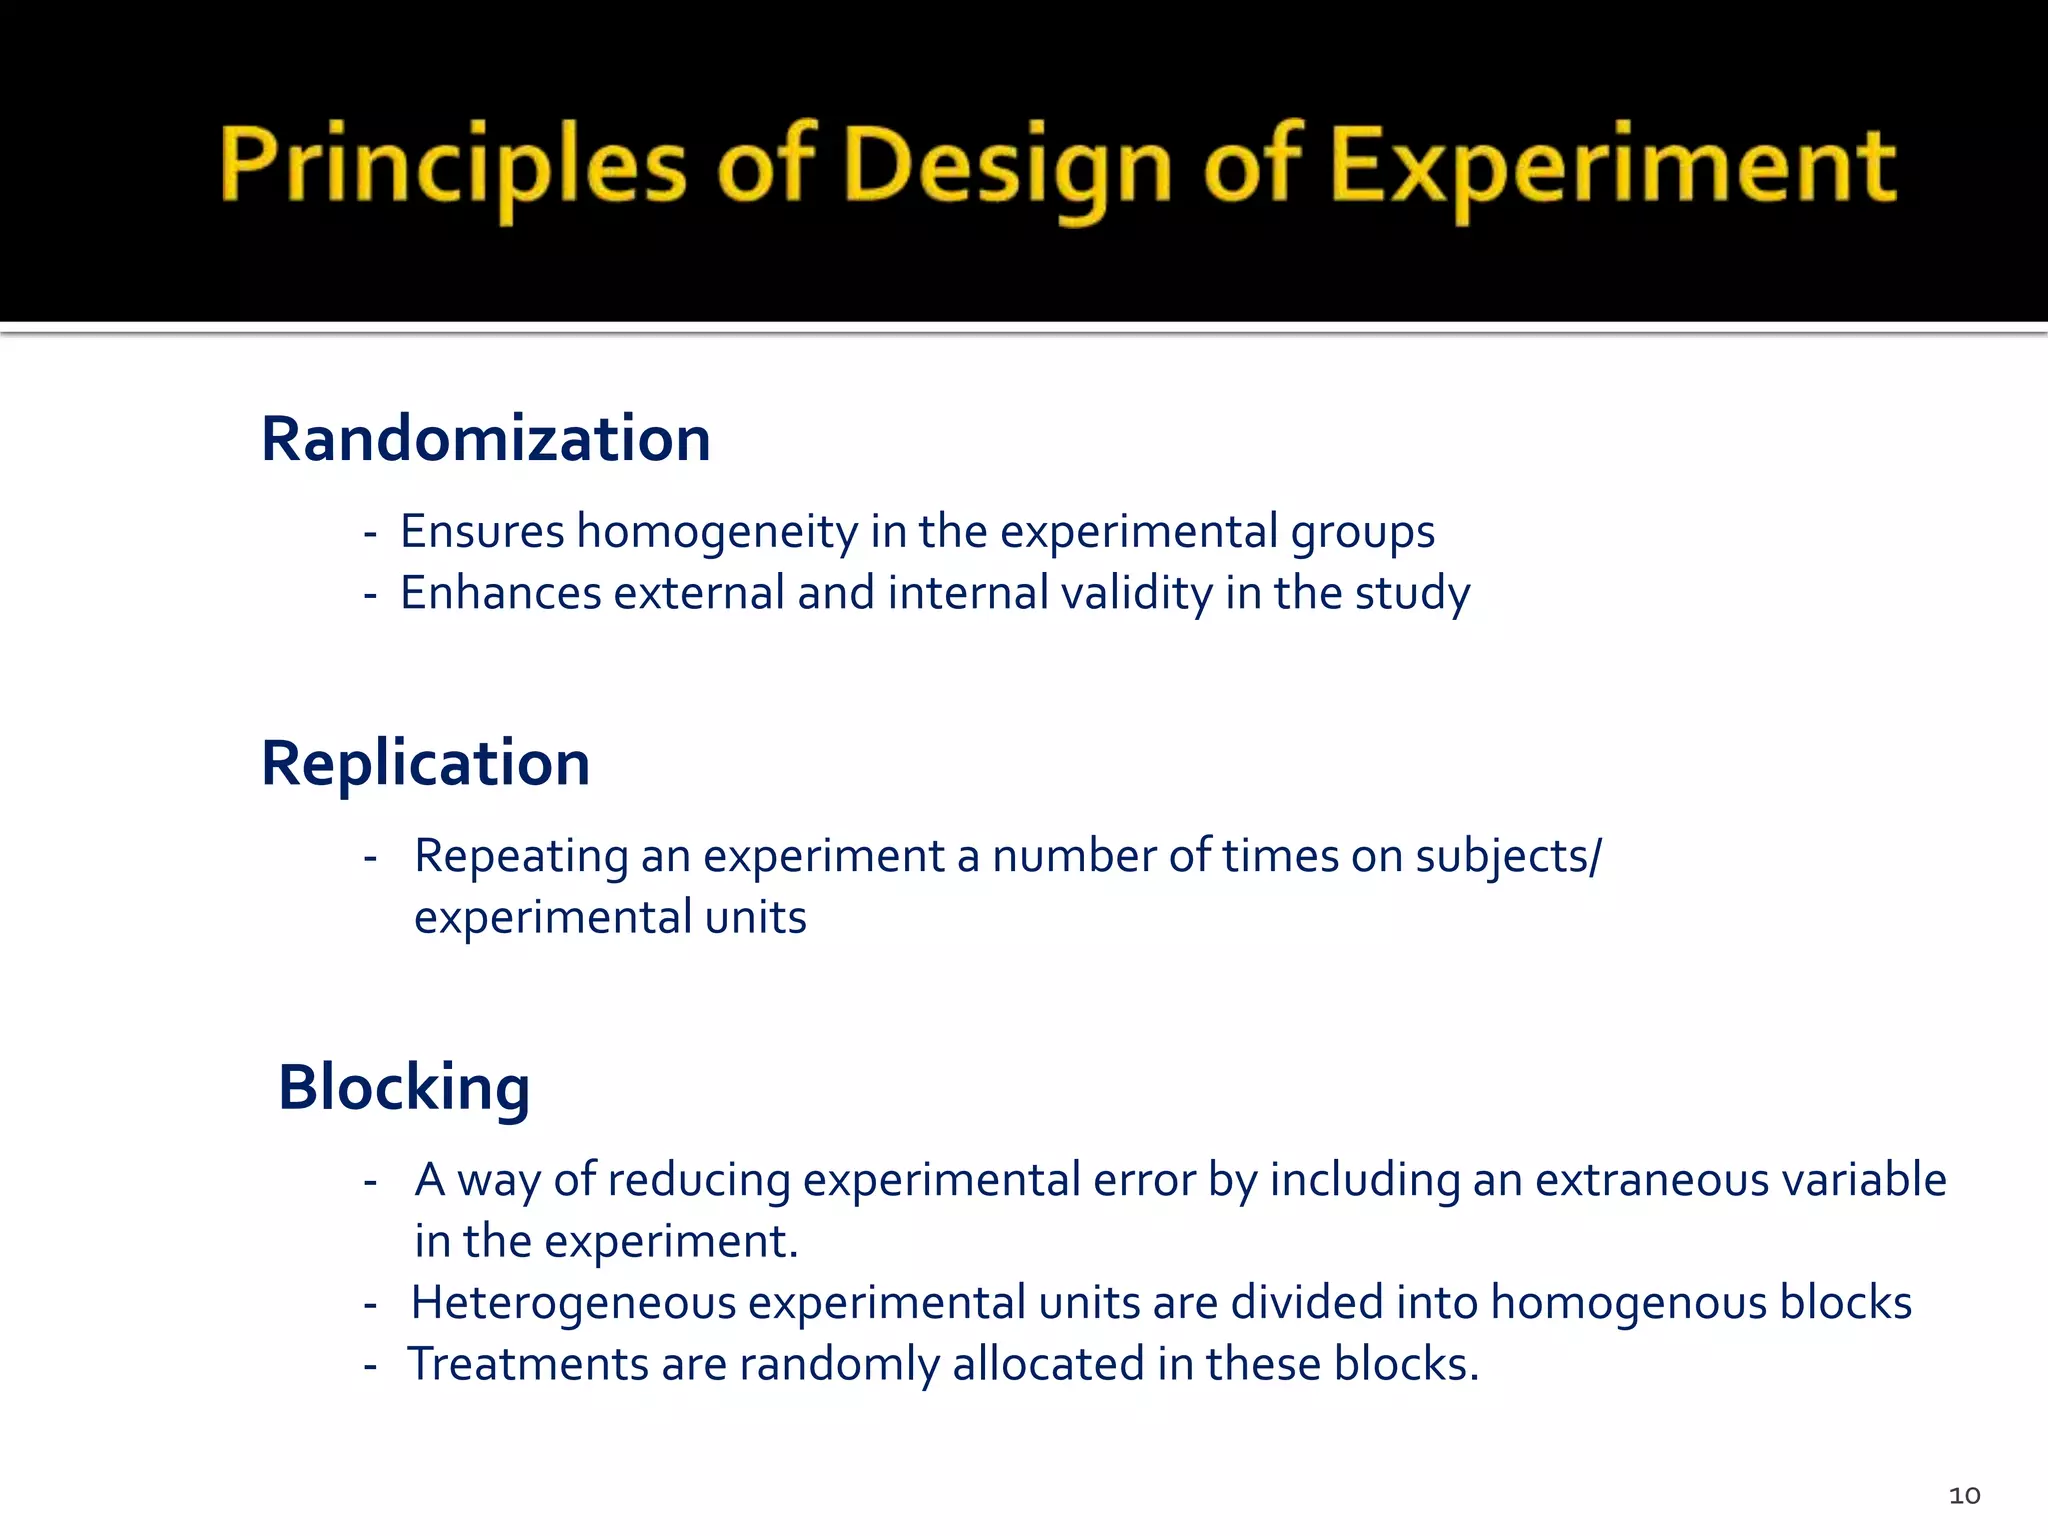
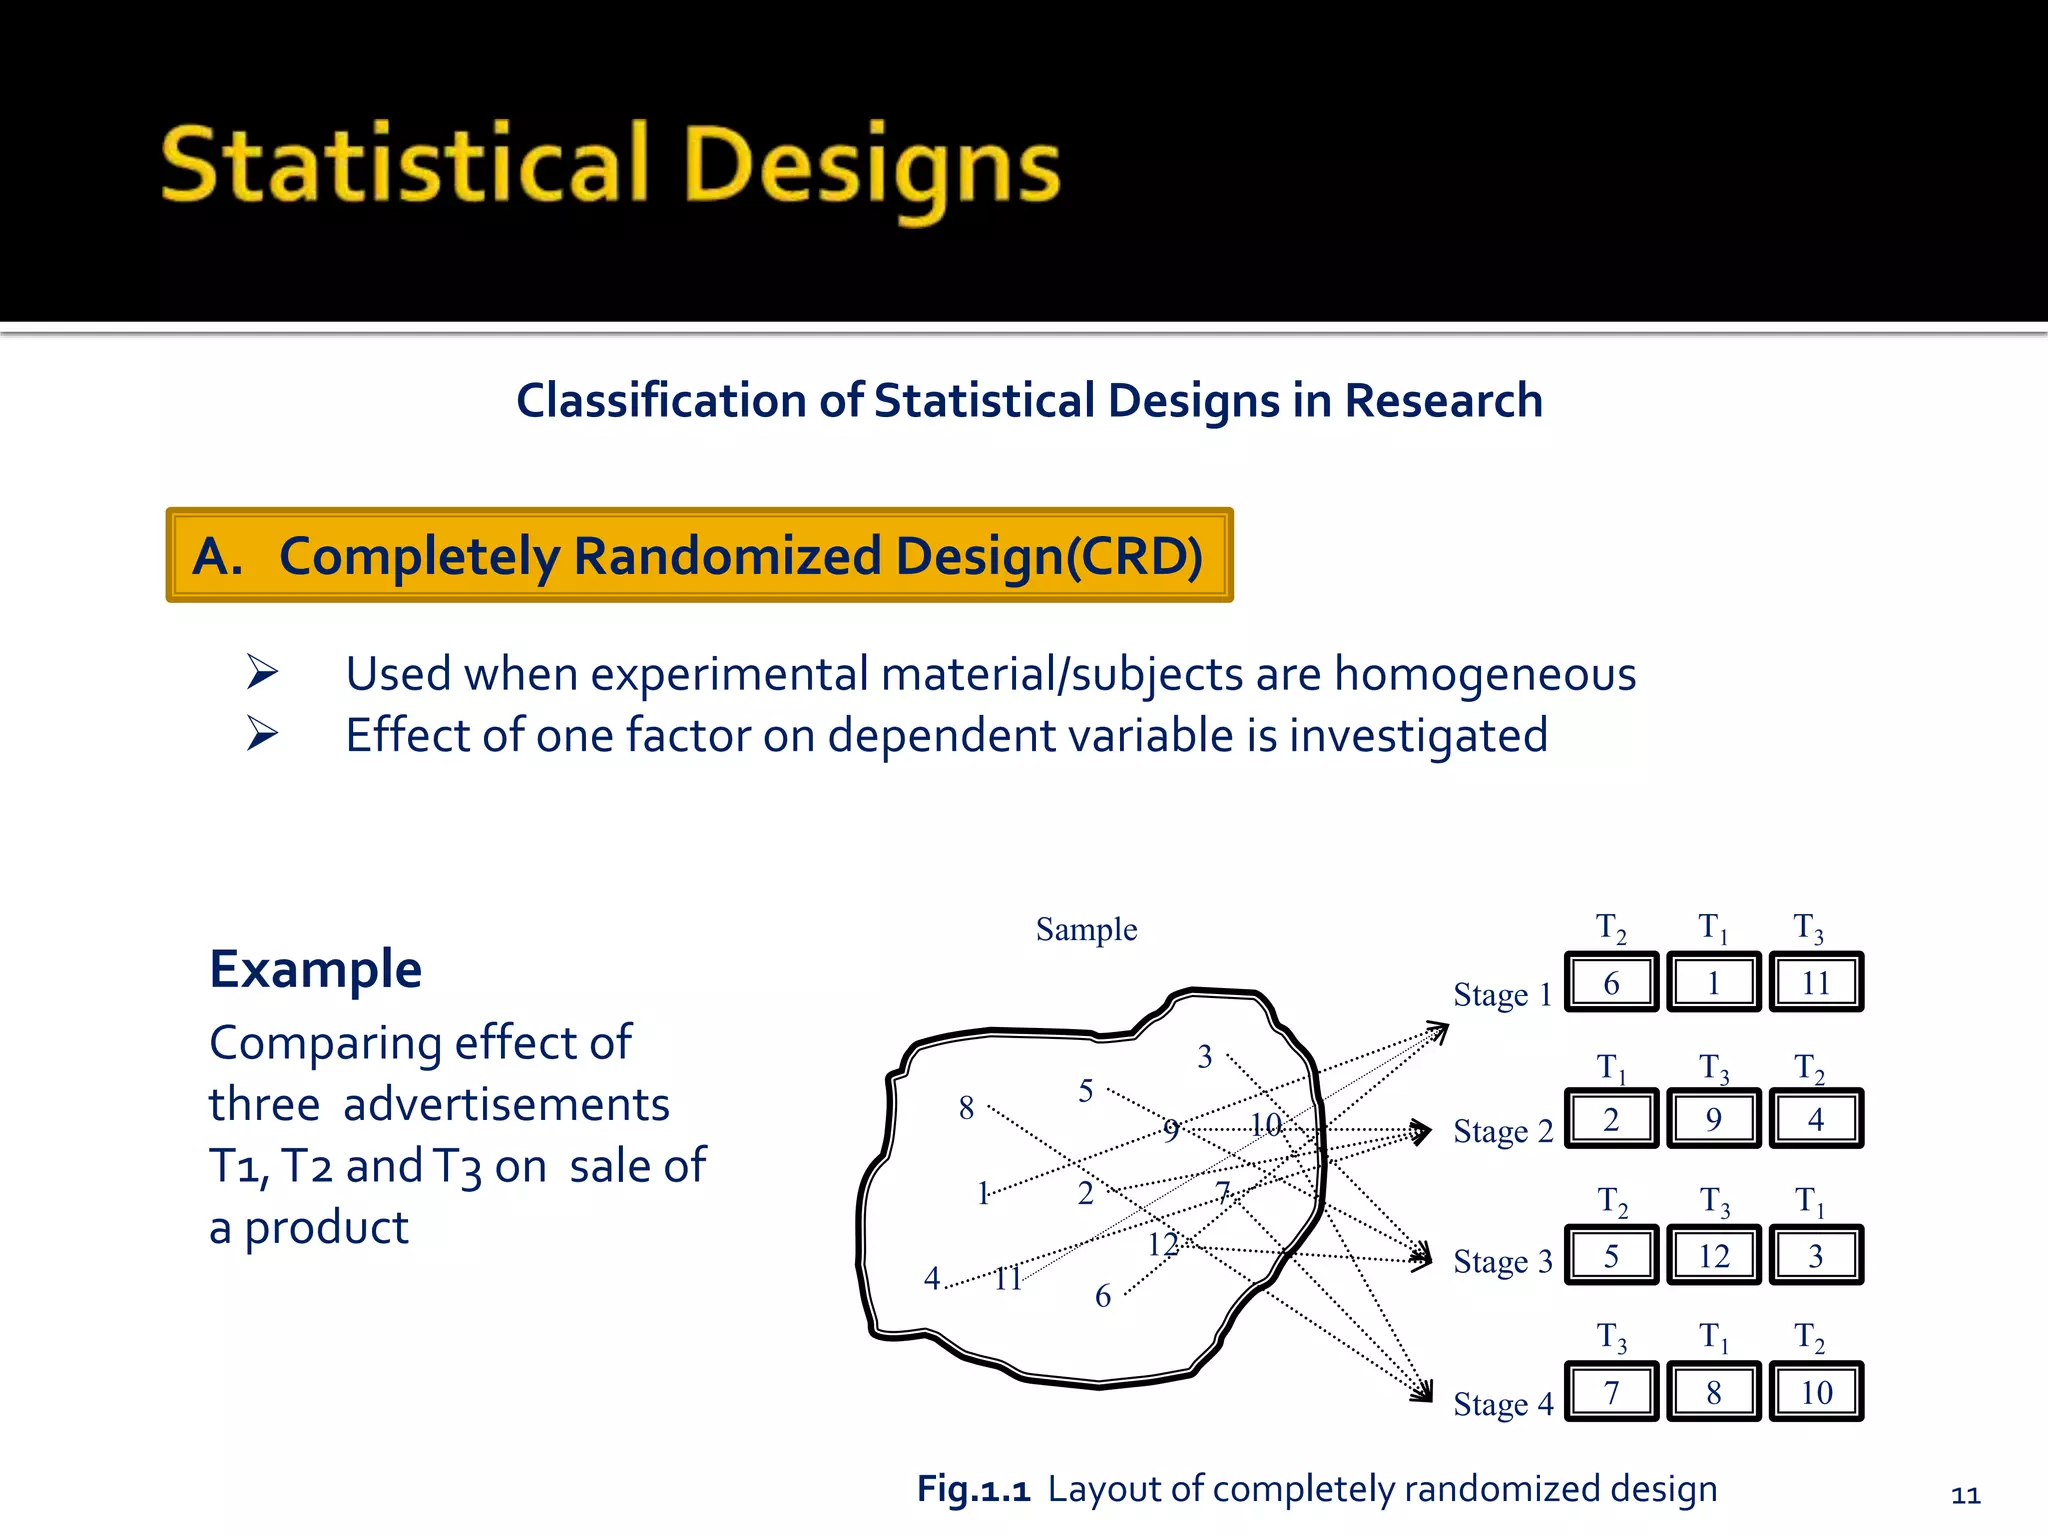

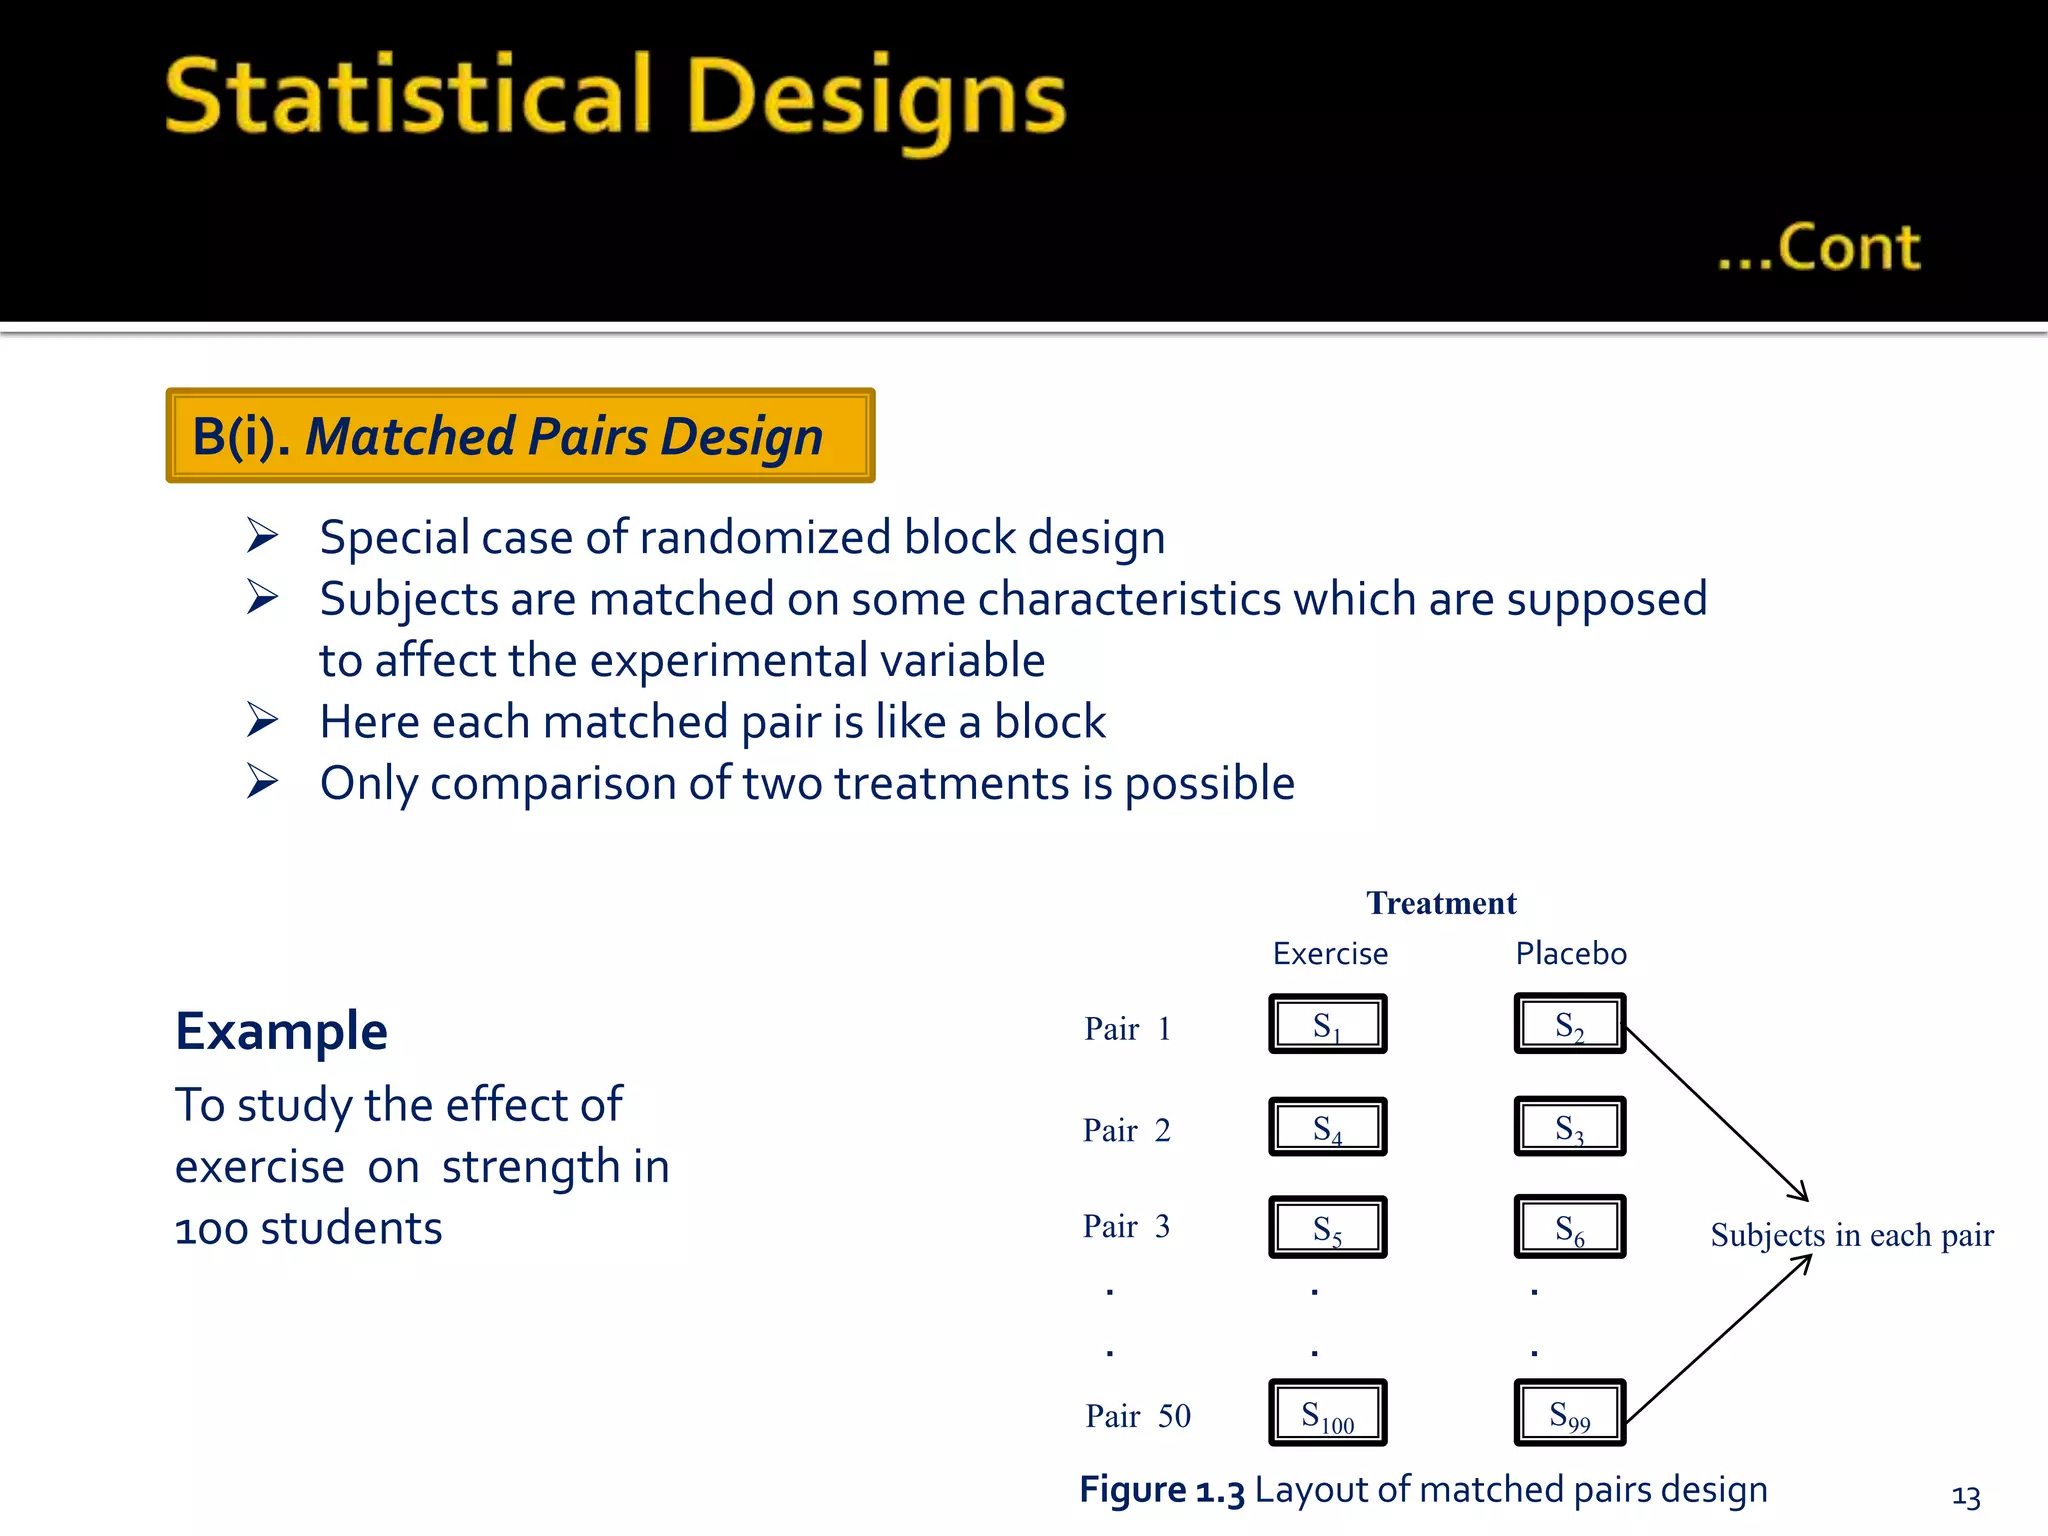
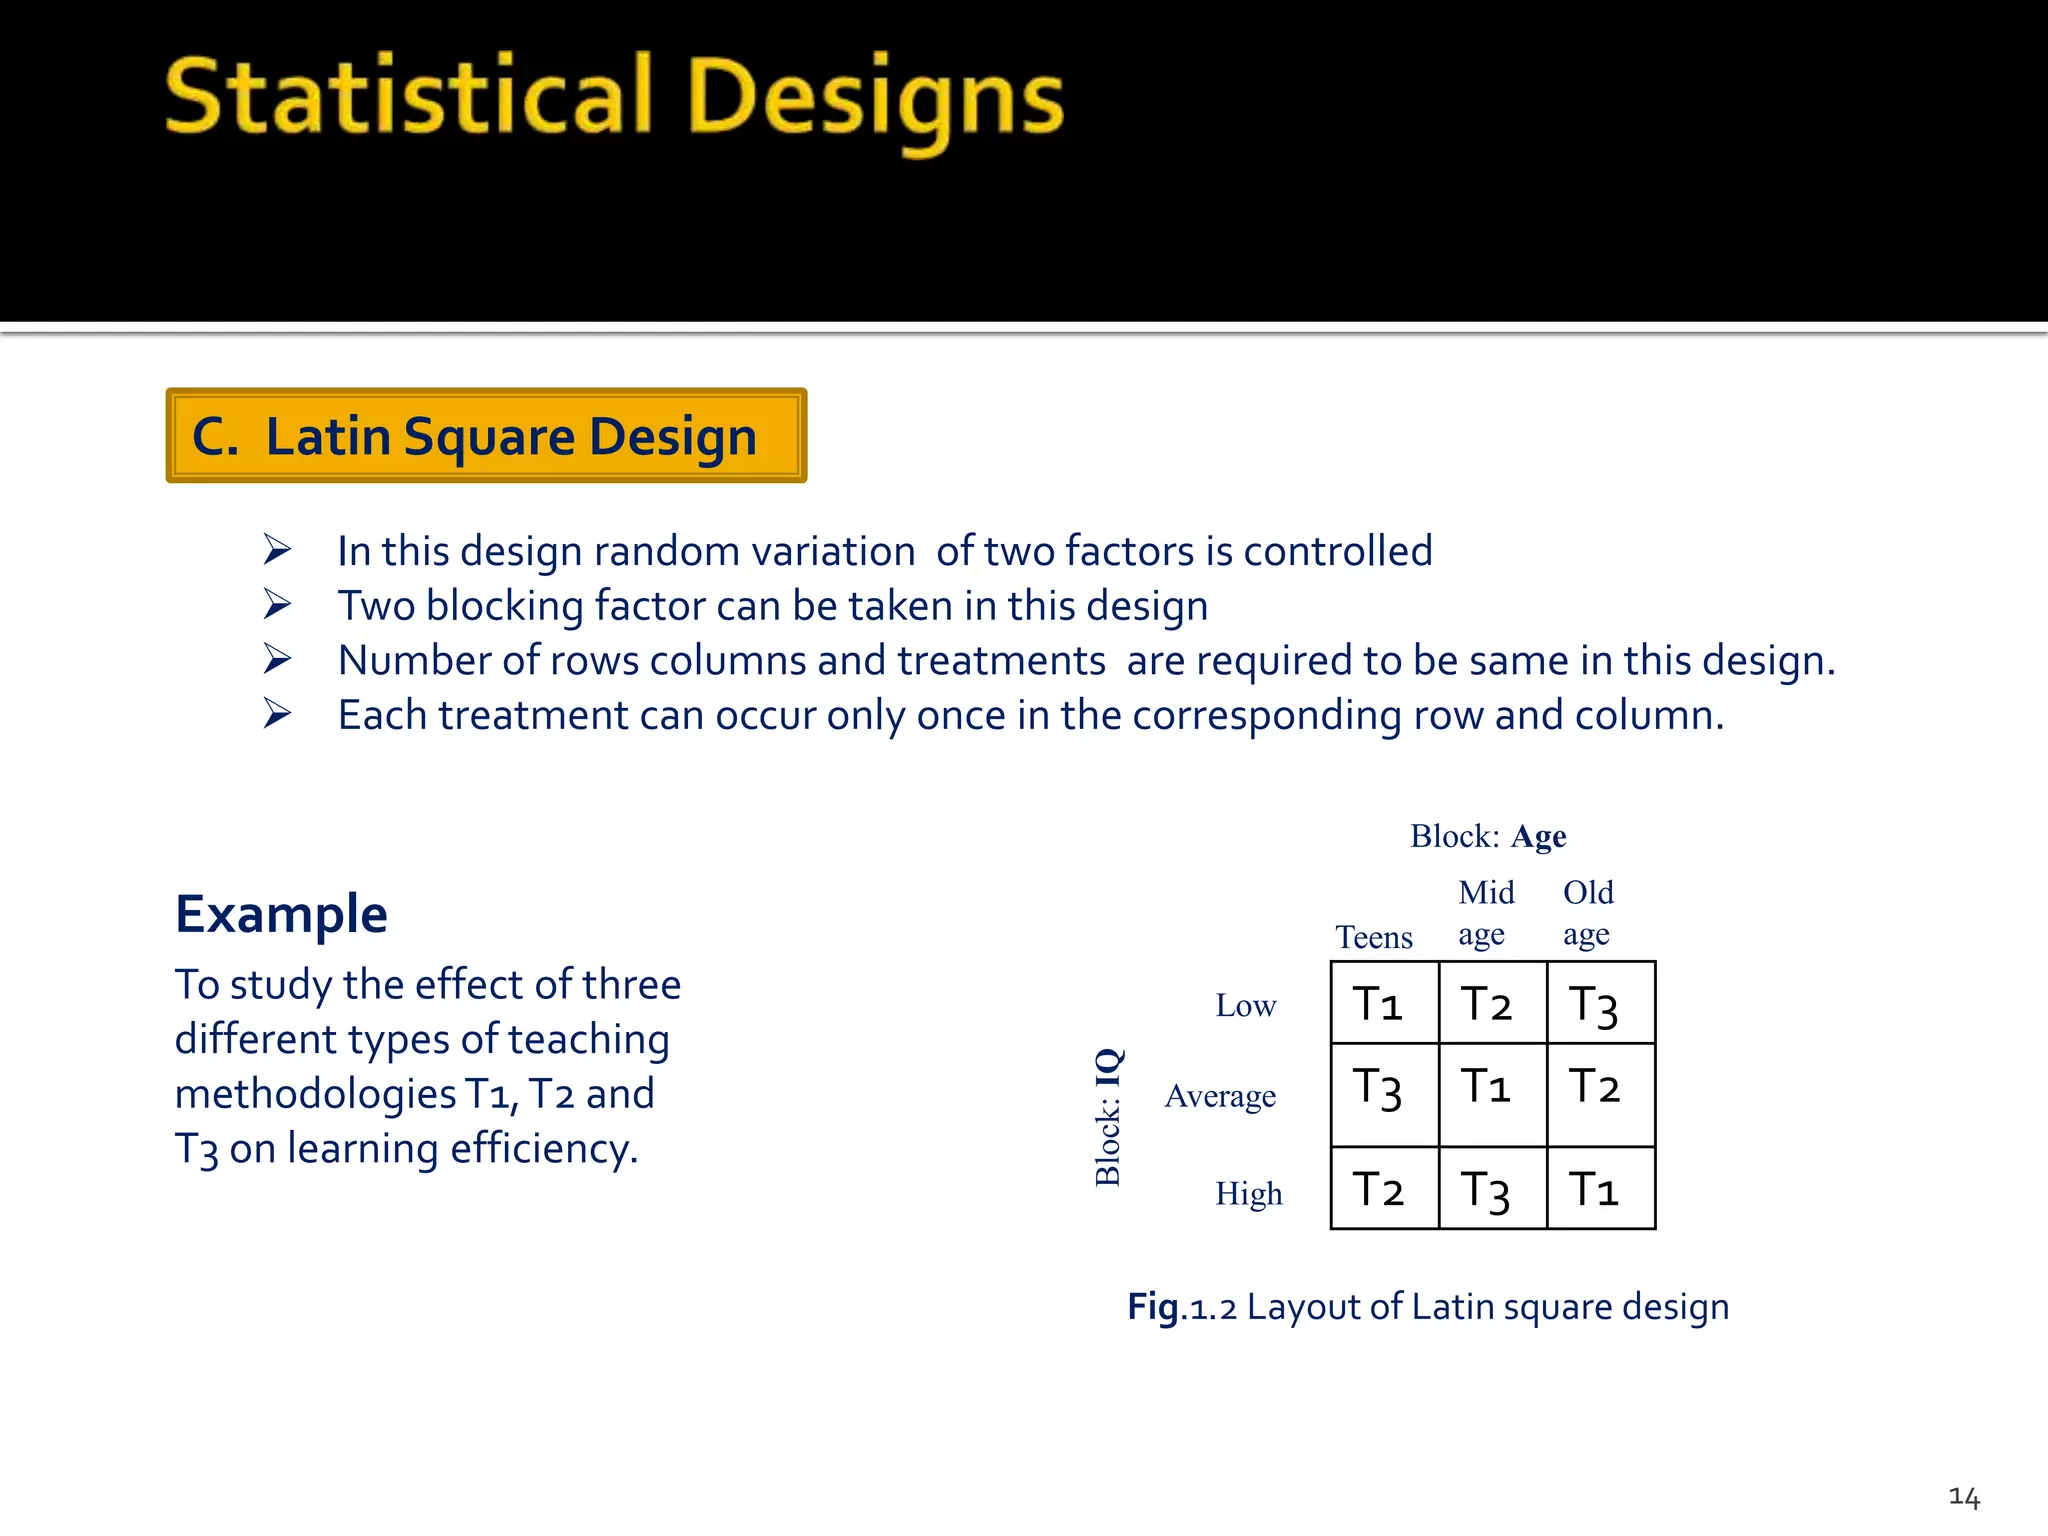

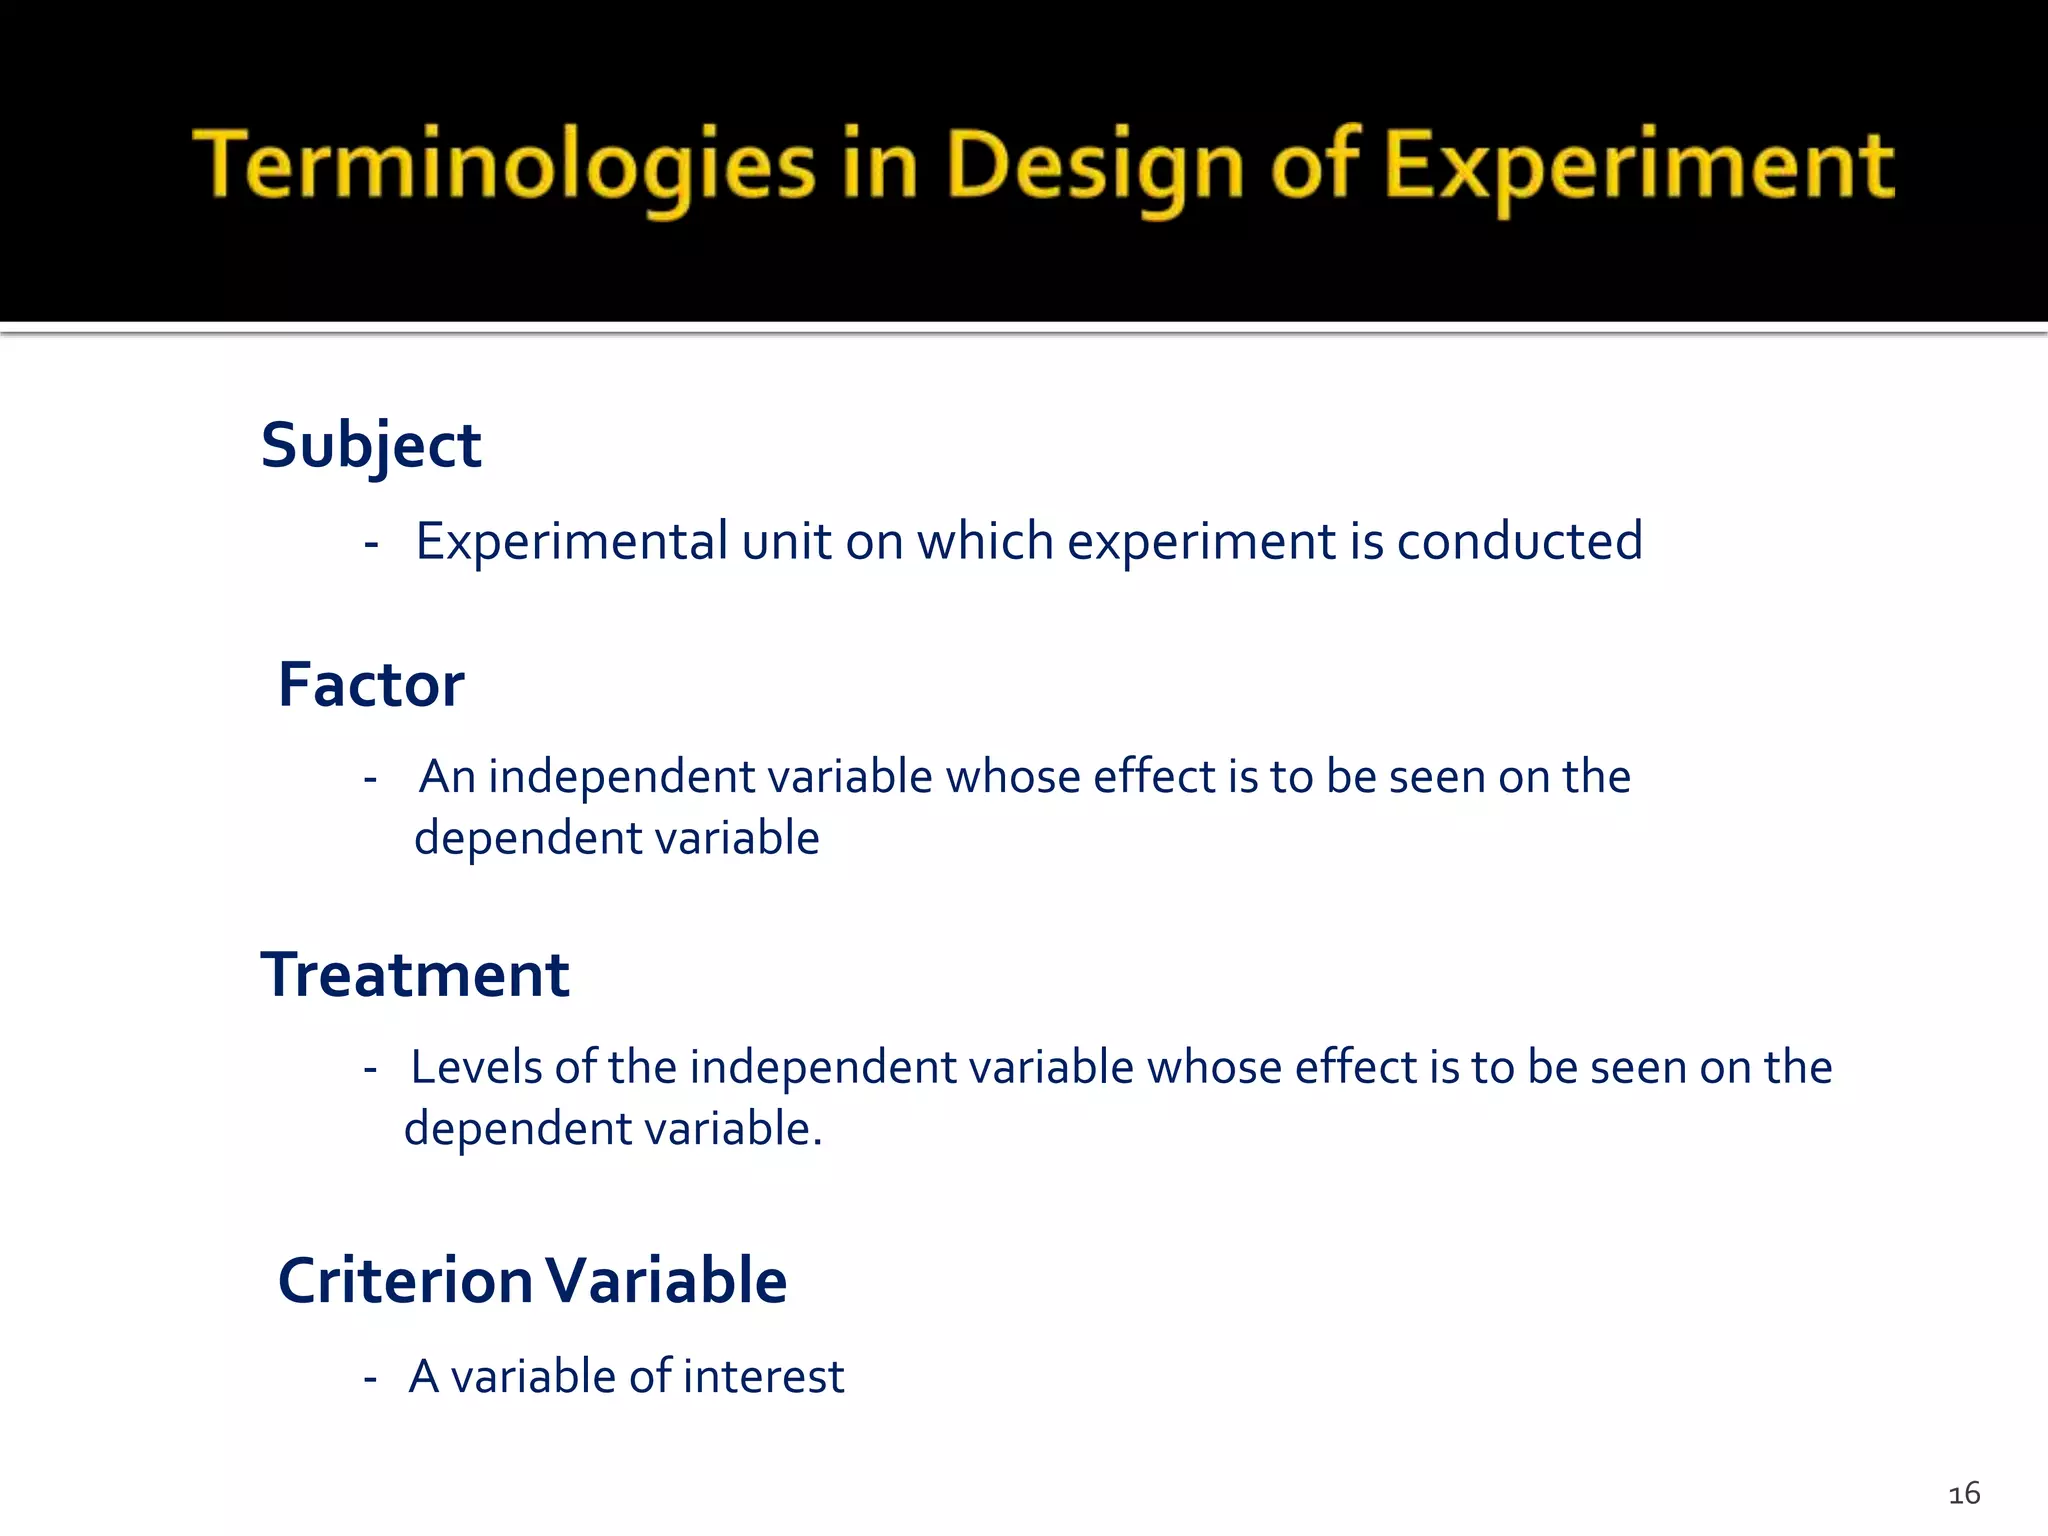
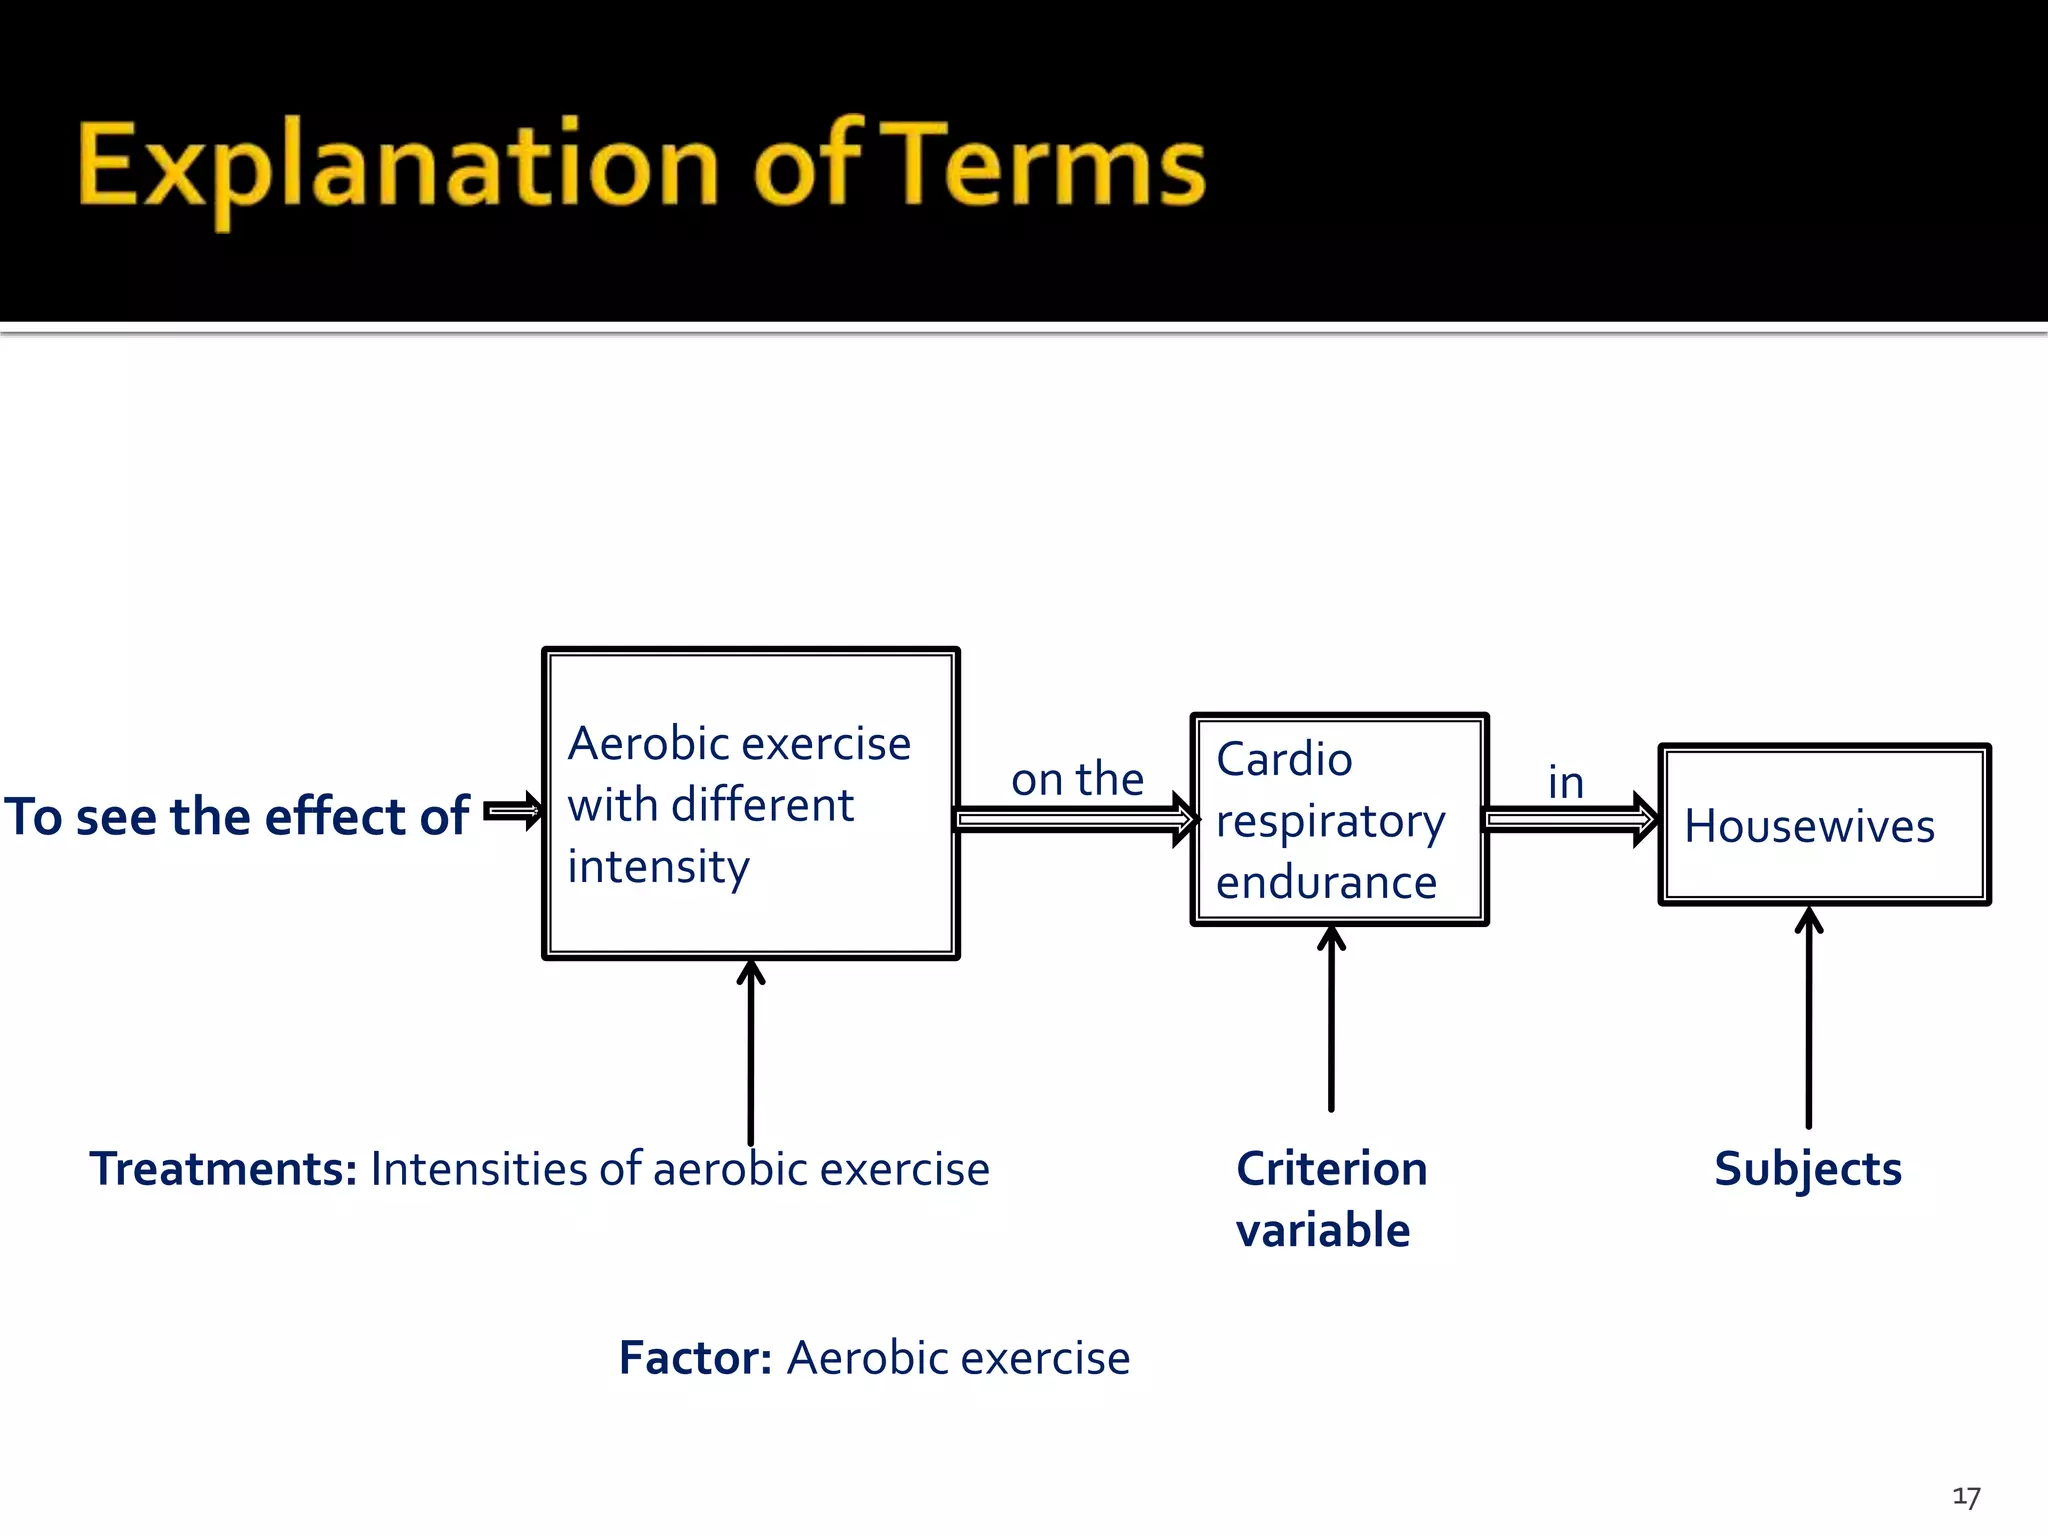
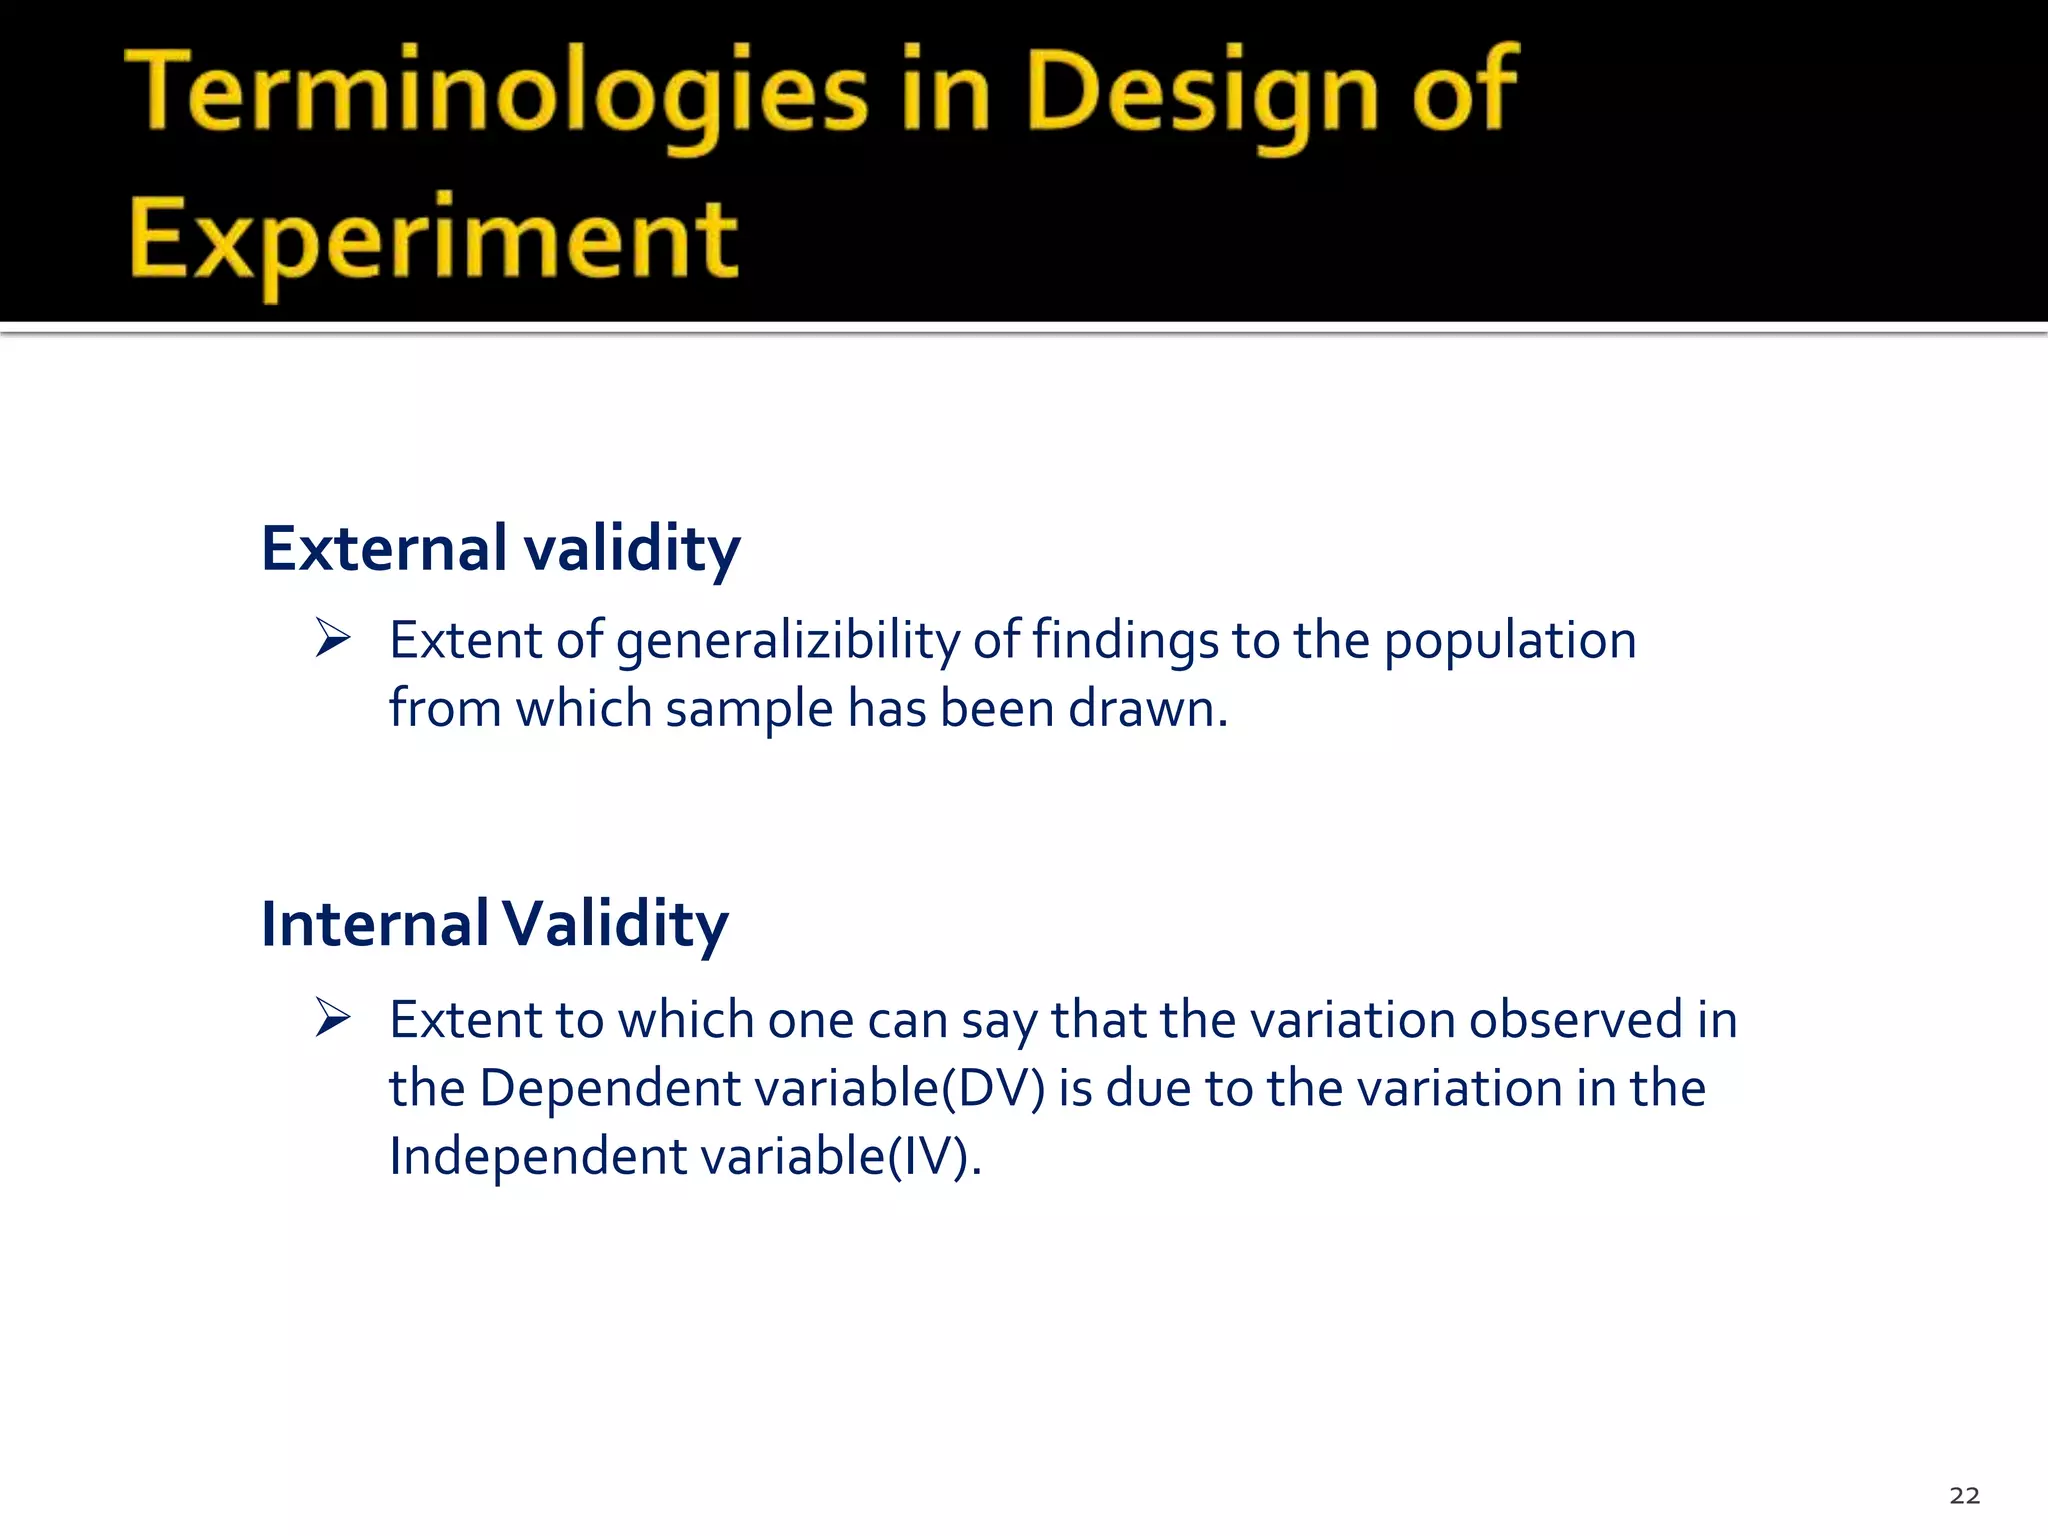
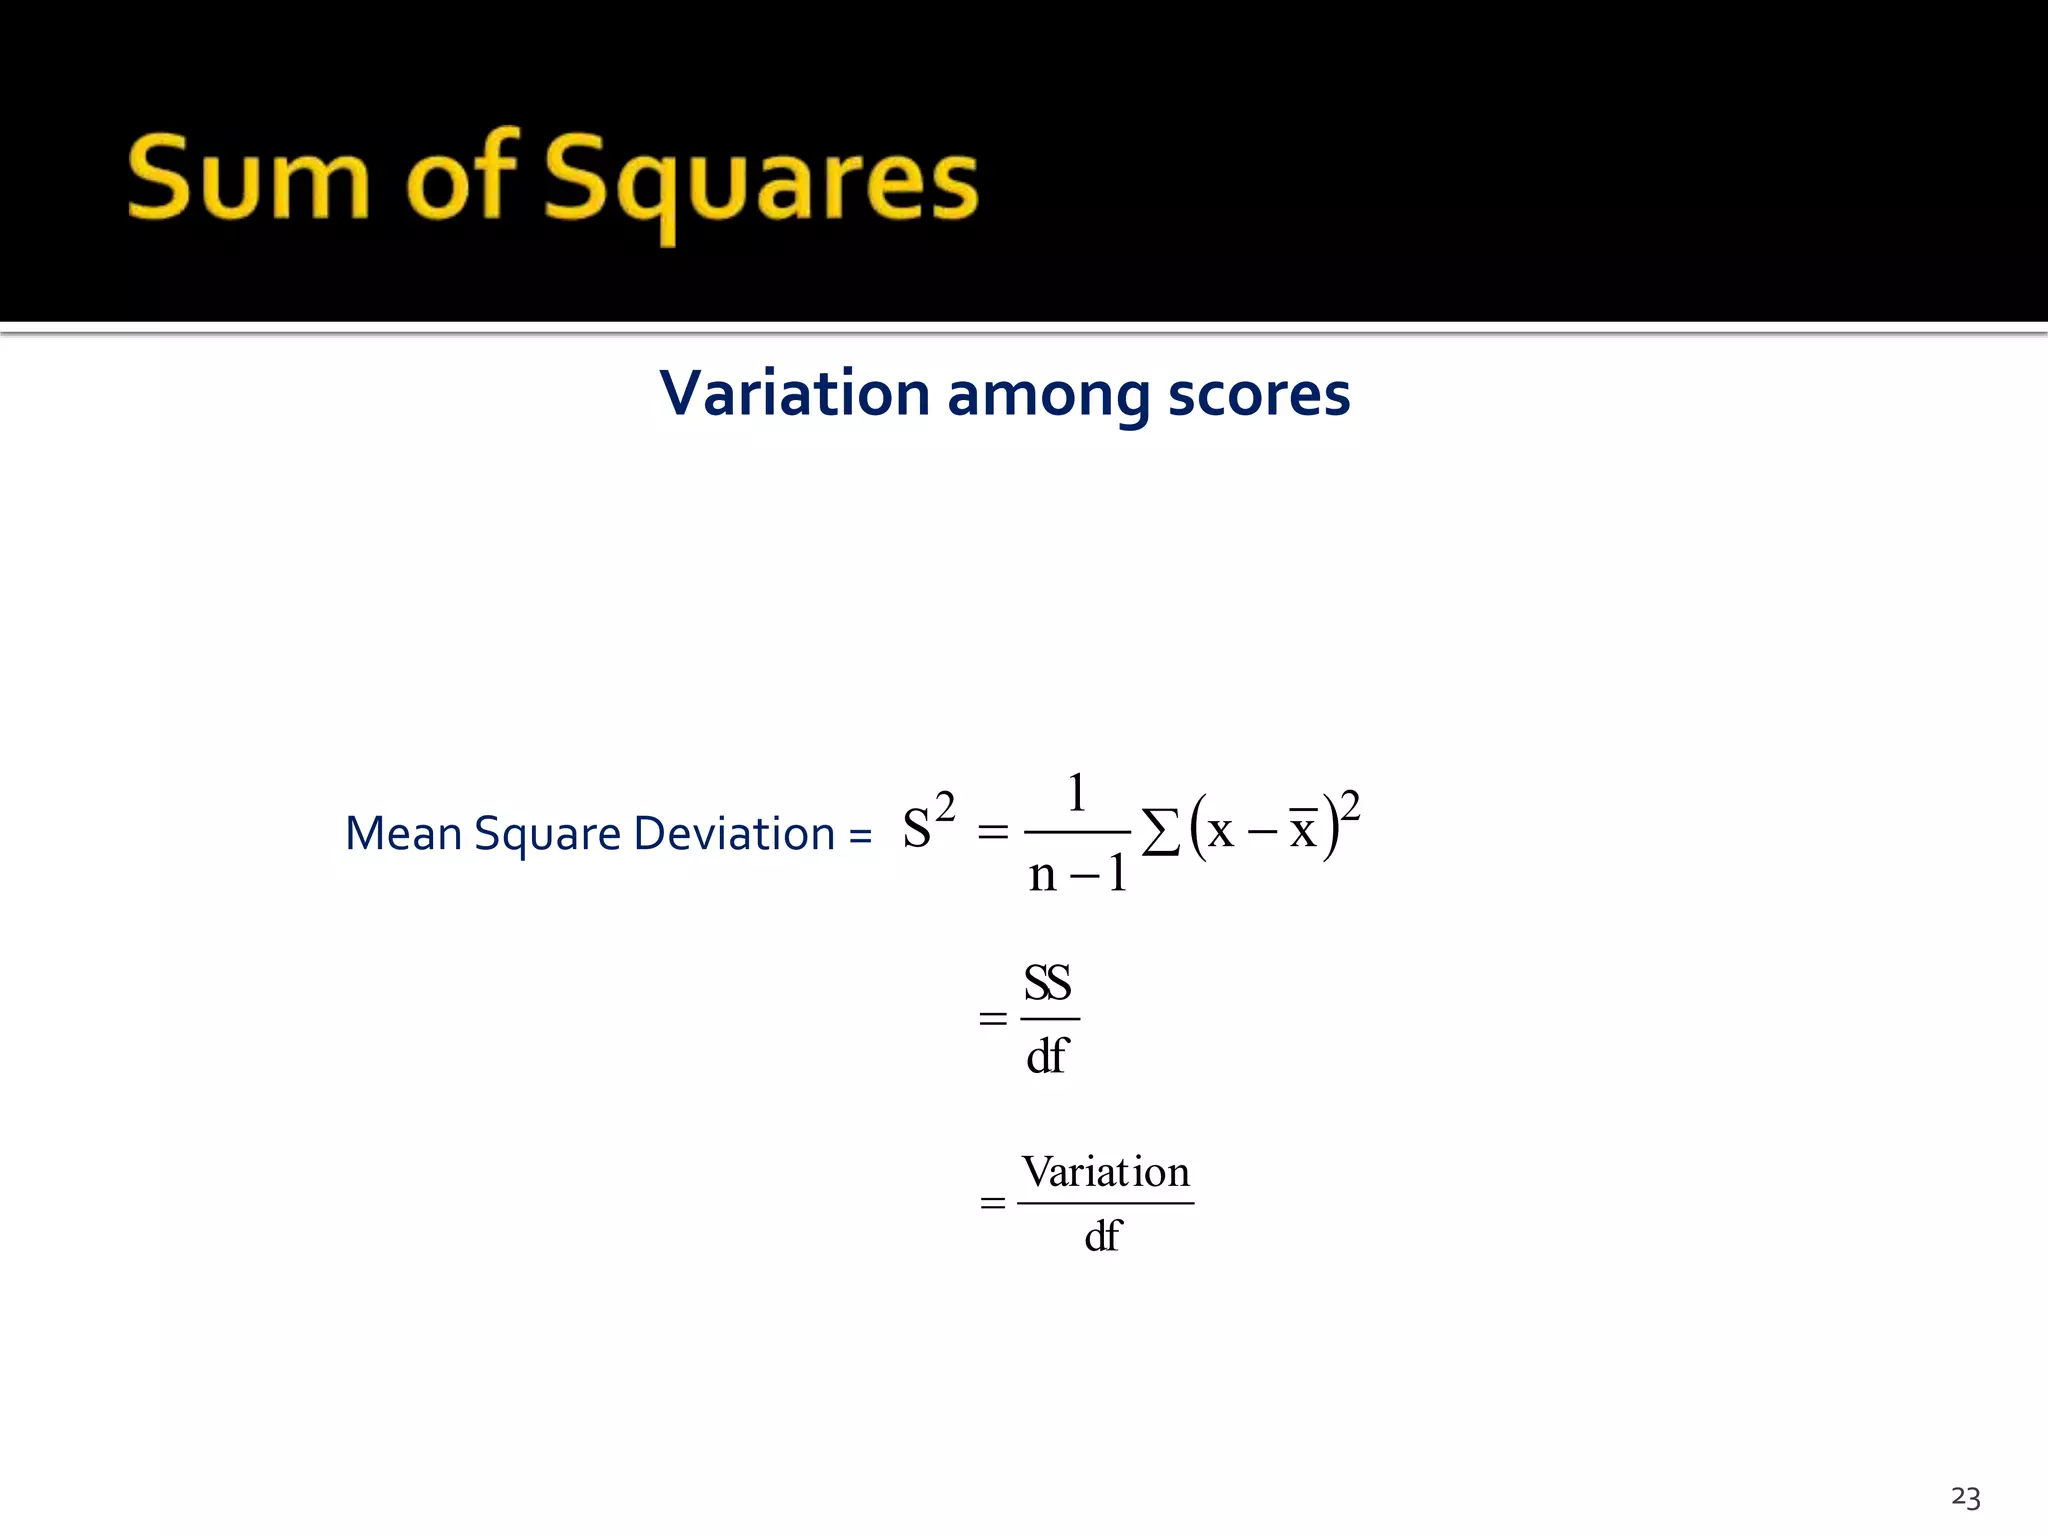
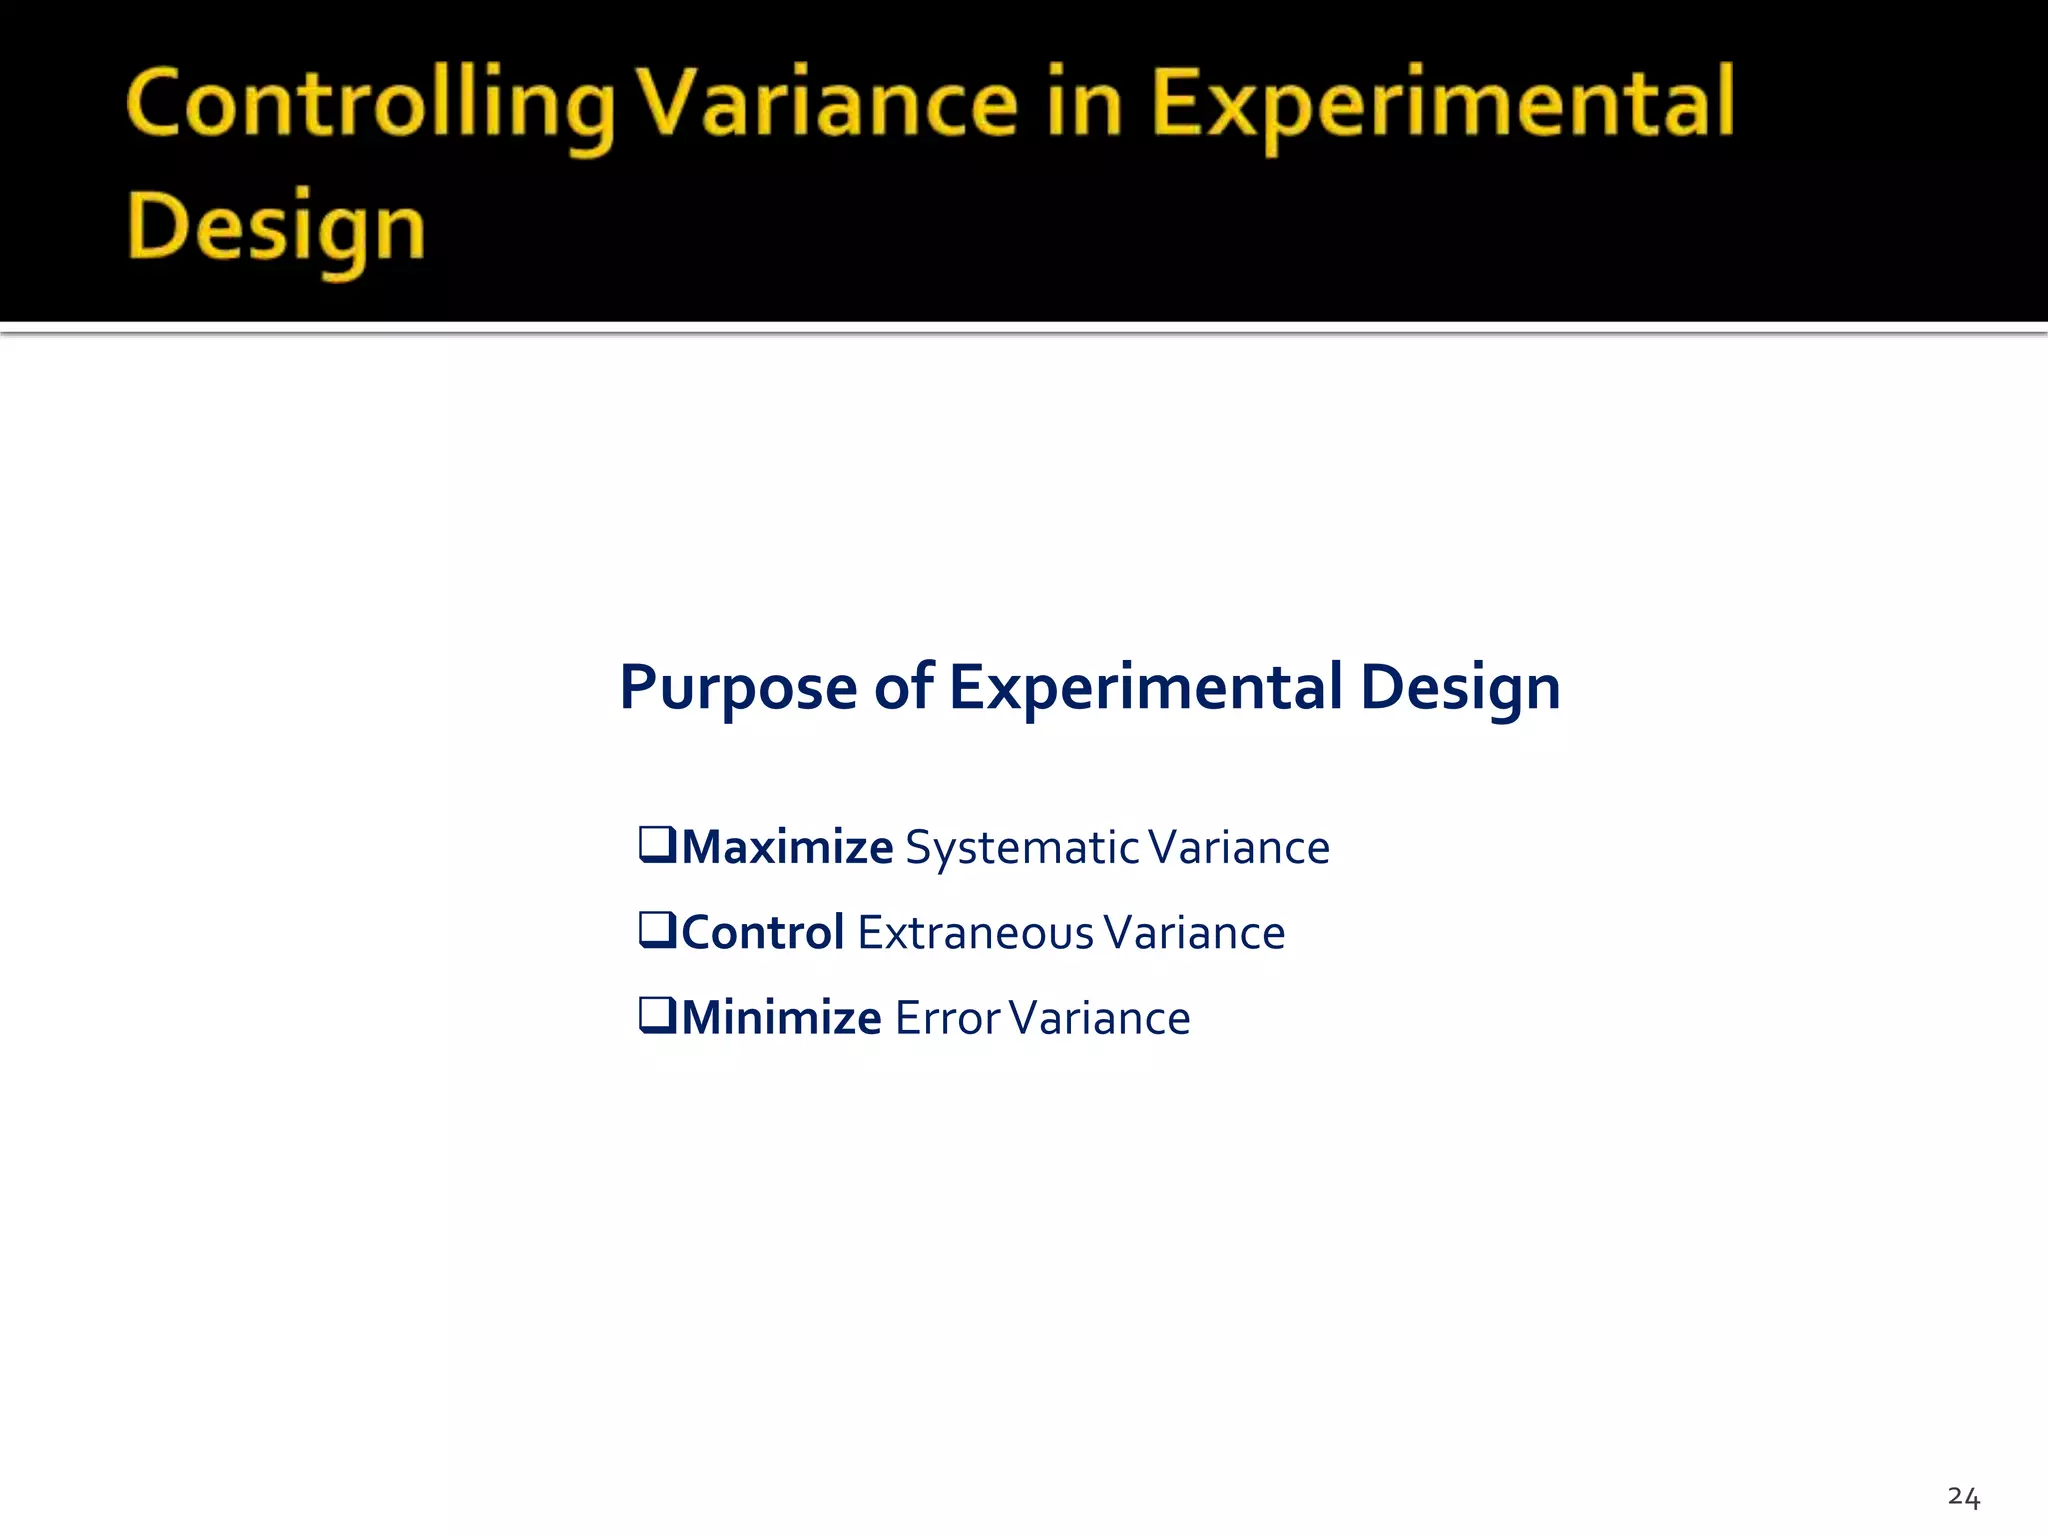
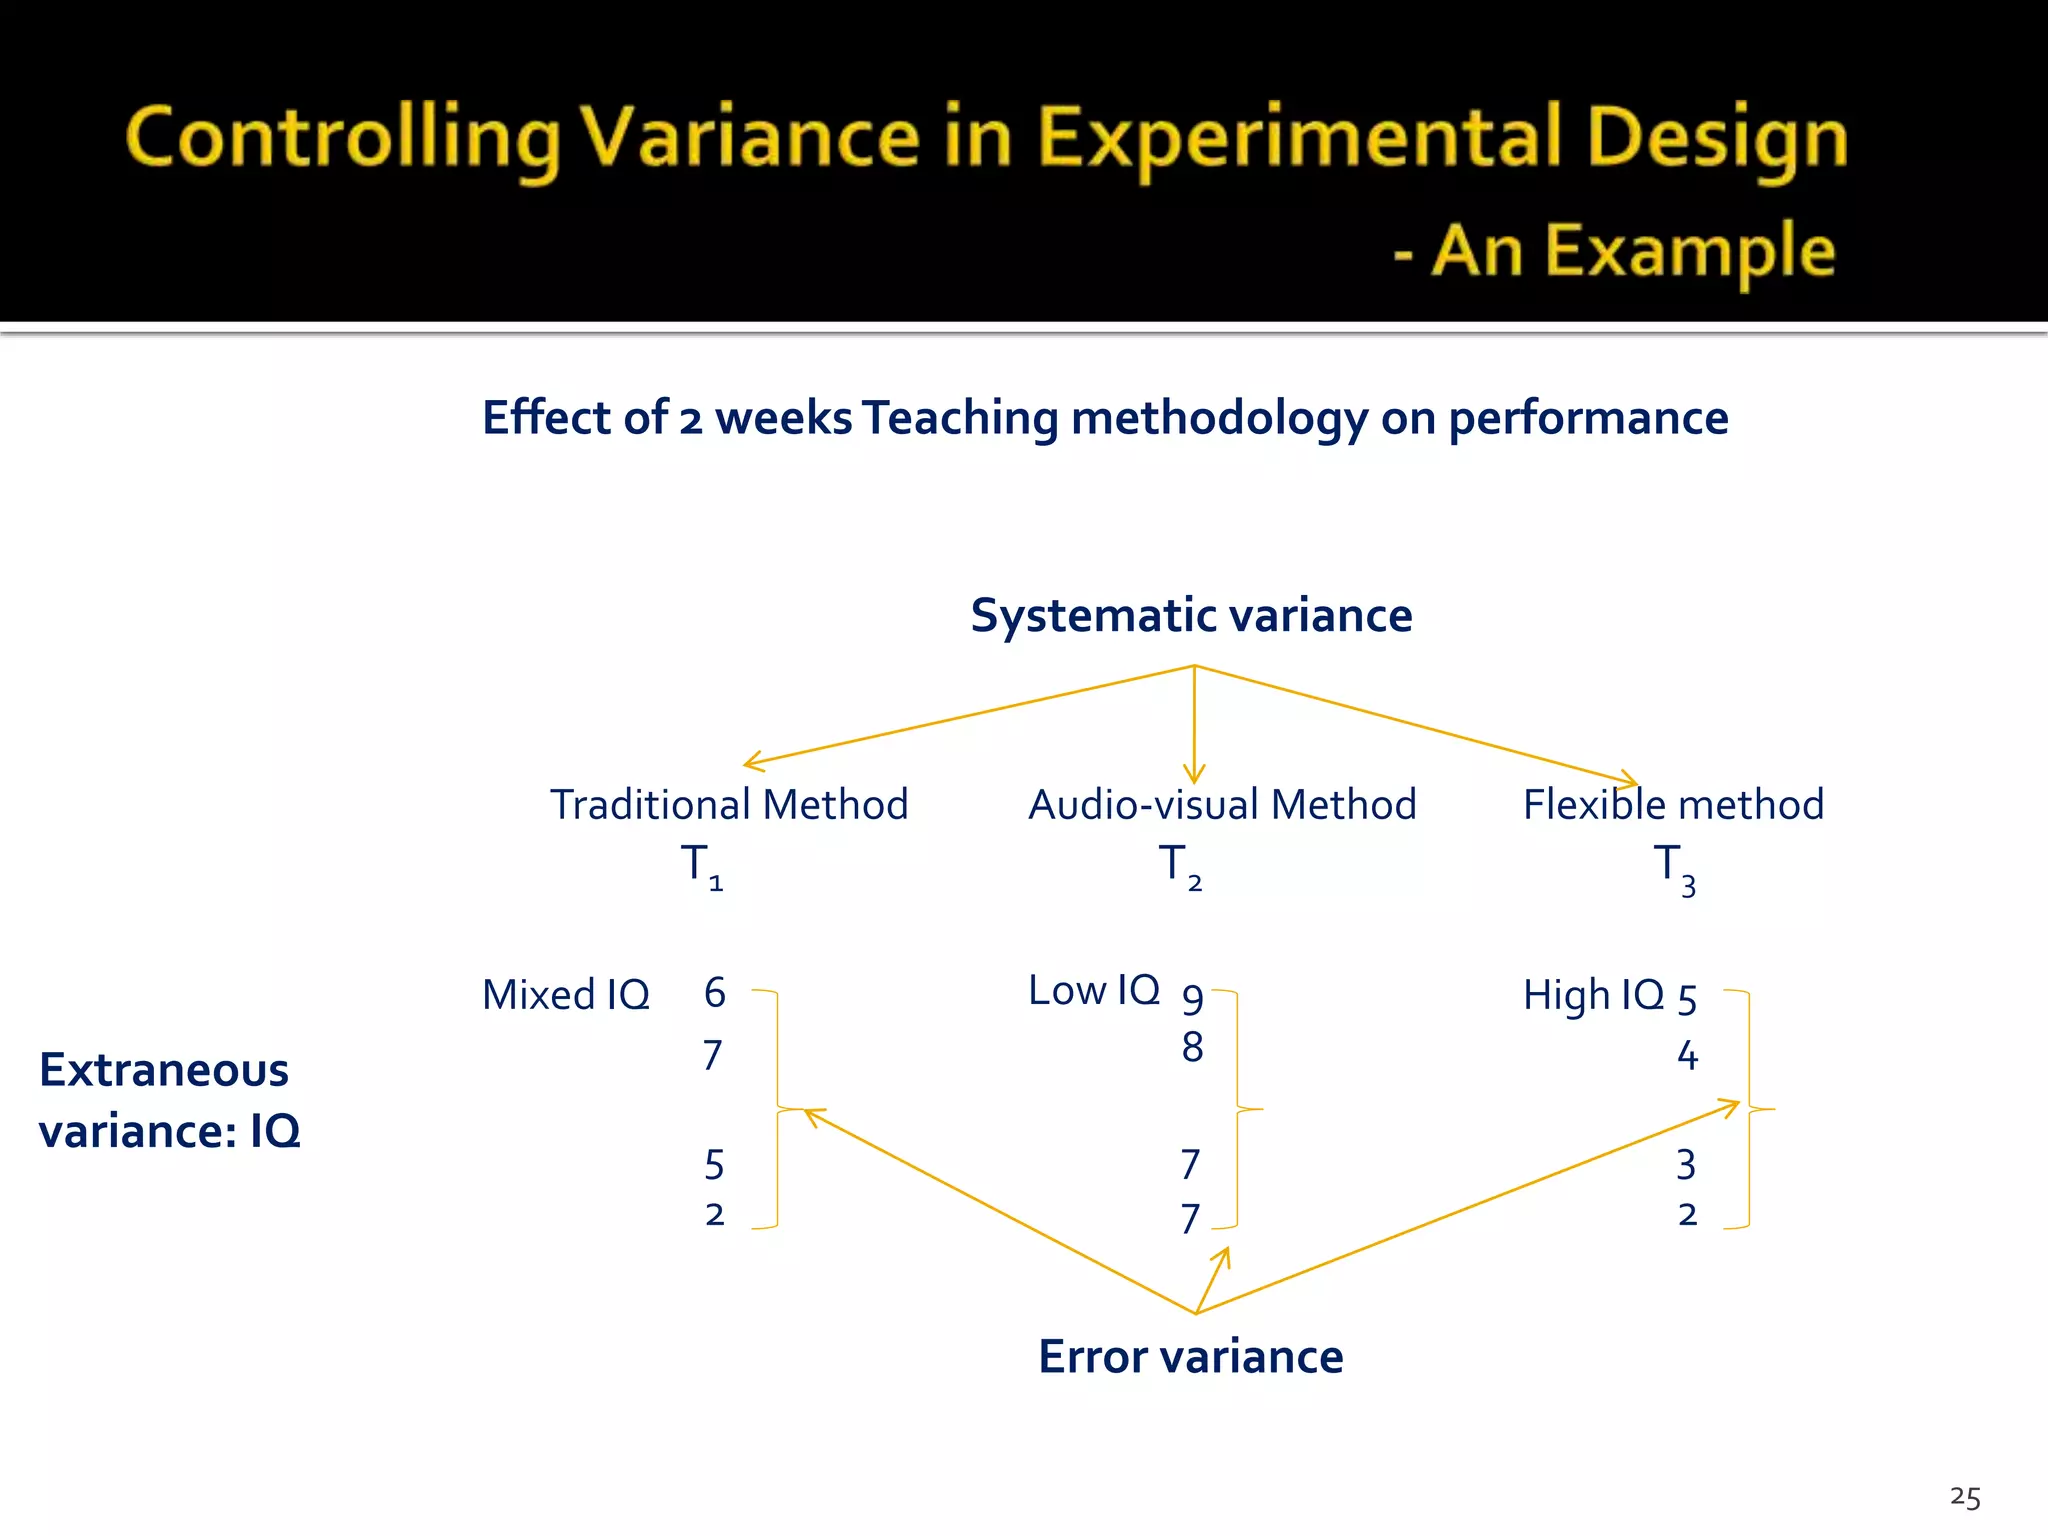

The document outlines various experimental designs in statistical research, emphasizing the importance of hypothesis testing and the relationship between independent and dependent variables. It discusses different design types, including completely randomized, randomized block, matched pairs, and Latin square designs, along with their applications and limitations. Key concepts like randomization, replication, and measurement of variation are highlighted to enhance the validity and reliability of experimental outcomes.