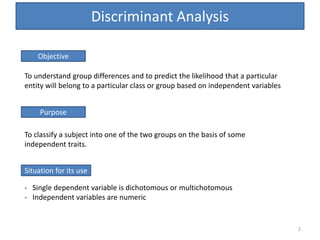
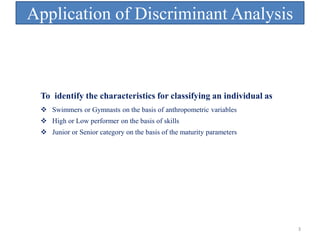
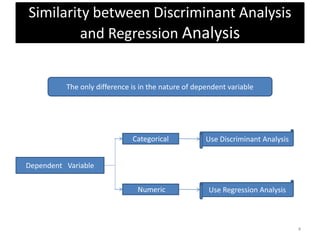
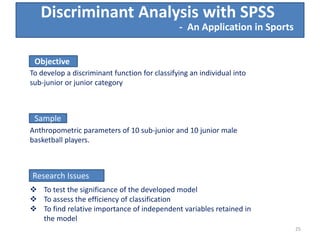
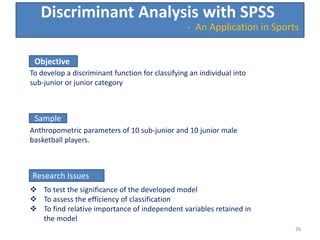
Presentation on Chapter 10
Presented by
Dr.J.P.Verma
MSc (Statistics), PhD, MA(Psychology), Masters(Computer Application)
Professor(Statistics)
Lakshmibai National Institute of Physical Education, Gwalior, India
(Deemed University)
Email: vermajprakash@gmail.com
Discriminant Analysis
Objective
Purpose
Situation for its use
To understand group differences and to predict the likelihood that a particular
entity will belong to a particular class or group based on independent variables
To classify a subject into one of the two groups on the basis of some
independent traits.
- Single dependent variable is dichotomous or multichotomous
- Independent variables are numeric
2
Application of Discriminant Analysis
 Swimmers or Gymnasts on the basis of anthropometric variables
 High or Low performer on the basis of skills
 Junior or Senior category on the basis of the maturity parameters
To identify the characteristics for classifying an individual as
3
Similarity between Discriminant Analysis
and Regression Analysis
The only difference is in the nature of dependent variable
Dependent Variable
Categorical
Numeric
Use Discriminant Analysis
Use Regression Analysis
4
5
This Presentation is based on
Chapter 10 of the book
Sports Research with Analytical
Solution Using SPSS
Published by Wiley, USA
Complete Presentation can be accessed on
Companion Website
of the Book
Request an Evaluation Copy For feedback write to vermajprakash@gmail.com
Procedure in Discriminant Analysis
a. Identification of independent variables in the model
- Variables having significant discriminating power in classifying a
subject into any of the two groups.
b. Function is developed on the identified independent variables
- These identified independent variables are used to develop a
discriminating function.
6
Basics of Discriminant Function Analysis
Discriminating variables(Predictors)
Independent variables which construct a discriminant function
Dependent variable(Criterion variable)
 Object of classification on the basis of independent variables
 needs to be categorical
 Known as Grouping variable in SPSS
7
Basics of Discriminant Analysis
A latent variable which is constructed as a linear combination of independent
variables
where b1,b2 … ,bn are discriminant coefficients,
X1,X2,…,Xn are discriminating variables and
‘a’ is a constant.
Discriminant function(canonical root)
Z = a + b1X1 + b2X2 + ... + bnXn
8
Basics of Discriminant Analysis
 Known as Confusion matrix, assignment matrix or prediction matrix
 Used to assess the efficiency of discriminant analysis.
 Shows percentage of existing data points that are correctly
classified by the model.
 Similar to the R2 (percentage of variation in dependent variable
explained by the model).
Classification matrix
9
Basics of Discriminant Analysis
Stepwise method of discriminant analysis
Purpose of Study
Confirmatory Exploratory
Develop DF by entering all
independent variables
together
Develop DF by entering all
independent variables
stepwise
SPSS command
Enter
SPSS command
Stepwise
10
Basics of Discriminant Analysis
 Capacity of variable to discriminate the cases into any of the two
groups in the model.
 Determined by the coefficient of the discriminating variable in the
discriminant function.
 In SPSS output these coefficients are known as standardized
canonical discriminant function coefficients.
 Higher the value of the coefficient better is the discriminating
power.
Power of discriminating variables
11
 Measures the efficiency of discriminant function in the model.
 Ranges from 0 to 1
 Low value of it (closer to 0) indicates better discriminating power of the
model.
Wilk’s Lambda
Basics of Discriminant Analysis
12
Assumptions in discriminant analysis
a. The predictors are normally distributed
b. the variance covariance matrices for the predictors within each of
the groups are equal.
Assumptions
What if the assumptions are not satisfied
a. If normality assumption is violated use logistic regression
b. If variance covariance matrices are not equal then use quadratic
discriminant technique.
13
 Dependent variable is a true dichotomy. The continuous variable should
never be dichotomized for the purpose of applying discriminant analysis.
 The groups must be mutually exclusive, with every subject or case
belonging to only one group.
 All cases must be independent. One should not use correlated data like
before-after and matched pairs data etc.
 Sample sizes of both groups should not differ to a great extent. If sample
sizes are in the ratio 80:20 use logistic regression.
 Sample size must be sufficient. As a guidelines there should be at least five
to six times as many cases as independent variables.
 No independent variables should have a zero variability in either of the
groups formed by the dependent variable.
Conditions for Discriminant Analysis
14
Why to use discriminant Analysis
 To classify the subjects into groups using a discriminant function;
 To test a theory by observing whether cases are classified as predicted;
 To determine the percent of variance in the dependent variable explained
by the independents;
 To assess the relative importance of the independent variables in classifying
the dependent variable;
 To discard those independent variables which do not have discriminating
power in classification.
15
Steps in Discriminant Analysis
First Step
Choose independent variables by using either “Enter independents
together” and “Use stepwise method” respectively.
Second Step
Develop the discriminant function model by using the coefficients of
independent variables and the value of constant in “Unstandardized
canonical discriminant function coefficients” table
The discriminant function shall look like as follows
Z = a +b1X1+b2X2+ …….. + bnXn
16
Steps in Discriminant Analysis
Third Step
 Wilks’ lambda is computed for testing the significance of
discriminant function developed in the model.
 Significant value of chi square indicates that the discrimination
between two groups in highly significant.
 Significance of the model is tested by using classification matrix
provided by the SPSS. Also known as confusion matrix.
 High percentage of correct classification indicates the validity
of the model.
 The level of accuracy shown in the classification matrix may
not hold for all future classification of new subjects/cases.
 Compute Box M statistic to test the equality of variance
covariance matrices in the two groups.
17
Steps in Discriminant Analysis
Fourth Step
 “Standardized canonical discriminant function coefficients” table is used
to find the relative importance of the variables in the model.
 Coefficients in the tables is an indication of power of the variable
discriminating the two groups.
Fifth Step
 A criterion for classification is made on the basis of the mid point of the mean
value of the transformed groups if number of cases are same in both groups.
Otherwise take weighted average.
 If the value of Z calculated with the above mentioned equation is less than
this mid value the subject is classified in one group and if it is more than the
mid value, it is classified in second group.
18
Application of Discriminant Analysis
 To find the discriminatory power of basketball game performance
indicators between players at guards and forward positions.
Purpose
 Top performing teams during national championships may be selected as
subjects for the study.
Sample
 Further, only those players who play at guard and forward positions may
be selected from the teams for the study.
- A Prototype
19
Plan of Study
The data may be collected from each player by a trained group of
observers on the following parameters
Data Collection
Parameters of study
 percent of success of 3 point shots
 percent of success of free-throw shots
 percent of success of fast-break
 number of fouls made by
 number of fouls made on
 number of defensive rebounds
 number of offensive rebounds
 number of turn-over
 number of steals
 number of assists
 number of interceptions
 number of minutes played. 20
Plan of Study
The objectives of this study can be detailed as follows
 To identify independent variables having significant discriminating
power in classifying a basketballer into guard or forward position
specialist.
 To develop a discriminant model for classifying a player into guard
and forward position.
 To test the validity of model.
 To find the percentage of correct classification of subjects in the
groups.
Objectives
21
Discriminant Analysis may be used to solve the problem of player’s
discrimination by game position.
Test
Output generated by the SPSS
The objectives of the study can be achieved by using the SPSS output. It provides
the following five outputs to fulfill the objectives:
 Standardized canonical discriminant function coefficients table;
 Unstandardized canonical discriminant function coefficients table;
 Functions at group centroids;
 The value of Wilks’ lambda and significance of chi-square test;
 Classification matrix.
Plan of Study- Output generated by the SPSS
22
1. Standardized canonical discriminant function coefficients table
 Provides standardized discriminant coefficient of each variables.
 A variable having larger coefficient indicates more discriminating power.
 The output can be used to show the relative importance of variables in
developing the discriminant function.
2. Unstandardized canonical discriminant function coefficients table
 Output contains the nonstandardized coefficients of the variables selected in
the model
 Used to build the discriminant function
Plan of Study- Interpretation of the Output generated by the SPSS
23
3. Functions at group centroids
 Output provides the mean value of the transformed groups
 Mid point of these two mean is used for classifying a subject in either
of the two groups
Plan of Study- Interpretation of the Output generated by the SPSS
4. The value of Wilks’ lambda and significance of chi-square test
 The value of Wilks’ lambda explains the discriminating power of the
model
 Significant value of chi-square indicates significance of the model in
discriminating between two groups.
5. Classification matrix
 The fifth output provides the number of subjects classifying correctly
into group. 24
Discriminant Analysis with SPSS
Objective
To develop a discriminant function for classifying an individual into
sub-junior or junior category
Sample
Anthropometric parameters of 10 sub-junior and 10 junior male
basketball players.
Research Issues
 To test the significance of the developed model
 To assess the efficiency of classification
 To find relative importance of independent variables retained in
the model
- An Application in Sports
25
Discriminant Analysis with SPSS
Objective
To develop a discriminant function for classifying an individual into
sub-junior or junior category
Sample
Anthropometric parameters of 10 sub-junior and 10 junior male
basketball players.
Research Issues
 To test the significance of the developed model
 To assess the efficiency of classification
 To find relative importance of independent variables retained in
the model
26
- An Application in Sports
26
27
To buy the book
Sports Research With Analytical
Solutions Using SPSS
and all associated presentations click Here
Complete presentation is available on
companion website of the book
For feedback write to vermajprakash@gmail.comRequest an Evaluation Copy

Discriminant Analysis in Sports

  • 1.
    Presentation on Chapter10 Presented by Dr.J.P.Verma MSc (Statistics), PhD, MA(Psychology), Masters(Computer Application) Professor(Statistics) Lakshmibai National Institute of Physical Education, Gwalior, India (Deemed University) Email: vermajprakash@gmail.com
  • 2.
    Discriminant Analysis Objective Purpose Situation forits use To understand group differences and to predict the likelihood that a particular entity will belong to a particular class or group based on independent variables To classify a subject into one of the two groups on the basis of some independent traits. - Single dependent variable is dichotomous or multichotomous - Independent variables are numeric 2
  • 3.
    Application of DiscriminantAnalysis  Swimmers or Gymnasts on the basis of anthropometric variables  High or Low performer on the basis of skills  Junior or Senior category on the basis of the maturity parameters To identify the characteristics for classifying an individual as 3
  • 4.
    Similarity between DiscriminantAnalysis and Regression Analysis The only difference is in the nature of dependent variable Dependent Variable Categorical Numeric Use Discriminant Analysis Use Regression Analysis 4
  • 5.
    5 This Presentation isbased on Chapter 10 of the book Sports Research with Analytical Solution Using SPSS Published by Wiley, USA Complete Presentation can be accessed on Companion Website of the Book Request an Evaluation Copy For feedback write to vermajprakash@gmail.com
  • 6.
    Procedure in DiscriminantAnalysis a. Identification of independent variables in the model - Variables having significant discriminating power in classifying a subject into any of the two groups. b. Function is developed on the identified independent variables - These identified independent variables are used to develop a discriminating function. 6
  • 7.
    Basics of DiscriminantFunction Analysis Discriminating variables(Predictors) Independent variables which construct a discriminant function Dependent variable(Criterion variable)  Object of classification on the basis of independent variables  needs to be categorical  Known as Grouping variable in SPSS 7
  • 8.
    Basics of DiscriminantAnalysis A latent variable which is constructed as a linear combination of independent variables where b1,b2 … ,bn are discriminant coefficients, X1,X2,…,Xn are discriminating variables and ‘a’ is a constant. Discriminant function(canonical root) Z = a + b1X1 + b2X2 + ... + bnXn 8
  • 9.
    Basics of DiscriminantAnalysis  Known as Confusion matrix, assignment matrix or prediction matrix  Used to assess the efficiency of discriminant analysis.  Shows percentage of existing data points that are correctly classified by the model.  Similar to the R2 (percentage of variation in dependent variable explained by the model). Classification matrix 9
  • 10.
    Basics of DiscriminantAnalysis Stepwise method of discriminant analysis Purpose of Study Confirmatory Exploratory Develop DF by entering all independent variables together Develop DF by entering all independent variables stepwise SPSS command Enter SPSS command Stepwise 10
  • 11.
    Basics of DiscriminantAnalysis  Capacity of variable to discriminate the cases into any of the two groups in the model.  Determined by the coefficient of the discriminating variable in the discriminant function.  In SPSS output these coefficients are known as standardized canonical discriminant function coefficients.  Higher the value of the coefficient better is the discriminating power. Power of discriminating variables 11
  • 12.
     Measures theefficiency of discriminant function in the model.  Ranges from 0 to 1  Low value of it (closer to 0) indicates better discriminating power of the model. Wilk’s Lambda Basics of Discriminant Analysis 12
  • 13.
    Assumptions in discriminantanalysis a. The predictors are normally distributed b. the variance covariance matrices for the predictors within each of the groups are equal. Assumptions What if the assumptions are not satisfied a. If normality assumption is violated use logistic regression b. If variance covariance matrices are not equal then use quadratic discriminant technique. 13
  • 14.
     Dependent variableis a true dichotomy. The continuous variable should never be dichotomized for the purpose of applying discriminant analysis.  The groups must be mutually exclusive, with every subject or case belonging to only one group.  All cases must be independent. One should not use correlated data like before-after and matched pairs data etc.  Sample sizes of both groups should not differ to a great extent. If sample sizes are in the ratio 80:20 use logistic regression.  Sample size must be sufficient. As a guidelines there should be at least five to six times as many cases as independent variables.  No independent variables should have a zero variability in either of the groups formed by the dependent variable. Conditions for Discriminant Analysis 14
  • 15.
    Why to usediscriminant Analysis  To classify the subjects into groups using a discriminant function;  To test a theory by observing whether cases are classified as predicted;  To determine the percent of variance in the dependent variable explained by the independents;  To assess the relative importance of the independent variables in classifying the dependent variable;  To discard those independent variables which do not have discriminating power in classification. 15
  • 16.
    Steps in DiscriminantAnalysis First Step Choose independent variables by using either “Enter independents together” and “Use stepwise method” respectively. Second Step Develop the discriminant function model by using the coefficients of independent variables and the value of constant in “Unstandardized canonical discriminant function coefficients” table The discriminant function shall look like as follows Z = a +b1X1+b2X2+ …….. + bnXn 16
  • 17.
    Steps in DiscriminantAnalysis Third Step  Wilks’ lambda is computed for testing the significance of discriminant function developed in the model.  Significant value of chi square indicates that the discrimination between two groups in highly significant.  Significance of the model is tested by using classification matrix provided by the SPSS. Also known as confusion matrix.  High percentage of correct classification indicates the validity of the model.  The level of accuracy shown in the classification matrix may not hold for all future classification of new subjects/cases.  Compute Box M statistic to test the equality of variance covariance matrices in the two groups. 17
  • 18.
    Steps in DiscriminantAnalysis Fourth Step  “Standardized canonical discriminant function coefficients” table is used to find the relative importance of the variables in the model.  Coefficients in the tables is an indication of power of the variable discriminating the two groups. Fifth Step  A criterion for classification is made on the basis of the mid point of the mean value of the transformed groups if number of cases are same in both groups. Otherwise take weighted average.  If the value of Z calculated with the above mentioned equation is less than this mid value the subject is classified in one group and if it is more than the mid value, it is classified in second group. 18
  • 19.
    Application of DiscriminantAnalysis  To find the discriminatory power of basketball game performance indicators between players at guards and forward positions. Purpose  Top performing teams during national championships may be selected as subjects for the study. Sample  Further, only those players who play at guard and forward positions may be selected from the teams for the study. - A Prototype 19
  • 20.
    Plan of Study Thedata may be collected from each player by a trained group of observers on the following parameters Data Collection Parameters of study  percent of success of 3 point shots  percent of success of free-throw shots  percent of success of fast-break  number of fouls made by  number of fouls made on  number of defensive rebounds  number of offensive rebounds  number of turn-over  number of steals  number of assists  number of interceptions  number of minutes played. 20
  • 21.
    Plan of Study Theobjectives of this study can be detailed as follows  To identify independent variables having significant discriminating power in classifying a basketballer into guard or forward position specialist.  To develop a discriminant model for classifying a player into guard and forward position.  To test the validity of model.  To find the percentage of correct classification of subjects in the groups. Objectives 21
  • 22.
    Discriminant Analysis maybe used to solve the problem of player’s discrimination by game position. Test Output generated by the SPSS The objectives of the study can be achieved by using the SPSS output. It provides the following five outputs to fulfill the objectives:  Standardized canonical discriminant function coefficients table;  Unstandardized canonical discriminant function coefficients table;  Functions at group centroids;  The value of Wilks’ lambda and significance of chi-square test;  Classification matrix. Plan of Study- Output generated by the SPSS 22
  • 23.
    1. Standardized canonicaldiscriminant function coefficients table  Provides standardized discriminant coefficient of each variables.  A variable having larger coefficient indicates more discriminating power.  The output can be used to show the relative importance of variables in developing the discriminant function. 2. Unstandardized canonical discriminant function coefficients table  Output contains the nonstandardized coefficients of the variables selected in the model  Used to build the discriminant function Plan of Study- Interpretation of the Output generated by the SPSS 23
  • 24.
    3. Functions atgroup centroids  Output provides the mean value of the transformed groups  Mid point of these two mean is used for classifying a subject in either of the two groups Plan of Study- Interpretation of the Output generated by the SPSS 4. The value of Wilks’ lambda and significance of chi-square test  The value of Wilks’ lambda explains the discriminating power of the model  Significant value of chi-square indicates significance of the model in discriminating between two groups. 5. Classification matrix  The fifth output provides the number of subjects classifying correctly into group. 24
  • 25.
    Discriminant Analysis withSPSS Objective To develop a discriminant function for classifying an individual into sub-junior or junior category Sample Anthropometric parameters of 10 sub-junior and 10 junior male basketball players. Research Issues  To test the significance of the developed model  To assess the efficiency of classification  To find relative importance of independent variables retained in the model - An Application in Sports 25
  • 26.
    Discriminant Analysis withSPSS Objective To develop a discriminant function for classifying an individual into sub-junior or junior category Sample Anthropometric parameters of 10 sub-junior and 10 junior male basketball players. Research Issues  To test the significance of the developed model  To assess the efficiency of classification  To find relative importance of independent variables retained in the model 26 - An Application in Sports 26
  • 27.
    27 To buy thebook Sports Research With Analytical Solutions Using SPSS and all associated presentations click Here Complete presentation is available on companion website of the book For feedback write to vermajprakash@gmail.comRequest an Evaluation Copy