SlideShare a Scribd company logo
The Effect of Time Pressure on Solving
Optimal Stopping Problems
William Teng
94396558/Michael Dawson Nunez
wteng1@uci.edu
Abstract
Optimal decision process has repeatedly been explored within
experimental psychology in order to simulate and understand real-
world decision-making. This concept is a highly relevant idea used
in fields spanning from psychology to finance. The purpose of our
current study is to bring about learning of optimal decision-making
within subjects, and to examine differences in performance
between conditions varying in amount of alternatives presented
through the use of an optimal stopping task. Our results failed to
yield any statistically significant evidence indicating learning.
However, subjects belonging to the shorter condition were found to
demonstrate significantly higher performance than subjects
participating in the longer condition.
1 Introduction	
  
Nearly every instance of human behavior and interaction is narrated by a series of
decisions. Given the complex and competitive nature of modern societies, learning
to make sound and efficient decisions has become a crucial and necessary trait for
attaining successes and rewards. However, one is often faced with the difficult task
of making decisions without complete knowledge of all relevant information and
alternatives. As Campbell and Lee (2006) states, “Many real world decision-making
problems are sequential in nature. A series of choices is made available over time,
and it is often efficient (and sometimes even necessary) to make a selection without
waiting to be presented with all of the alternatives” (p. 1068). This process of
decision-making can be studied in an experimental setting using what is known as
an “optimal stopping” task (otherwise referred to as the “secretary problem”).
An optimal stopping experiment simulates real world decision-making by
presenting an observer with a series of possible choices, at which point the observer
must decide whether to accept or reject the current choice as the best alternative.
Each alternative is only presented once and can only be chosen during the time of
presentation. This task urges participants to utilize an “optimal (rational) decision
process” which involves choosing the first alternative containing a value that is both
greater than the optimal threshold (a decreasing function of optimal points
dependent on a choice’s serial positioning within a series) as well as all previously
presented alternatives (Vandekerckhove, 2014, p. 12).
Campbell and Lee (2006) studied learning in optimal decision making
through the use of a five-point problem optimal stopping task, in which each
problem series contained a set of five choices. The choices were comprised of two-
decimal point numbers uniformly distributed across a scale from 0 – 100. They also
studied the effects of feedback on learning by manipulating for conditions of no
feedback, outcome feedback, and full feedback. Financial rewards were also
controlled for by providing one group of subjects with no financial incentive,
whereas, the other was paid five dollars for participating with room for additional
monetary rewards if predetermined quotas of correct responses were met.
The results of their experiment yielded no significant evidence that would
suggest learning during the task. Feedback and financial rewards also failed to
demonstrate any significant effects towards learning. Nonetheless, when overall
performance was analyzed, an interaction between feedback and reward was found
to increase optimal decision-making but still showed no signs of learning (Campbell
& Lee, 2006, p. 1073).
The purpose of our current study is to bring about learning of optimal
decision-making within subjects, as well as to examine differences in performance
between conditions varying in numbers of alternatives presented through the use of
an optimal stopping task. To do so, we will utilize a 2X3 mixed ANOVA model and
a 2X4 mixed ANOVA model using series of numbers as our stimuli. The
manipulated variables are length of series and size of blocks. The variable “length”
will be controlled to be either series of three number choices (short) or of seven
number choices (long). Furthermore, data from 120 trials will then be divided into
three blocks consisting of 40 trials for model 1; and four 30 trials blocks for model
2. We hypothesize that rational decision-making performance will improve between
the first block and the last indicating an occurrence of learning. Secondly, we
predict that overall performance of correct rational decisions will be higher for the
short condition than the long condition.
2 Experiment	
  
2.1 Participants
For this optimal stopping experiment, we enlisted a total of 71 participants. All
participants were recruited from the same population of only University of
California, Irvine undergraduate students belonging to the Psychology subject’s
pool. 45 subjects completed the task under the long condition, whereas, the
remaining 26 were tested in the short condition.
2.2 Stimuli
The experiment was performed through the use of 120 generated series of numbers
as its stimuli. There existed two experimental conditions defined as either short or
long. The short conditions generated series of three numbers as opposed to the long
conditions, which utilized series of seven numbers. All numbers generated were
two-decimal point values and fell between the range of 0 – 100.
2.3 Procedures
Each subject was first presented a demonstration trial by his or her experimenter in
order to ensure full understanding of the task presented. For all subsequent trials,
the participants were presented series of numbers and they were asked to determine
the maximum value of each series. Each number within a series was only presented
once and could only be accepted or rejected as the maximum value while being
shown. Depending on the assigned condition, either the third or seventh numbers
were forced selections since they were the last of each respective series. All
participants repeated the task for a total of 120 trials, which were then divided into
three blocks of 40 and four blocks of 30. Every participant completed the blocks in
the same order, however, the series within each block were randomized. After each
trial, immediate outcome feedback was given informing participants whether they
were correct or incorrect in choosing the maximum value.
3 Results	
  
Figure 1:
Figure 1: A plotted graph displaying mean accuracy of correct rational decision for
the “long” and “short” conditions in model 1. Both conditions were separated into
three different blocks. A significant difference in performance was found between
the three blocks [F (2,138) = 30.461, p < 0.01]. Contrast revealed that subjects
made significantly more rational decisions in block 1 than in block 2 [F (1,69) =
50.780, p < 0.01, r² = 0.4239] and block 3 produced more rational decisions than
that of block 2 [F (1,69) = 16.115, p < 0.01, r² = 0.1893]. Length also displayed a
significant main effect [F (1,69) = 68.377, p < 0.01, r² = 0.4977]. An interaction
effect was also found between length of condition and blocks [F (2,138) = 40.039, p
< 0.01]. Contrast revealed that the interaction effect of condition length and blocks
differed significantly between block 1 and block 2 [F (1,69) = 5.459, p = 0.022, r² =
0.0733] as well as between block 2 and block 3 [F (1,69) = 96.888, p < 0.01, r² =
0.5841].
A mixed-design ANOVA for model 1 revealed a significant main effect of blocks on
mean rational decision correctness [F (2,138) = 30.461, p < 0.01]. Contrast of the
three blocks displayed significantly better performances in rational decision-making
during block 1 than block 2 [F (1,69) = 50.780, p < 0.01, r² = 0.4239]. Block 3 was
also found to produce more rational decisions than block 2 [F (1,69) = 16.115, p <
0.01, r² = 0.1893] but performance in block 1 was higher than block 3 [F (1,70) =
4.705, p = 0.033, r² = 0.063]. A significant main effect of condition length was
found [F (1,69) = 68.377, p < 0.01, r² = 0.4977]. Furthermore, an interaction effect
was discovered between condition length and blocks [F (2,138) = 40.039, p < 0.01].
Additional contrast demonstrated that the effects of condition length on blocks
differed significantly between block 1 and block 2 [F (1,69) = 5.459, p = 0.022, r² =
0.0733] as well as between block 2 and block 3 [F (1,69) = 96.888, p < 0.01, r² =
0.5841].
Figure 2:
Figure 2: A Scatter-plot displaying a positive correlation between the proportion of
rational decisions for each subject in block 1 and block 2 [r = 0.679, p < 0.01].
Correlation analysis of block 1 vs. block 2 revealed a positive correlation
between the proportion of rational decision making of the two blocks [r = 0.679, p <
0.01].
Figure 3:
Figure 3: A Scatter-plot displaying the positive correlation between the proportion
of rational decisions for each subject in block 2 and block 3 [r = 0.391, p = 0.001].
Correlation analysis of block 2 vs. block 3 revealed a positive correlation
between the proportion of rational decision making of the two blocks [r = 0.391, p =
0.001].
Figure 4:
Figure 4: A Scatter-plot displaying the positive correlation between the proportion
of rational decisions for each subject in block 1 and block 3 [r = 0.391, p = 0.001].
Correlation analysis of block 1 vs. block 3 revealed a positive correlation
between the proportion of rational decision making of the two blocks [r = 0.391, p =
0.001].
Figure 5:
Figure 5: Figure 1: A plotted graph displaying mean accuracy of correct rational
decision for the “long” and “short” conditions in model 2. Both conditions were
separated into four different blocks. A significant difference in performance was
found between the four blocks [F (3,207) = 15.888, p < 0.01]. Contrast revealed
that subjects made significantly more rational decisions in block 1 than in block 2
[F (1,69) = 4.557, p = 0.036, r² = 0.062] and block 3 produced less rational
decisions than that of block 2 [F (1,69) = 22.323, p < 0.01, r² = 0.2444] while block
4 yielded more rational decisions than block 3 [F (1,69) = 24.166, p < 0.01, r² =
0.2594]. Length also displayed a significant main effect [F (1,69) = 68.377, p <
0.01, r² = 0.4977]. An interaction effect was also found between length of condition
and blocks [F (3,207) = 21.120, p < 0.01]. Contrast revealed that the effect of
condition length differed significantly between block 1 and block 2 [F (1,69) =
6.163, p = 0.015, r² = 0.082] and between block 3 and block 4 [F (1,69) = 33.125, p
< 0.01, r² = 0.3244] but not between block 2 and block 3 [F (1,69) = 2.981, p =
0.089].
A repeated measures ANOVA for model 2 yielded a significant main effect
of blocks on optimal decision making [F (3,207) = 15.888, p < 0.01]. A significant
effect of length was also discovered [F (1,69) = 68.377, p < 0.01, r² = 0.4977].
Interaction between blocks and length once again proved to be significant [F (3,207)
= 21.120, p < 0.01]. Contrast for blocks revealed that subjects made significantly
more rational decisions in block 1 than in block 2 [F (1,69) = 4.557, p = 0.036, r² =
0.062] and block 3 produced less rational decisions than that of block 2 [F (1,69) =
22.323, p < 0.01, r² = 0.2444] while block 4 yielded more rational decisions than
block 3 [F (1,69) = 24.166, p < 0.01, r² = 0.2594]. Additional contrast of interaction
demonstrated that the effect of condition length differed significantly between block
1 and block 2 [F (1,69) = 6.163, p = 0.015, r² = 0.082] and between block 3 and
block 4 [F (1,69) = 33.125, p < 0.01, r² = 0.3244] but not between block 2 and block
3 [F (1,69) = 2.981, p = 0.089].
Figure 6:
Figure 6: A Scatter-plot displaying the positive correlation between the proportion
of rational decisions for each subject in block 1 and block 2 of model 2 [r = 0.651,
p < 0.01].
Correlation analysis of block 1 vs. block 2 of model 2 revealed a positive
correlation between the proportion of rational decision making of the two blocks [r
= 0.0.651, p < 0.01].
4 Discussion	
  
For the current study, participants were tested using an optimal stopping task in
order to explore the optimal decision process. The experimental design was
manipulated to have both a short and long condition for the sake of illustrating the
effects condition length has on optimal decision performance. Furthermore, all data
were separated into blocks to determine whether learning occurred across trials
The results successfully showed a significant main effect of condition
length on subsequent optimal decision performance. The short condition was proven
to elicit better performance than the long condition, thus, confirming our first
hypothesis. This is an interesting discovery because it has direct applications to
everyday situations. Perhaps, as common practices often demonstrate, an increase in
choices causes complexity and promotes indecisiveness; consequently, the ability to
make proper and efficient decisions begins to decline. Another fascinating point to
consider is the emotional impact an individual may experience when faced with too
many alternatives. It may be that high number of choices can prove overwhelming;
resulting in apprehension and anxiety, which then affects decision-making. An
alternative optimal stopping study could manipulate emotion and mood through
some version of priming and analyze whether positive vs. negative moods have a
significant impact on ability to follow the rational rule.
Our second hypothesis, however, failed to generate any statistical support.
Initially, we predicted an increase in optimal decision performance from early
blocks to later blocks due to learning; unfortunately, results showed statistically
significant decreases in performance across trials. For both models used, decision-
making using the rational rule decreased from blocks 1 to blocks 2, however,
performance began to slightly increase from blocks 2 towards blocks 3 or 4.
Correlation analysis would reveal a positive linear relationship in proportion
rationality between blocks 1 and blocks 2 in both models. This suggests that a
significant amount of variability can be accounted for by individual differences in
decision-making abilities.
In contrast, the correlational value between blocks 2 and blocks 3, or blocks
4 for model 2, is low so it would be dangerous to explain variation under the
assumption of individual differences (despite a statistically significant positive
correlation). Instead, what may have caused the slight increase in performance could
be attributed to the interaction effect found between length and blocks. Upon further
examination of Figure 1, it is worth noting that the short condition followed a trend
of constant decrease in optimal decisions, whereas, the long condition seemed to
increase during the last block of trials. Perhaps this is an indication of learning
under longer condition. This would be an interesting implication and is worth
further studies using even larger series of choices. Another factor that may have
affected learning was the feedback given at each trial. The feedbacks were designed
to inform subjects of correct acceptance of the maximum value as opposed to the
optimal value. It is possible that learning was inhibited because participants
received negative feedback despite correctly identifying an optimal value.
In conclusion, the current study was able to successfully demonstrate that
shorter conditions yield higher levels of optimal decision performance. However,
like Campbell and Lee’s (2006) experiment, significant evidence of learning failed
to be collected. Nonetheless, this study has raised an interesting question regarding
the effects of emotion on optimal decision-making. Furthermore, it may have also
shown slight implications of learning. Additional research on optimal decision
process should be considered and will be crucial in our quest to understanding the
fundamental luxury and right of human consciousness, freedom of choice.
References	
  
Campbell, J., & Lee, M. (2006). The effect of feedback and financial reward on
human performance solving ‘secretary’ problems. 1068-1073. Retrieved
from https://eee.uci.edu/14w/68200/psych112bw/p1068 1 .pdf
Vandekerckhove, J. (2014). Lecture 8 [PowerPoint slides]. Retrieved from
https://eee.uci.edu/14w/68200/psych112bw/lec8_p112bw.pdf`

More Related Content

What's hot

Computational Pool-Testing with Retesting Strategy
Computational Pool-Testing with Retesting StrategyComputational Pool-Testing with Retesting Strategy
Computational Pool-Testing with Retesting Strategy
Waqas Tariq
 
Repeated measures anova with spss
Repeated measures anova with spssRepeated measures anova with spss
Repeated measures anova with spss
J P Verma
 
A two way randomized response technique in stratification for
A two way randomized response technique in stratification forA two way randomized response technique in stratification for
A two way randomized response technique in stratification for
Alexander Decker
 
Group Testing with Test Errors Made Easier
Group Testing with Test Errors Made EasierGroup Testing with Test Errors Made Easier
Group Testing with Test Errors Made Easier
Waqas Tariq
 
Business Research Methods PPT -IV
Business Research Methods PPT -IVBusiness Research Methods PPT -IV
Business Research Methods PPT -IV
Ravinder Singh
 
Propensity Scores in Medical Device Trials
Propensity Scores in Medical Device TrialsPropensity Scores in Medical Device Trials
Propensity Scores in Medical Device Trials
Biomedical Statistical Consulting
 
An Experimental Study of Finitely and Infinitely Repeated Linear Public Goods...
An Experimental Study of Finitely and Infinitely Repeated Linear Public Goods...An Experimental Study of Finitely and Infinitely Repeated Linear Public Goods...
An Experimental Study of Finitely and Infinitely Repeated Linear Public Goods...
Stockholm Institute of Transition Economics
 
A data envelopment analysis method for optimizing multi response problem with...
A data envelopment analysis method for optimizing multi response problem with...A data envelopment analysis method for optimizing multi response problem with...
A data envelopment analysis method for optimizing multi response problem with...
Phuong Dx
 
Structural equation modelling
Structural equation modellingStructural equation modelling
Structural equation modelling
Mark Boukes (University of Amsterdam)
 
Trends towards significance
Trends towards significanceTrends towards significance
Trends towards significance
StephenSenn2
 
Webinar slides- alternatives to the p-value and power
Webinar slides- alternatives to the p-value and power Webinar slides- alternatives to the p-value and power
Webinar slides- alternatives to the p-value and power
nQuery
 
Approximate ANCOVA
Approximate ANCOVAApproximate ANCOVA
Approximate ANCOVA
Stephen Senn
 
Emotional Interactions in Human Decision-Making using EEG Hyperscanning
Emotional Interactions in Human Decision-Making using EEG HyperscanningEmotional Interactions in Human Decision-Making using EEG Hyperscanning
Emotional Interactions in Human Decision-Making using EEG HyperscanningKyongsik Yun
 
Powerpoint Rm
Powerpoint RmPowerpoint Rm
Powerpoint Rm
wperng
 
What is your question
What is your questionWhat is your question
What is your question
StephenSenn2
 
ApplyingOutcomeResearch
ApplyingOutcomeResearchApplyingOutcomeResearch
ApplyingOutcomeResearch
Barry Duncan
 

What's hot (18)

Decoys
DecoysDecoys
Decoys
 
Computational Pool-Testing with Retesting Strategy
Computational Pool-Testing with Retesting StrategyComputational Pool-Testing with Retesting Strategy
Computational Pool-Testing with Retesting Strategy
 
Repeated measures anova with spss
Repeated measures anova with spssRepeated measures anova with spss
Repeated measures anova with spss
 
A two way randomized response technique in stratification for
A two way randomized response technique in stratification forA two way randomized response technique in stratification for
A two way randomized response technique in stratification for
 
Group Testing with Test Errors Made Easier
Group Testing with Test Errors Made EasierGroup Testing with Test Errors Made Easier
Group Testing with Test Errors Made Easier
 
Business Research Methods PPT -IV
Business Research Methods PPT -IVBusiness Research Methods PPT -IV
Business Research Methods PPT -IV
 
Propensity Scores in Medical Device Trials
Propensity Scores in Medical Device TrialsPropensity Scores in Medical Device Trials
Propensity Scores in Medical Device Trials
 
An Experimental Study of Finitely and Infinitely Repeated Linear Public Goods...
An Experimental Study of Finitely and Infinitely Repeated Linear Public Goods...An Experimental Study of Finitely and Infinitely Repeated Linear Public Goods...
An Experimental Study of Finitely and Infinitely Repeated Linear Public Goods...
 
Reliability
ReliabilityReliability
Reliability
 
A data envelopment analysis method for optimizing multi response problem with...
A data envelopment analysis method for optimizing multi response problem with...A data envelopment analysis method for optimizing multi response problem with...
A data envelopment analysis method for optimizing multi response problem with...
 
Structural equation modelling
Structural equation modellingStructural equation modelling
Structural equation modelling
 
Trends towards significance
Trends towards significanceTrends towards significance
Trends towards significance
 
Webinar slides- alternatives to the p-value and power
Webinar slides- alternatives to the p-value and power Webinar slides- alternatives to the p-value and power
Webinar slides- alternatives to the p-value and power
 
Approximate ANCOVA
Approximate ANCOVAApproximate ANCOVA
Approximate ANCOVA
 
Emotional Interactions in Human Decision-Making using EEG Hyperscanning
Emotional Interactions in Human Decision-Making using EEG HyperscanningEmotional Interactions in Human Decision-Making using EEG Hyperscanning
Emotional Interactions in Human Decision-Making using EEG Hyperscanning
 
Powerpoint Rm
Powerpoint RmPowerpoint Rm
Powerpoint Rm
 
What is your question
What is your questionWhat is your question
What is your question
 
ApplyingOutcomeResearch
ApplyingOutcomeResearchApplyingOutcomeResearch
ApplyingOutcomeResearch
 

Similar to Optimal Stopping Report Final

The t Test for Two Related Samples
The t Test for Two Related SamplesThe t Test for Two Related Samples
The t Test for Two Related Samples
Mary Anne (Riyan) Portuguez
 
EMBODO LP Grade 12 Mean and Variance of the Sampling Distribution of the Samp...
EMBODO LP Grade 12 Mean and Variance of the Sampling Distribution of the Samp...EMBODO LP Grade 12 Mean and Variance of the Sampling Distribution of the Samp...
EMBODO LP Grade 12 Mean and Variance of the Sampling Distribution of the Samp...
Elton John Embodo
 
Analyzing experimental research data
Analyzing experimental research dataAnalyzing experimental research data
Analyzing experimental research data
Atula Ahuja
 
Contingent Weighting in Judgment and Choice
Contingent Weighting in Judgment and ChoiceContingent Weighting in Judgment and Choice
Contingent Weighting in Judgment and ChoiceSamuel Sattath
 
Foundations of Experimental Design
Foundations of Experimental DesignFoundations of Experimental Design
Foundations of Experimental Design
J P Verma
 
Response of Watermelon to Five Different Rates of Poultry Manure in Asaba Are...
Response of Watermelon to Five Different Rates of Poultry Manure in Asaba Are...Response of Watermelon to Five Different Rates of Poultry Manure in Asaba Are...
Response of Watermelon to Five Different Rates of Poultry Manure in Asaba Are...IOSR Journals
 
11 T(EA) FOR TWO TESTS BETWEEN THE MEANS OF DIFFERENT GROUPS11 .docx
11 T(EA) FOR TWO TESTS BETWEEN THE MEANS OF DIFFERENT GROUPS11 .docx11 T(EA) FOR TWO TESTS BETWEEN THE MEANS OF DIFFERENT GROUPS11 .docx
11 T(EA) FOR TWO TESTS BETWEEN THE MEANS OF DIFFERENT GROUPS11 .docx
novabroom
 
11 T(EA) FOR TWO TESTS BETWEEN THE MEANS OF DIFFERENT GROUPS11 .docx
11 T(EA) FOR TWO TESTS BETWEEN THE MEANS OF DIFFERENT GROUPS11 .docx11 T(EA) FOR TWO TESTS BETWEEN THE MEANS OF DIFFERENT GROUPS11 .docx
11 T(EA) FOR TWO TESTS BETWEEN THE MEANS OF DIFFERENT GROUPS11 .docx
hyacinthshackley2629
 
Statistics Chapter 01[1]
Statistics  Chapter 01[1]Statistics  Chapter 01[1]
Statistics Chapter 01[1]plisasm
 
Parametric Statistics
Parametric StatisticsParametric Statistics
Parametric Statistics
jennytuazon01630
 
Unit3
Unit3Unit3
slides Testing of hypothesis.pptx
slides Testing  of  hypothesis.pptxslides Testing  of  hypothesis.pptx
slides Testing of hypothesis.pptx
ssuser504dda
 
Directions The purpose of Project 8 is to prepare you for the final.docx
Directions The purpose of Project 8 is to prepare you for the final.docxDirections The purpose of Project 8 is to prepare you for the final.docx
Directions The purpose of Project 8 is to prepare you for the final.docx
eve2xjazwa
 
JSM2013,Proceedings,paper307699_79238,DSweitzer
JSM2013,Proceedings,paper307699_79238,DSweitzerJSM2013,Proceedings,paper307699_79238,DSweitzer
JSM2013,Proceedings,paper307699_79238,DSweitzerDennis Sweitzer
 
Analysis of variance (ANOVA)
Analysis of variance (ANOVA)Analysis of variance (ANOVA)
Analysis of variance (ANOVA)
Sneh Kumari
 
eMba i qt unit-5_sampling
eMba i qt unit-5_samplingeMba i qt unit-5_sampling
eMba i qt unit-5_sampling
Rai University
 
Question 1.A group of researchers is replicating an earlier .docx
Question 1.A group of researchers is replicating an earlier .docxQuestion 1.A group of researchers is replicating an earlier .docx
Question 1.A group of researchers is replicating an earlier .docx
IRESH3
 
PR 2, WEEK 2.pptx
PR 2, WEEK 2.pptxPR 2, WEEK 2.pptx
PR 2, WEEK 2.pptx
allandavecastrosibba
 

Similar to Optimal Stopping Report Final (20)

The t Test for Two Related Samples
The t Test for Two Related SamplesThe t Test for Two Related Samples
The t Test for Two Related Samples
 
EMBODO LP Grade 12 Mean and Variance of the Sampling Distribution of the Samp...
EMBODO LP Grade 12 Mean and Variance of the Sampling Distribution of the Samp...EMBODO LP Grade 12 Mean and Variance of the Sampling Distribution of the Samp...
EMBODO LP Grade 12 Mean and Variance of the Sampling Distribution of the Samp...
 
Analyzing experimental research data
Analyzing experimental research dataAnalyzing experimental research data
Analyzing experimental research data
 
Contingent Weighting in Judgment and Choice
Contingent Weighting in Judgment and ChoiceContingent Weighting in Judgment and Choice
Contingent Weighting in Judgment and Choice
 
Foundations of Experimental Design
Foundations of Experimental DesignFoundations of Experimental Design
Foundations of Experimental Design
 
Response of Watermelon to Five Different Rates of Poultry Manure in Asaba Are...
Response of Watermelon to Five Different Rates of Poultry Manure in Asaba Are...Response of Watermelon to Five Different Rates of Poultry Manure in Asaba Are...
Response of Watermelon to Five Different Rates of Poultry Manure in Asaba Are...
 
Research Procedure
Research ProcedureResearch Procedure
Research Procedure
 
11 T(EA) FOR TWO TESTS BETWEEN THE MEANS OF DIFFERENT GROUPS11 .docx
11 T(EA) FOR TWO TESTS BETWEEN THE MEANS OF DIFFERENT GROUPS11 .docx11 T(EA) FOR TWO TESTS BETWEEN THE MEANS OF DIFFERENT GROUPS11 .docx
11 T(EA) FOR TWO TESTS BETWEEN THE MEANS OF DIFFERENT GROUPS11 .docx
 
11 T(EA) FOR TWO TESTS BETWEEN THE MEANS OF DIFFERENT GROUPS11 .docx
11 T(EA) FOR TWO TESTS BETWEEN THE MEANS OF DIFFERENT GROUPS11 .docx11 T(EA) FOR TWO TESTS BETWEEN THE MEANS OF DIFFERENT GROUPS11 .docx
11 T(EA) FOR TWO TESTS BETWEEN THE MEANS OF DIFFERENT GROUPS11 .docx
 
AJSR_23_01
AJSR_23_01AJSR_23_01
AJSR_23_01
 
Statistics Chapter 01[1]
Statistics  Chapter 01[1]Statistics  Chapter 01[1]
Statistics Chapter 01[1]
 
Parametric Statistics
Parametric StatisticsParametric Statistics
Parametric Statistics
 
Unit3
Unit3Unit3
Unit3
 
slides Testing of hypothesis.pptx
slides Testing  of  hypothesis.pptxslides Testing  of  hypothesis.pptx
slides Testing of hypothesis.pptx
 
Directions The purpose of Project 8 is to prepare you for the final.docx
Directions The purpose of Project 8 is to prepare you for the final.docxDirections The purpose of Project 8 is to prepare you for the final.docx
Directions The purpose of Project 8 is to prepare you for the final.docx
 
JSM2013,Proceedings,paper307699_79238,DSweitzer
JSM2013,Proceedings,paper307699_79238,DSweitzerJSM2013,Proceedings,paper307699_79238,DSweitzer
JSM2013,Proceedings,paper307699_79238,DSweitzer
 
Analysis of variance (ANOVA)
Analysis of variance (ANOVA)Analysis of variance (ANOVA)
Analysis of variance (ANOVA)
 
eMba i qt unit-5_sampling
eMba i qt unit-5_samplingeMba i qt unit-5_sampling
eMba i qt unit-5_sampling
 
Question 1.A group of researchers is replicating an earlier .docx
Question 1.A group of researchers is replicating an earlier .docxQuestion 1.A group of researchers is replicating an earlier .docx
Question 1.A group of researchers is replicating an earlier .docx
 
PR 2, WEEK 2.pptx
PR 2, WEEK 2.pptxPR 2, WEEK 2.pptx
PR 2, WEEK 2.pptx
 

Optimal Stopping Report Final

  • 1. The Effect of Time Pressure on Solving Optimal Stopping Problems William Teng 94396558/Michael Dawson Nunez wteng1@uci.edu Abstract Optimal decision process has repeatedly been explored within experimental psychology in order to simulate and understand real- world decision-making. This concept is a highly relevant idea used in fields spanning from psychology to finance. The purpose of our current study is to bring about learning of optimal decision-making within subjects, and to examine differences in performance between conditions varying in amount of alternatives presented through the use of an optimal stopping task. Our results failed to yield any statistically significant evidence indicating learning. However, subjects belonging to the shorter condition were found to demonstrate significantly higher performance than subjects participating in the longer condition. 1 Introduction   Nearly every instance of human behavior and interaction is narrated by a series of decisions. Given the complex and competitive nature of modern societies, learning to make sound and efficient decisions has become a crucial and necessary trait for attaining successes and rewards. However, one is often faced with the difficult task of making decisions without complete knowledge of all relevant information and alternatives. As Campbell and Lee (2006) states, “Many real world decision-making problems are sequential in nature. A series of choices is made available over time, and it is often efficient (and sometimes even necessary) to make a selection without waiting to be presented with all of the alternatives” (p. 1068). This process of decision-making can be studied in an experimental setting using what is known as an “optimal stopping” task (otherwise referred to as the “secretary problem”). An optimal stopping experiment simulates real world decision-making by presenting an observer with a series of possible choices, at which point the observer must decide whether to accept or reject the current choice as the best alternative. Each alternative is only presented once and can only be chosen during the time of presentation. This task urges participants to utilize an “optimal (rational) decision process” which involves choosing the first alternative containing a value that is both greater than the optimal threshold (a decreasing function of optimal points dependent on a choice’s serial positioning within a series) as well as all previously presented alternatives (Vandekerckhove, 2014, p. 12).
  • 2. Campbell and Lee (2006) studied learning in optimal decision making through the use of a five-point problem optimal stopping task, in which each problem series contained a set of five choices. The choices were comprised of two- decimal point numbers uniformly distributed across a scale from 0 – 100. They also studied the effects of feedback on learning by manipulating for conditions of no feedback, outcome feedback, and full feedback. Financial rewards were also controlled for by providing one group of subjects with no financial incentive, whereas, the other was paid five dollars for participating with room for additional monetary rewards if predetermined quotas of correct responses were met. The results of their experiment yielded no significant evidence that would suggest learning during the task. Feedback and financial rewards also failed to demonstrate any significant effects towards learning. Nonetheless, when overall performance was analyzed, an interaction between feedback and reward was found to increase optimal decision-making but still showed no signs of learning (Campbell & Lee, 2006, p. 1073). The purpose of our current study is to bring about learning of optimal decision-making within subjects, as well as to examine differences in performance between conditions varying in numbers of alternatives presented through the use of an optimal stopping task. To do so, we will utilize a 2X3 mixed ANOVA model and a 2X4 mixed ANOVA model using series of numbers as our stimuli. The manipulated variables are length of series and size of blocks. The variable “length” will be controlled to be either series of three number choices (short) or of seven number choices (long). Furthermore, data from 120 trials will then be divided into three blocks consisting of 40 trials for model 1; and four 30 trials blocks for model 2. We hypothesize that rational decision-making performance will improve between the first block and the last indicating an occurrence of learning. Secondly, we predict that overall performance of correct rational decisions will be higher for the short condition than the long condition. 2 Experiment   2.1 Participants For this optimal stopping experiment, we enlisted a total of 71 participants. All participants were recruited from the same population of only University of California, Irvine undergraduate students belonging to the Psychology subject’s pool. 45 subjects completed the task under the long condition, whereas, the remaining 26 were tested in the short condition. 2.2 Stimuli The experiment was performed through the use of 120 generated series of numbers as its stimuli. There existed two experimental conditions defined as either short or long. The short conditions generated series of three numbers as opposed to the long conditions, which utilized series of seven numbers. All numbers generated were two-decimal point values and fell between the range of 0 – 100. 2.3 Procedures Each subject was first presented a demonstration trial by his or her experimenter in order to ensure full understanding of the task presented. For all subsequent trials, the participants were presented series of numbers and they were asked to determine the maximum value of each series. Each number within a series was only presented once and could only be accepted or rejected as the maximum value while being shown. Depending on the assigned condition, either the third or seventh numbers were forced selections since they were the last of each respective series. All
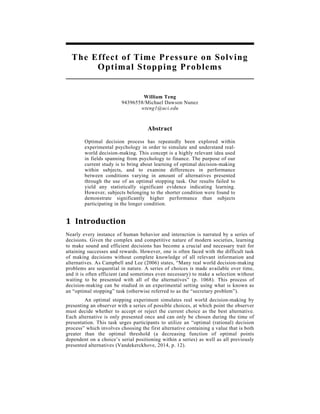
  • 3. participants repeated the task for a total of 120 trials, which were then divided into three blocks of 40 and four blocks of 30. Every participant completed the blocks in the same order, however, the series within each block were randomized. After each trial, immediate outcome feedback was given informing participants whether they were correct or incorrect in choosing the maximum value. 3 Results   Figure 1: Figure 1: A plotted graph displaying mean accuracy of correct rational decision for the “long” and “short” conditions in model 1. Both conditions were separated into three different blocks. A significant difference in performance was found between the three blocks [F (2,138) = 30.461, p < 0.01]. Contrast revealed that subjects made significantly more rational decisions in block 1 than in block 2 [F (1,69) = 50.780, p < 0.01, r² = 0.4239] and block 3 produced more rational decisions than that of block 2 [F (1,69) = 16.115, p < 0.01, r² = 0.1893]. Length also displayed a significant main effect [F (1,69) = 68.377, p < 0.01, r² = 0.4977]. An interaction effect was also found between length of condition and blocks [F (2,138) = 40.039, p < 0.01]. Contrast revealed that the interaction effect of condition length and blocks differed significantly between block 1 and block 2 [F (1,69) = 5.459, p = 0.022, r² = 0.0733] as well as between block 2 and block 3 [F (1,69) = 96.888, p < 0.01, r² = 0.5841].
  • 4. A mixed-design ANOVA for model 1 revealed a significant main effect of blocks on mean rational decision correctness [F (2,138) = 30.461, p < 0.01]. Contrast of the three blocks displayed significantly better performances in rational decision-making during block 1 than block 2 [F (1,69) = 50.780, p < 0.01, r² = 0.4239]. Block 3 was also found to produce more rational decisions than block 2 [F (1,69) = 16.115, p < 0.01, r² = 0.1893] but performance in block 1 was higher than block 3 [F (1,70) = 4.705, p = 0.033, r² = 0.063]. A significant main effect of condition length was found [F (1,69) = 68.377, p < 0.01, r² = 0.4977]. Furthermore, an interaction effect was discovered between condition length and blocks [F (2,138) = 40.039, p < 0.01]. Additional contrast demonstrated that the effects of condition length on blocks differed significantly between block 1 and block 2 [F (1,69) = 5.459, p = 0.022, r² = 0.0733] as well as between block 2 and block 3 [F (1,69) = 96.888, p < 0.01, r² = 0.5841]. Figure 2: Figure 2: A Scatter-plot displaying a positive correlation between the proportion of rational decisions for each subject in block 1 and block 2 [r = 0.679, p < 0.01]. Correlation analysis of block 1 vs. block 2 revealed a positive correlation between the proportion of rational decision making of the two blocks [r = 0.679, p < 0.01].
  • 5. Figure 3: Figure 3: A Scatter-plot displaying the positive correlation between the proportion of rational decisions for each subject in block 2 and block 3 [r = 0.391, p = 0.001]. Correlation analysis of block 2 vs. block 3 revealed a positive correlation between the proportion of rational decision making of the two blocks [r = 0.391, p = 0.001]. Figure 4: Figure 4: A Scatter-plot displaying the positive correlation between the proportion of rational decisions for each subject in block 1 and block 3 [r = 0.391, p = 0.001].
  • 6. Correlation analysis of block 1 vs. block 3 revealed a positive correlation between the proportion of rational decision making of the two blocks [r = 0.391, p = 0.001]. Figure 5: Figure 5: Figure 1: A plotted graph displaying mean accuracy of correct rational decision for the “long” and “short” conditions in model 2. Both conditions were separated into four different blocks. A significant difference in performance was found between the four blocks [F (3,207) = 15.888, p < 0.01]. Contrast revealed that subjects made significantly more rational decisions in block 1 than in block 2 [F (1,69) = 4.557, p = 0.036, r² = 0.062] and block 3 produced less rational decisions than that of block 2 [F (1,69) = 22.323, p < 0.01, r² = 0.2444] while block 4 yielded more rational decisions than block 3 [F (1,69) = 24.166, p < 0.01, r² = 0.2594]. Length also displayed a significant main effect [F (1,69) = 68.377, p < 0.01, r² = 0.4977]. An interaction effect was also found between length of condition and blocks [F (3,207) = 21.120, p < 0.01]. Contrast revealed that the effect of condition length differed significantly between block 1 and block 2 [F (1,69) = 6.163, p = 0.015, r² = 0.082] and between block 3 and block 4 [F (1,69) = 33.125, p < 0.01, r² = 0.3244] but not between block 2 and block 3 [F (1,69) = 2.981, p = 0.089]. A repeated measures ANOVA for model 2 yielded a significant main effect of blocks on optimal decision making [F (3,207) = 15.888, p < 0.01]. A significant effect of length was also discovered [F (1,69) = 68.377, p < 0.01, r² = 0.4977]. Interaction between blocks and length once again proved to be significant [F (3,207) = 21.120, p < 0.01]. Contrast for blocks revealed that subjects made significantly
  • 7. more rational decisions in block 1 than in block 2 [F (1,69) = 4.557, p = 0.036, r² = 0.062] and block 3 produced less rational decisions than that of block 2 [F (1,69) = 22.323, p < 0.01, r² = 0.2444] while block 4 yielded more rational decisions than block 3 [F (1,69) = 24.166, p < 0.01, r² = 0.2594]. Additional contrast of interaction demonstrated that the effect of condition length differed significantly between block 1 and block 2 [F (1,69) = 6.163, p = 0.015, r² = 0.082] and between block 3 and block 4 [F (1,69) = 33.125, p < 0.01, r² = 0.3244] but not between block 2 and block 3 [F (1,69) = 2.981, p = 0.089]. Figure 6: Figure 6: A Scatter-plot displaying the positive correlation between the proportion of rational decisions for each subject in block 1 and block 2 of model 2 [r = 0.651, p < 0.01]. Correlation analysis of block 1 vs. block 2 of model 2 revealed a positive correlation between the proportion of rational decision making of the two blocks [r = 0.0.651, p < 0.01]. 4 Discussion   For the current study, participants were tested using an optimal stopping task in order to explore the optimal decision process. The experimental design was manipulated to have both a short and long condition for the sake of illustrating the effects condition length has on optimal decision performance. Furthermore, all data were separated into blocks to determine whether learning occurred across trials The results successfully showed a significant main effect of condition length on subsequent optimal decision performance. The short condition was proven to elicit better performance than the long condition, thus, confirming our first hypothesis. This is an interesting discovery because it has direct applications to everyday situations. Perhaps, as common practices often demonstrate, an increase in
  • 8. choices causes complexity and promotes indecisiveness; consequently, the ability to make proper and efficient decisions begins to decline. Another fascinating point to consider is the emotional impact an individual may experience when faced with too many alternatives. It may be that high number of choices can prove overwhelming; resulting in apprehension and anxiety, which then affects decision-making. An alternative optimal stopping study could manipulate emotion and mood through some version of priming and analyze whether positive vs. negative moods have a significant impact on ability to follow the rational rule. Our second hypothesis, however, failed to generate any statistical support. Initially, we predicted an increase in optimal decision performance from early blocks to later blocks due to learning; unfortunately, results showed statistically significant decreases in performance across trials. For both models used, decision- making using the rational rule decreased from blocks 1 to blocks 2, however, performance began to slightly increase from blocks 2 towards blocks 3 or 4. Correlation analysis would reveal a positive linear relationship in proportion rationality between blocks 1 and blocks 2 in both models. This suggests that a significant amount of variability can be accounted for by individual differences in decision-making abilities. In contrast, the correlational value between blocks 2 and blocks 3, or blocks 4 for model 2, is low so it would be dangerous to explain variation under the assumption of individual differences (despite a statistically significant positive correlation). Instead, what may have caused the slight increase in performance could be attributed to the interaction effect found between length and blocks. Upon further examination of Figure 1, it is worth noting that the short condition followed a trend of constant decrease in optimal decisions, whereas, the long condition seemed to increase during the last block of trials. Perhaps this is an indication of learning under longer condition. This would be an interesting implication and is worth further studies using even larger series of choices. Another factor that may have affected learning was the feedback given at each trial. The feedbacks were designed to inform subjects of correct acceptance of the maximum value as opposed to the optimal value. It is possible that learning was inhibited because participants received negative feedback despite correctly identifying an optimal value. In conclusion, the current study was able to successfully demonstrate that shorter conditions yield higher levels of optimal decision performance. However, like Campbell and Lee’s (2006) experiment, significant evidence of learning failed to be collected. Nonetheless, this study has raised an interesting question regarding the effects of emotion on optimal decision-making. Furthermore, it may have also shown slight implications of learning. Additional research on optimal decision process should be considered and will be crucial in our quest to understanding the fundamental luxury and right of human consciousness, freedom of choice. References   Campbell, J., & Lee, M. (2006). The effect of feedback and financial reward on human performance solving ‘secretary’ problems. 1068-1073. Retrieved from https://eee.uci.edu/14w/68200/psych112bw/p1068 1 .pdf Vandekerckhove, J. (2014). Lecture 8 [PowerPoint slides]. Retrieved from https://eee.uci.edu/14w/68200/psych112bw/lec8_p112bw.pdf`