Downloaded 12 times


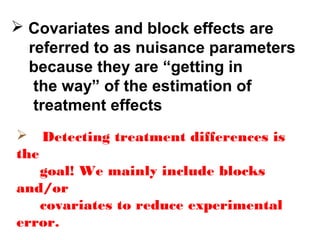


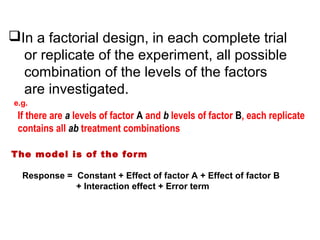


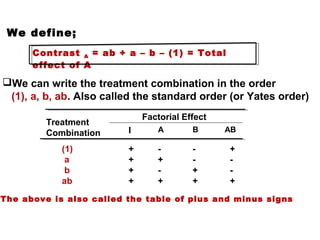
![The symbols (1), a, b, ab represents the total
of the observation at all n replicates
taken at a treatment combination
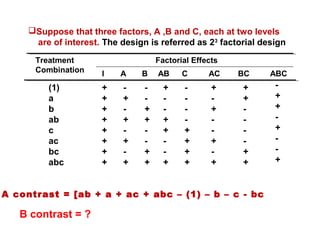
A main effect = 1/2n[ab + a – b – (1)]
B main effect = 1/2n[ab +b - a – (1)]
AB effect = 1/2n{[ab + (1) – a – b]](https://image.slidesharecdn.com/biometrynotice-171116184009/85/Biometry-BOOK-by-mbazi-E-81-320.jpg)


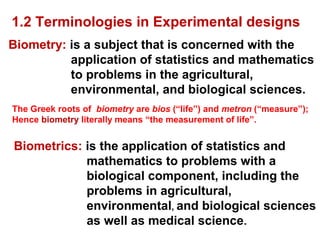
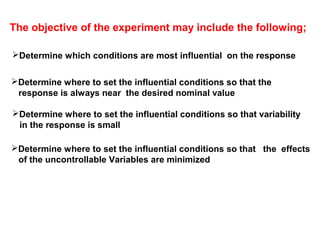
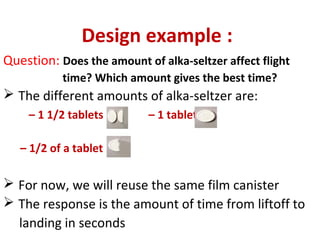
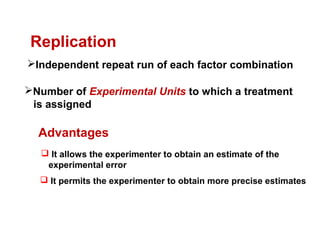
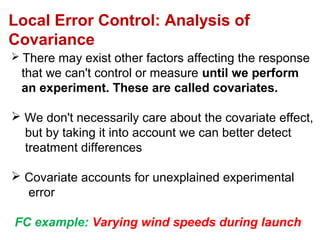
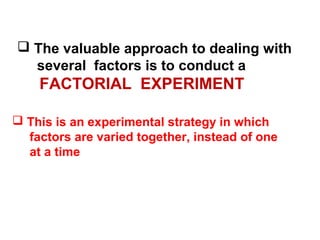
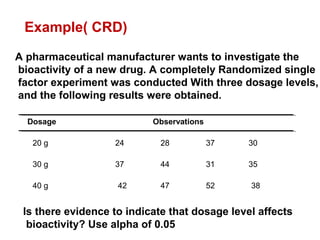
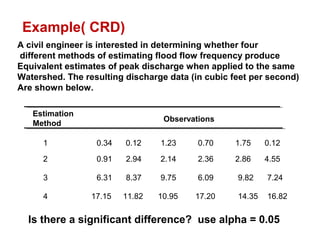
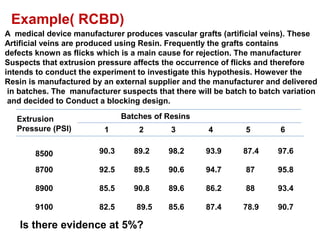
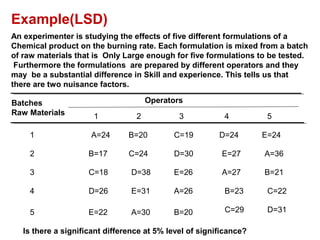
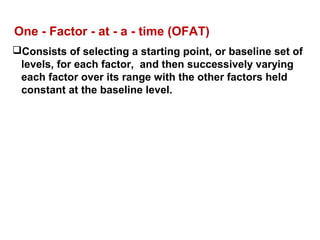
The document outlines the course contents for MTH 201 Biometry. It covers topics such as designing experiments, analysis of variance, experimental designs including completely randomized design, randomized complete block design, Latin square design, and factorial experiments. It provides examples of key concepts such as treatments, experimental units, randomization, replication, and blocking. The document also gives an example of a potential film canister experiment to demonstrate these fundamental design principles.


![CONSTRUCTION [soil treatment, foundation backfill, Damp Proof Membrane[DPM] a...](https://cdn.slidesharecdn.com/ss_thumbnails/kahimba-181220112907-thumbnail.jpg?width=640&height=640&fit=bounds)


