Download to read offline
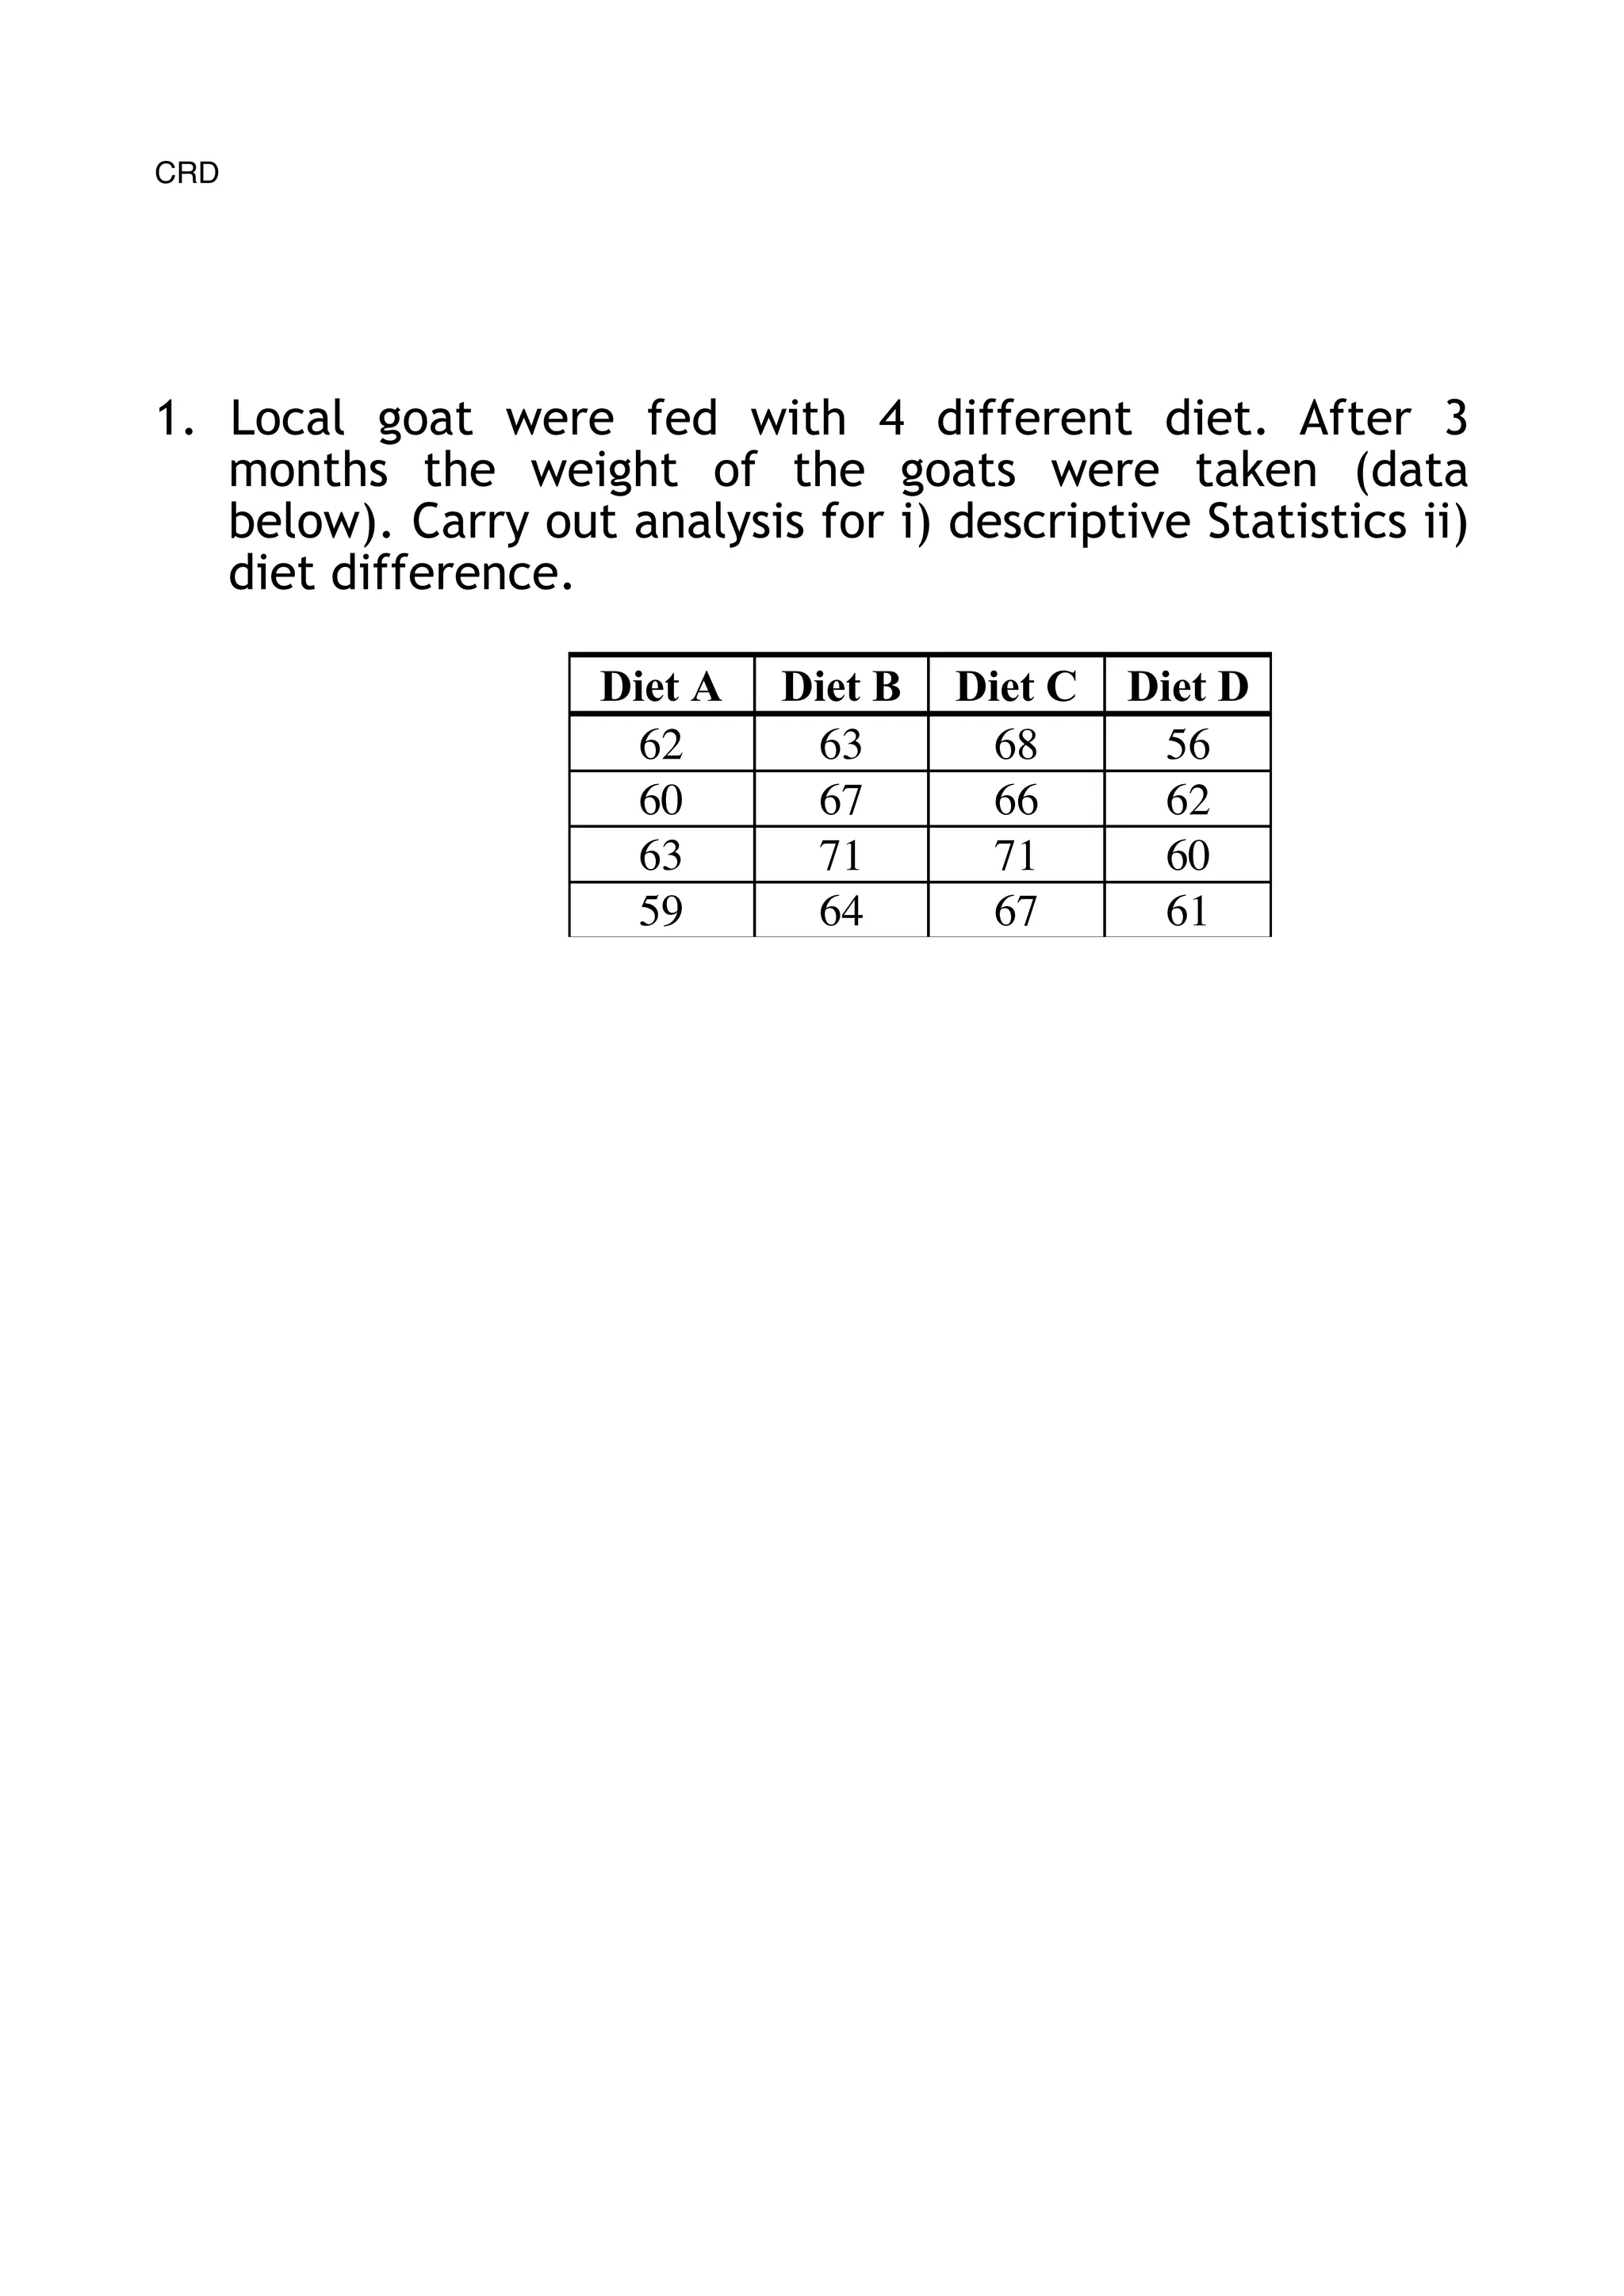

The document discusses using a completely randomized design (CRD) to analyze data from an experiment testing the effects of 4 diets (A, B, C, D) on goat weights. It notes that the CRD does not account for differences in cage heights where the goats on different diets were located. The results show Diet A goats were in lower cages and Diet D goats higher. It recommends a randomized block design may better account for location effects. A one-way ANOVA is used to analyze if diet had an effect, with the null hypothesis being no difference in means and alternative of at least one mean being different. The ANOVA table results show a significant effect of diet on weight.


