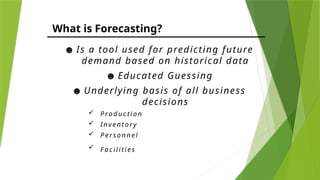
What is Forecasting?
☻Is a tool used for predicting future
demand based on historical data
☻ Educated Guessing
☻ Underlying basis of all business
decisions
P ro duc tio n
Inv ento ry
P erso n nel
F a c i l iti es
4.
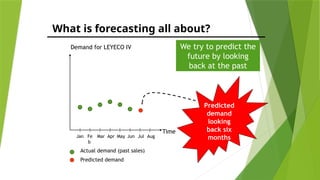
What is forecastingall about?
Demand for LEYECO IV
Time
Jan Fe
b
Mar Apr May Jun Jul Aug
Actual demand (past sales)
Predicted demand
We try to predict the
future by looking
back at the past
Predicted
demand
looking
back six
months
5.
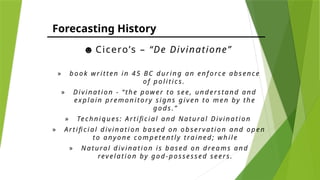
Forecasting History
☻ Cicero’s– “De Divinatione”
» bo o k w r itten i n 45 BC dur in g a n enf o rc e a bs en c e
o f p ol i tic s.
» Di vi n a tio n - “ th e pow er t o s ee, un d ers ta nd a nd
ex p l a in p remo n ito ry si gn s gi ven to men by the
go ds . ”
» Tec hn iq ues : A rti fic i a l a nd Na tu ra l Di vi na t io n
» A rti fic i a l d iv i na ti o n ba s ed o n o b serv a tio n a n d o pen
to a n y on e c o m peten tly tra i n ed ; w h il e
» N a tura l d iv i na ti o n is b a sed o n drea ms a n d
rev ela ti o n by go d -p os sess ed seers.
6.
Forecasting History cont.
“in ev ery fiel d o f in j ury a g rea t leng th o f ti me
emp l oy ed i n c o n tin ued o bs er va ti o n begets a n
ex tra ordi n a ry f un d o f k now ledg e, w hi c h m a y be
a c q ui red ev en w it ho ut the in tervent io n o r i ns pira ti o n
o f th e go ds , s in c e repea ted ob serv a tio n ma kes i t c l ea r
w ha t eff ec t fo l l ow s a n y gi v en c a use a nd w ha t si gn
prec ed es a ny g iv en even t.”
Theory-Free Forecasting
“
7.
Why is forecastingimportant?
Demand for products and services is
usually uncertain.
Forecasting can be used for . . .
☻ Strategic planning
☻ Finance and Accounting
☻ Marketing
☻ Production & Operations
8.
Why is forecastingimportant? (cont.)
Departments depend on forecasts to formulate
their plans.
☻ Accounting – Cost/Profit estimates
☻ Finance – cash flow and funding
☻ Human resources – hiring/recruitment/training
☻ Marketing – Pricing, Promotion, Strategy
☻ MIS – IT/IS systems, services
☻ Operations – Schedules, workloads
☻ Product/Service design – new
products/services2
9.
Some General Characteristicsof
Forecasts
☻Forecasts are seldom perfect
☻Most techniques assume an underlying
stability in the system
☻Product family and aggregated forecasts are
more accurate than individual product
forecast
☻Forecasts are more accurate for shorter time
periods
☻Every forecast should include an error
estimate
10.
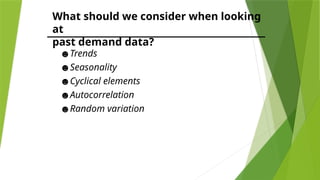
What should weconsider when looking
at
past demand data?
☻Trends
☻Seasonality
☻Cyclical elements
☻Autocorrelation
☻Random variation
11.
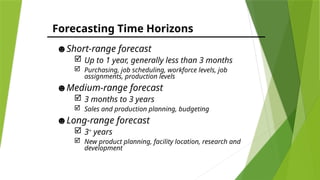
Forecasting Time Horizons
☻Short-rangeforecast
Up to 1 year, generally less than 3 months
Purchasing, job scheduling, workforce levels, job
assignments, production levels
☻Medium-range forecast
3 months to 3 years
Sales and production planning, budgeting
☻Long-range forecast
3+
years
New product planning, facility location, research and
development
12.
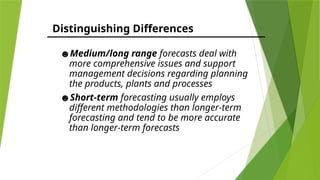
Distinguishing Differences
☻Medium/long rangeforecasts deal with
more comprehensive issues and support
management decisions regarding planning
the products, plants and processes
☻Short-term forecasting usually employs
different methodologies than longer-term
forecasting and tend to be more accurate
than longer-term forecasts
13.
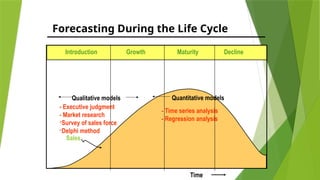
Forecasting During theLife Cycle
Introduction Growth Maturity Decline
Time
Quantitative models
- Time series analysis
- Regression analysis
Qualitative models
- Executive judgment
- Market research
-Survey of sales force
-Delphi method
Sales
14.
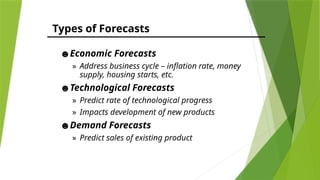
Types of Forecasts
☻EconomicForecasts
» Address business cycle – inflation rate, money
supply, housing starts, etc.
☻Technological Forecasts
» Predict rate of technological progress
» Impacts development of new products
☻Demand Forecasts
» Predict sales of existing product
15.
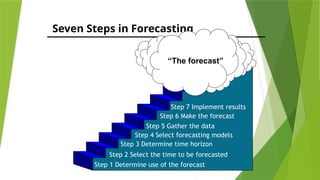
Seven Steps inForecasting
Step 1 Determine use of the forecast
Step 2 Select the time to be forecasted
Step 3 Determine time horizon
Step 4 Select forecasting models
Step 5 Gather the data
Step 6 Make the forecast
“The forecast”
Step 7 Implement results
16.
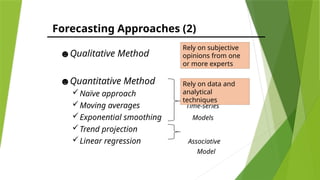
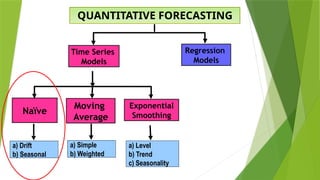
Forecasting Approaches (2)
☻QualitativeMethod
☻Quantitative Method
Naïve approach
Moving averages Time-series
Exponential smoothing Models
Trend projection
Linear regression Associative
Model
Rely on subjective
opinions from one
or more experts
Rely on data and
analytical
techniques
17.
How should wepick out forecasting
model?
☻Data availability
☻Time horizon for the forecast
☻Required accuracy
☻Required resources
Common Attributes andAssumptions
Inherent in Forecasting
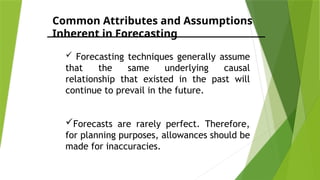
Forecasting techniques generally assume
that the same underlying causal
relationship that existed in the past will
continue to prevail in the future.
Forecasts are rarely perfect. Therefore,
for planning purposes, allowances should be
made for inaccuracies.
20.
Common Attributes andAssumptions
Inherent in Forecasting
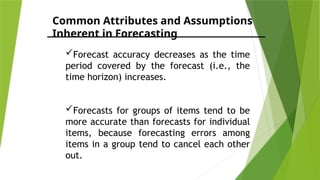
Forecast accuracy decreases as the time
period covered by the forecast (i.e., the
time horizon) increases.
Forecasts for groups of items tend to be
more accurate than forecasts for individual
items, because forecasting errors among
items in a group tend to cancel each other
out.
Features of aQualitative Forecasting
Method
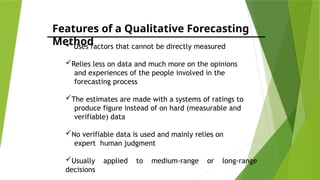
Uses factors that cannot be directly measured
Relies less on data and much more on the opinions
and experiences of the people involved in the
forecasting process
The estimates are made with a systems of ratings to
produce figure instead of on hard (measurable and
verifiable) data
No verifiable data is used and mainly relies on
expert human judgment
Usually applied to medium-range or long-range
decisions
Executive Judgment
- Subjectiveviews of executives or experts from
sales, production, finance, purchasing, and
administration are averaged to generate a forecast
about future sales
ADVANTAGES
Done quickly and easily without need of elaborate
statistics
No formal requirements in terms of historical data
Timely in that the forecast is generated on the basis of the
most current situation
The knowledge on which the forecast is based is extremely
rich
25.
Executive Judgment
DISADVANTAGES
The informationon which the individual
forecasts are based could differ from period to
period
The composition of the group might differ
Creates problems inherent to those who meet
in group which may raise issues on high
cohesiveness, strong leadership and insulation
of the group
26.
Sales Force Composite
-A sales force estimate involves obtaining the
judgments from the sales-force. Each salesperson will
provide a forecast for each product or product type by
customer.
ADVANTAGES
It is simple to use and understand
It uses the specialized knowledge of those closest to the
action
It can place responsibility for attaining the forecast in the
hands of those who most affect the actual results
The information can be broken down easily by territory,
product, customer, or salesperson
27.
Sales Force Composite
DISADVANTAGES
Salespeople’sbeing overly optimistic or
pessimistic regarding their predictions and
inaccuracies due to broader economic events
that are largely beyond their control
Salespeople often lack relevant information
about a company’s plans and overall industry
trends
28.
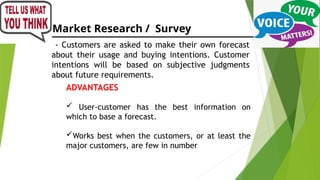
Market Research /Survey
- Customers are asked to make their own forecast
about their usage and buying intentions. Customer
intentions will be based on subjective judgments
about future requirements.
ADVANTAGES
User-customer has the best information on
which to base a forecast.
Works best when the customers, or at least the
major customers, are few in number
29.
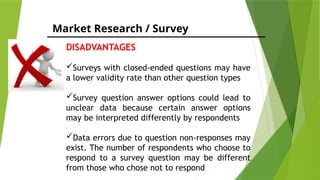
Market Research /Survey
DISADVANTAGES
Surveys with closed-ended questions may have
a lower validity rate than other question types
Survey question answer options could lead to
unclear data because certain answer options
may be interpreted differently by respondents
Data errors due to question non-responses may
exist. The number of respondents who choose to
respond to a survey question may be different
from those who chose not to respond
30.
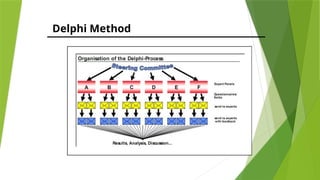
Delphi Method
- Agroup technique in which a panel of experts is
questioned individually about their perceptions of
future events. The experts do not meet as a group
in order to reduce the possibility that consensus is
reached because of dominant personality factors.
- It begins with the development of a set of open-
ended questions on a specific issue. These questions
are then distributed to various ‘experts’.
- The responses and accompanying arguments are
summarized by an outside party and returned to the
experts along with further questions. This continues
until a consensus is reached.
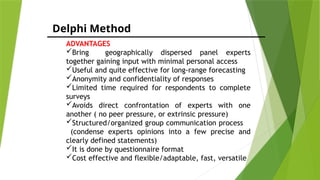
Delphi Method
ADVANTAGES
Bring geographicallydispersed panel experts
together gaining input with minimal personal access
Useful and quite effective for long-range forecasting
Anonymity and confidentiality of responses
Limited time required for respondents to complete
surveys
Avoids direct confrontation of experts with one
another ( no peer pressure, or extrinsic pressure)
Structured/organized group communication process
(condense experts opinions into a few precise and
clearly defined statements)
It is done by questionnaire format
Cost effective and flexible/adaptable, fast, versatile
33.
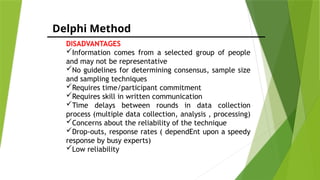
Delphi Method
DISADVANTAGES
Information comesfrom a selected group of people
and may not be representative
No guidelines for determining consensus, sample size
and sampling techniques
Requires time/participant commitment
Requires skill in written communication
Time delays between rounds in data collection
process (multiple data collection, analysis , processing)
Concerns about the reliability of the technique
Drop-outs, response rates ( dependEnt upon a speedy
response by busy experts)
Low reliability
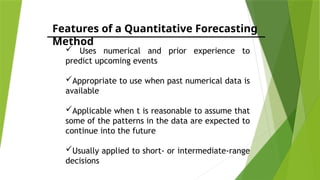
Features of aQuantitative Forecasting
Method
Uses numerical and prior experience to
predict upcoming events
Appropriate to use when past numerical data is
available
Applicable when t is reasonable to assume that
some of the patterns in the data are expected to
continue into the future
Usually applied to short- or intermediate-range
decisions
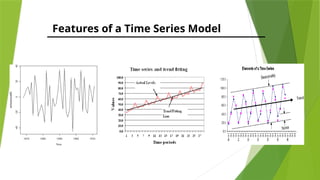
Features of aTime Series Model
Makes forecasts based solely on historical
patterns in the data. The historical data is
representative of the conditions expected in the
future
Uses time as independent variable to produce
demand
Measurements are taken at successive points
or over successive periods
Naïve Method
Anestimating technique in which the last period's
actual data are used as this period's forecast, without
adjusting them or attempting to establish causal
factors. It is used only for comparison with the
forecasts generated by the better (sophisticated)
techniques
Drift Method - allow the forecasts to increase or
decrease over time, where the amount of change over
time is set to be the average change seen in the
historical data
Seasonal Naïve Method - forecast is set as equal to the
last observed value from the same season of the year
40.
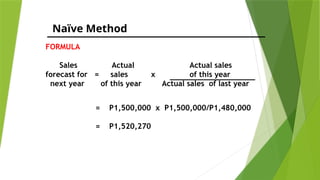
Naïve Method
FORMULA
Sales ActualActual sales
forecast for = sales x of this year
next year of this year Actual sales of last year
= P1,500,000 x P1,500,000/P1,480,000
= P1,520,270
41.
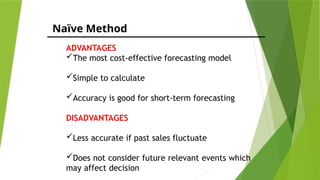
Naïve Method
ADVANTAGES
The mostcost-effective forecasting model
Simple to calculate
Accuracy is good for short-term forecasting
DISADVANTAGES
Less accurate if past sales fluctuate
Does not consider future relevant events which
may affect decision
42.
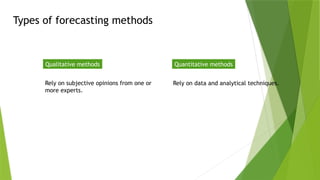
Types of forecastingmethods
Rely on data and analytical techniques.
Rely on subjective opinions from one or
more experts.
Qualitative methods Quantitative methods
43.
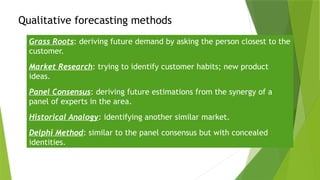
Qualitative forecasting methods
GrassRoots: deriving future demand by asking the person closest to the
customer.
Market Research: trying to identify customer habits; new product
ideas.
Panel Consensus: deriving future estimations from the synergy of a
panel of experts in the area.
Historical Analogy: identifying another similar market.
Delphi Method: similar to the panel consensus but with concealed
identities.
44.
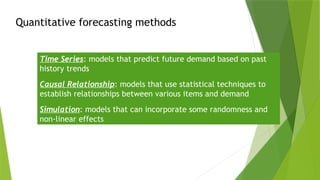
Quantitative forecasting methods
TimeSeries: models that predict future demand based on past
history trends
Causal Relationship: models that use statistical techniques to
establish relationships between various items and demand
Simulation: models that can incorporate some randomness and
non-linear effects
45.
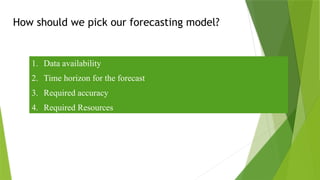
How should wepick our forecasting model?
1. Data availability
2. Time horizon for the forecast
3. Required accuracy
4. Required Resources
46.
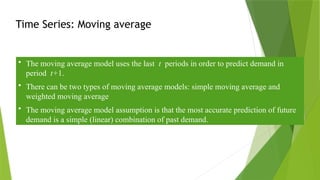
Time Series: Movingaverage
• The moving average model uses the last t periods in order to predict demand in
period t+1.
• There can be two types of moving average models: simple moving average and
weighted moving average
• The moving average model assumption is that the most accurate prediction of future
demand is a simple (linear) combination of past demand.
47.
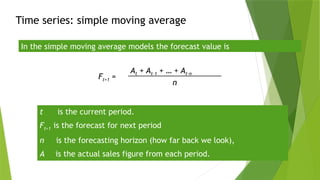
Time series: simplemoving average
In the simple moving average models the forecast value is
Ft+1 =
At + At-1 + … + At-n
n
t is the current period.
Ft+1 is the forecast for next period
n is the forecasting horizon (how far back we look),
A is the actual sales figure from each period.
48.
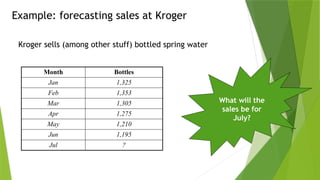
Example: forecasting salesat Kroger
Kroger sells (among other stuff) bottled spring water
Month Bottles
Jan 1,325
Feb 1,353
Mar 1,305
Apr 1,275
May 1,210
Jun 1,195
Jul ?
What will the
sales be for
July?
49.
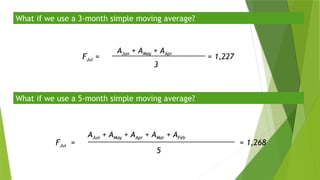
What if weuse a 3-month simple moving average?
FJul =
AJun + AMay + AApr
3
= 1,227
What if we use a 5-month simple moving average?
FJul =
AJun + AMay + AApr + AMar + AFeb
5
= 1,268
50.
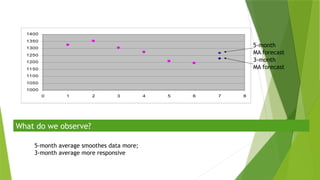
What do weobserve?
1000
1050
1100
1150
1200
1250
1300
1350
1400
0 1 2 3 4 5 6 7 8
3-month
MA forecast
5-month
MA forecast
5-month average smoothes data more;
3-month average more responsive
51.
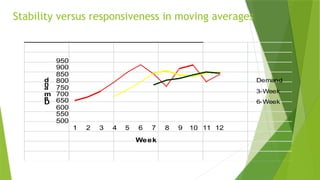
Stability versus responsivenessin moving averages
500
550
600
650
700
750
800
850
900
950
1 2 3 4 5 6 7 8 9 10 11 12
D
e
m
a
n
d
Week
Demand
3-Week
6-Week
52.
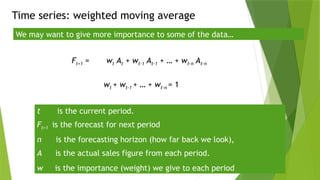
Time series: weightedmoving average
We may want to give more importance to some of the data…
Ft+1 = wt At + wt-1 At-1 + … + wt-n At-n
wt + wt-1 + … + wt-n = 1
t is the current period.
Ft+1 is the forecast for next period
n is the forecasting horizon (how far back we look),
A is the actual sales figure from each period.
w is the importance (weight) we give to each period
53.
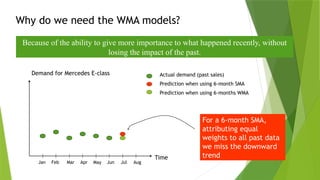
Why do weneed the WMA models?
Because of the ability to give more importance to what happened recently, without
losing the impact of the past.
Demand for Mercedes E-class
Time
Jan Feb Mar Apr May Jun Jul Aug
Actual demand (past sales)
Prediction when using 6-month SMA
Prediction when using 6-months WMA
For a 6-month SMA,
attributing equal
weights to all past data
we miss the downward
trend
54.
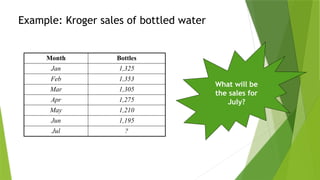
Example: Kroger salesof bottled water
Month Bottles
Jan 1,325
Feb 1,353
Mar 1,305
Apr 1,275
May 1,210
Jun 1,195
Jul ?
What will be
the sales for
July?
55.
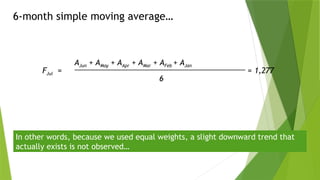
6-month simple movingaverage…
In other words, because we used equal weights, a slight downward trend that
actually exists is not observed…
FJul =
AJun + AMay + AApr + AMar + AFeb + AJan
6
= 1,277
56.
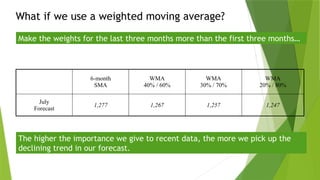
What if weuse a weighted moving average?
Make the weights for the last three months more than the first three months…
6-month
SMA
WMA
40% / 60%
WMA
30% / 70%
WMA
20% / 80%
July
Forecast
1,277 1,267 1,257 1,247
The higher the importance we give to recent data, the more we pick up the
declining trend in our forecast.
57.
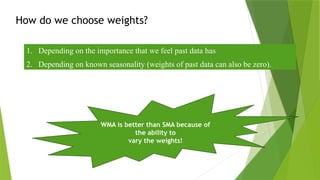
How do wechoose weights?
1. Depending on the importance that we feel past data has
2. Depending on known seasonality (weights of past data can also be zero).
WMA is better than SMA because of
the ability to
vary the weights!
58.
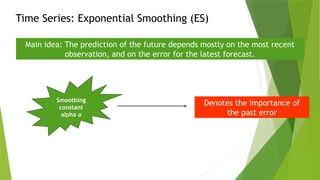
Time Series: ExponentialSmoothing (ES)
Main idea: The prediction of the future depends mostly on the most recent
observation, and on the error for the latest forecast.
Smoothing
constant
alpha α
Denotes the importance of
the past error
59.
Why use exponentialsmoothing?
1. Uses less storage space for data
2. Extremely accurate
3. Easy to understand
4. Little calculation complexity
5. There are simple accuracy tests
60.
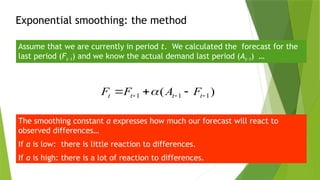
Exponential smoothing: themethod
Assume that we are currently in period t. We calculated the forecast for the
last period (Ft-1) and we know the actual demand last period (At-1) …
)
( 1
1
1
t
t
t
t F
A
F
F
The smoothing constant α expresses how much our forecast will react to
observed differences…
If α is low: there is little reaction to differences.
If α is high: there is a lot of reaction to differences.
61.
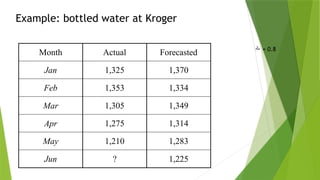
Example: bottled waterat Kroger
Month Actual Forecasted
Jan 1,325 1,370
Feb 1,353 1,361
Mar 1,305 1,359
Apr 1,275 1,349
May 1,210 1,334
Jun ? 1,309
= 0.2
62.
Example: bottled waterat Kroger
= 0.8
Month Actual Forecasted
Jan 1,325 1,370
Feb 1,353 1,334
Mar 1,305 1,349
Apr 1,275 1,314
May 1,210 1,283
Jun ? 1,225
Editor's Notes
#2 Niels Henrik David Bohr – was a Danish physicist (a scientist trained to understand the interactions of matter and energy across the physical universe) who made foundational contributions to understanding atomic structure and quantum theory. Was also a philosopher and a promoter of scientific research.
#5 the most important ancient source of techniques of prediction and control is Cicero’s De Divinatione - Latin word concerning on Divination.
This book is in the form of a dialogue whose interlocutors are Cicero MARCUS TULLIUS CICERO (Greek, Roman Philosopher, political, lawyer, orator, political theorist, consul and constitutionalist. Considered as one of Rome’s greatest orators and prose stylists. (speaking mostly in book II) and his brother Quintus.
Artificial Divination – based on observation and open to anyone competently trained. Subdivisions: Divination from living things, such as behavior of birds. Divination from lifeless things such as casting of lots, weather anomalies and above all astrology.
Natural divination – based on dreams and revelation by god-possessed seers. ND comes from within.
Those artificial diviners employ art, who having learned the known by observation, seek the unknown by deduction. On the other hand those do without art, who forecasts the future while under the influence of excitement.
#6 The modern distinction between the theory-free and structural models repeat the ancient distinction between artificial and natural divination. The ARTIFICIAL relies on the external signs, observed 470,000 times. The NATURAL relies on the internal intuitions in the form of specifications of the structure or the other constraints of an economic theory not itself derived from the signs.
#7 Strategic planning (long range planning) Strategic planning is an organization's process of defining its strategy, or direction, and making decisions on allocating its resources to pursue this strategy. It may also extend to control mechanisms for guiding the implementation of the strategy.
Finance & Accounting (budgets and cost controls)
Marketing (future sales, new products)
Production & Operations
#8 Departments cannot pursue their plans without forecasting.
Ex. LEYECO IV’s systems loss. Forecasts % is 10%
#9 - Forecasts more accurate for groups vs. individuals.
Forecasting errors among items in a group usually have a canceling effect.
Extremes in a group cancel each other
Ex. I can forecast the class average from the midterm better than Mrs. X’s individual grade.
- Forecast accuracy decreases as time horizon for forecasts increases
Ex. I can forecast this year’s class average better than next year’s class average
#10 Cyclical elements – cyclical influence comes from political elections, war, economic conditions or sociological pressures.
Autocorrelation – the value expected at any point is highly correlated with its own past values. When demand is random, it may vary widely from one week to another. where high auto-correlation exists, demand is not expected to chance very much from one week to the next.
Random Variation – caused by chance events. If we cannot identify the cause of the reminder portion of demand, it is assumed to be purely random chance.
#13 Introduction and growth require longer forecasts than maturity and decline
As product passes through life cycle, forecasts are useful in projecting
Staffing levels, Inventory levels and Factory capacity
Introduction – best period to increase market share. Research & Development engineering is critical.
Growth – practical to change price or quality image. Strengthen niche.
Maturity – Poor time to change image, price and quality. Competitive costs become critical. Defend market position.
Decline – Cost control critical.
#15 Step 1. Who needs the forecast? Decisions to be made affects the future of the organization.
Step 2. Short range, medium range or long range
Step 3. Qualitative Methods used when situation is vague and a little data exists. (New product or technology) it involves intuition and experience. Quantitative
method is used when situation is ‘stable’ and historical data exists. It involves mathematical techniques.
Step 4. collection of reliable and accurate data, relevant, consistent and timely.
#19 Forecasting lays a ground for reducing the risk in all decision making because many of the decisions need to be made under uncertainty.
In business applications, forecasting serves as a starting point of major decisions in finance, marketing, productions, and purchasing.
1 - In other words, most of our techniques are based on historical data.
2 - For example, the company should always maintain a safety stock in anticipation of a sudden depletion of inventory.
#20 1 - Generally speaking, a long-term forecast tends to be more inaccurate than a short-term forecast because of the greater uncertainty.
2 - For example, industry forecasting is more accurate than individual firm forecasting
#22 Qualitative forecasting techniques are subjective, based on the opinion and judgment of consumers, experts; they are appropriate when past data are not available. They are usually applied to intermediate- or long-range decisions.
#24 Usually this method is used in conjunction with some quantitative method, such as trend extrapolation. The management team modifies the resulting forecast, based on their expectations.
4th advantage - It includes at least potentially all the collective knowledge and experience of the involved managers
#25 1st - In one period the marketing manager might have just returned from a trade show or from a sales meeting and have better information than usual
this, however, is that of group-think
With high cohesiveness, the group becomes increasingly conforming through group pressure that helps stifle dissension and critical thought. Strong leadership fosters group pressure for unanimous opinion. Insulation of the group tends to separate the group from outside opinions, if given.
#26 The forecast source are salespeople who have continual contacts with customers.
They believe that the salespeople who are closest to the ultimate customers may have significant insights regarding the state of the future market.
Forecasts based on sales force polling may be averaged to develop a future forecast. Or they may be used to modify other quantitative and/or qualitative forecasts that have been generated internally in the company.
#27 1st - In addition, there is a greater tendency for biases to occur.