Downloaded 392 times

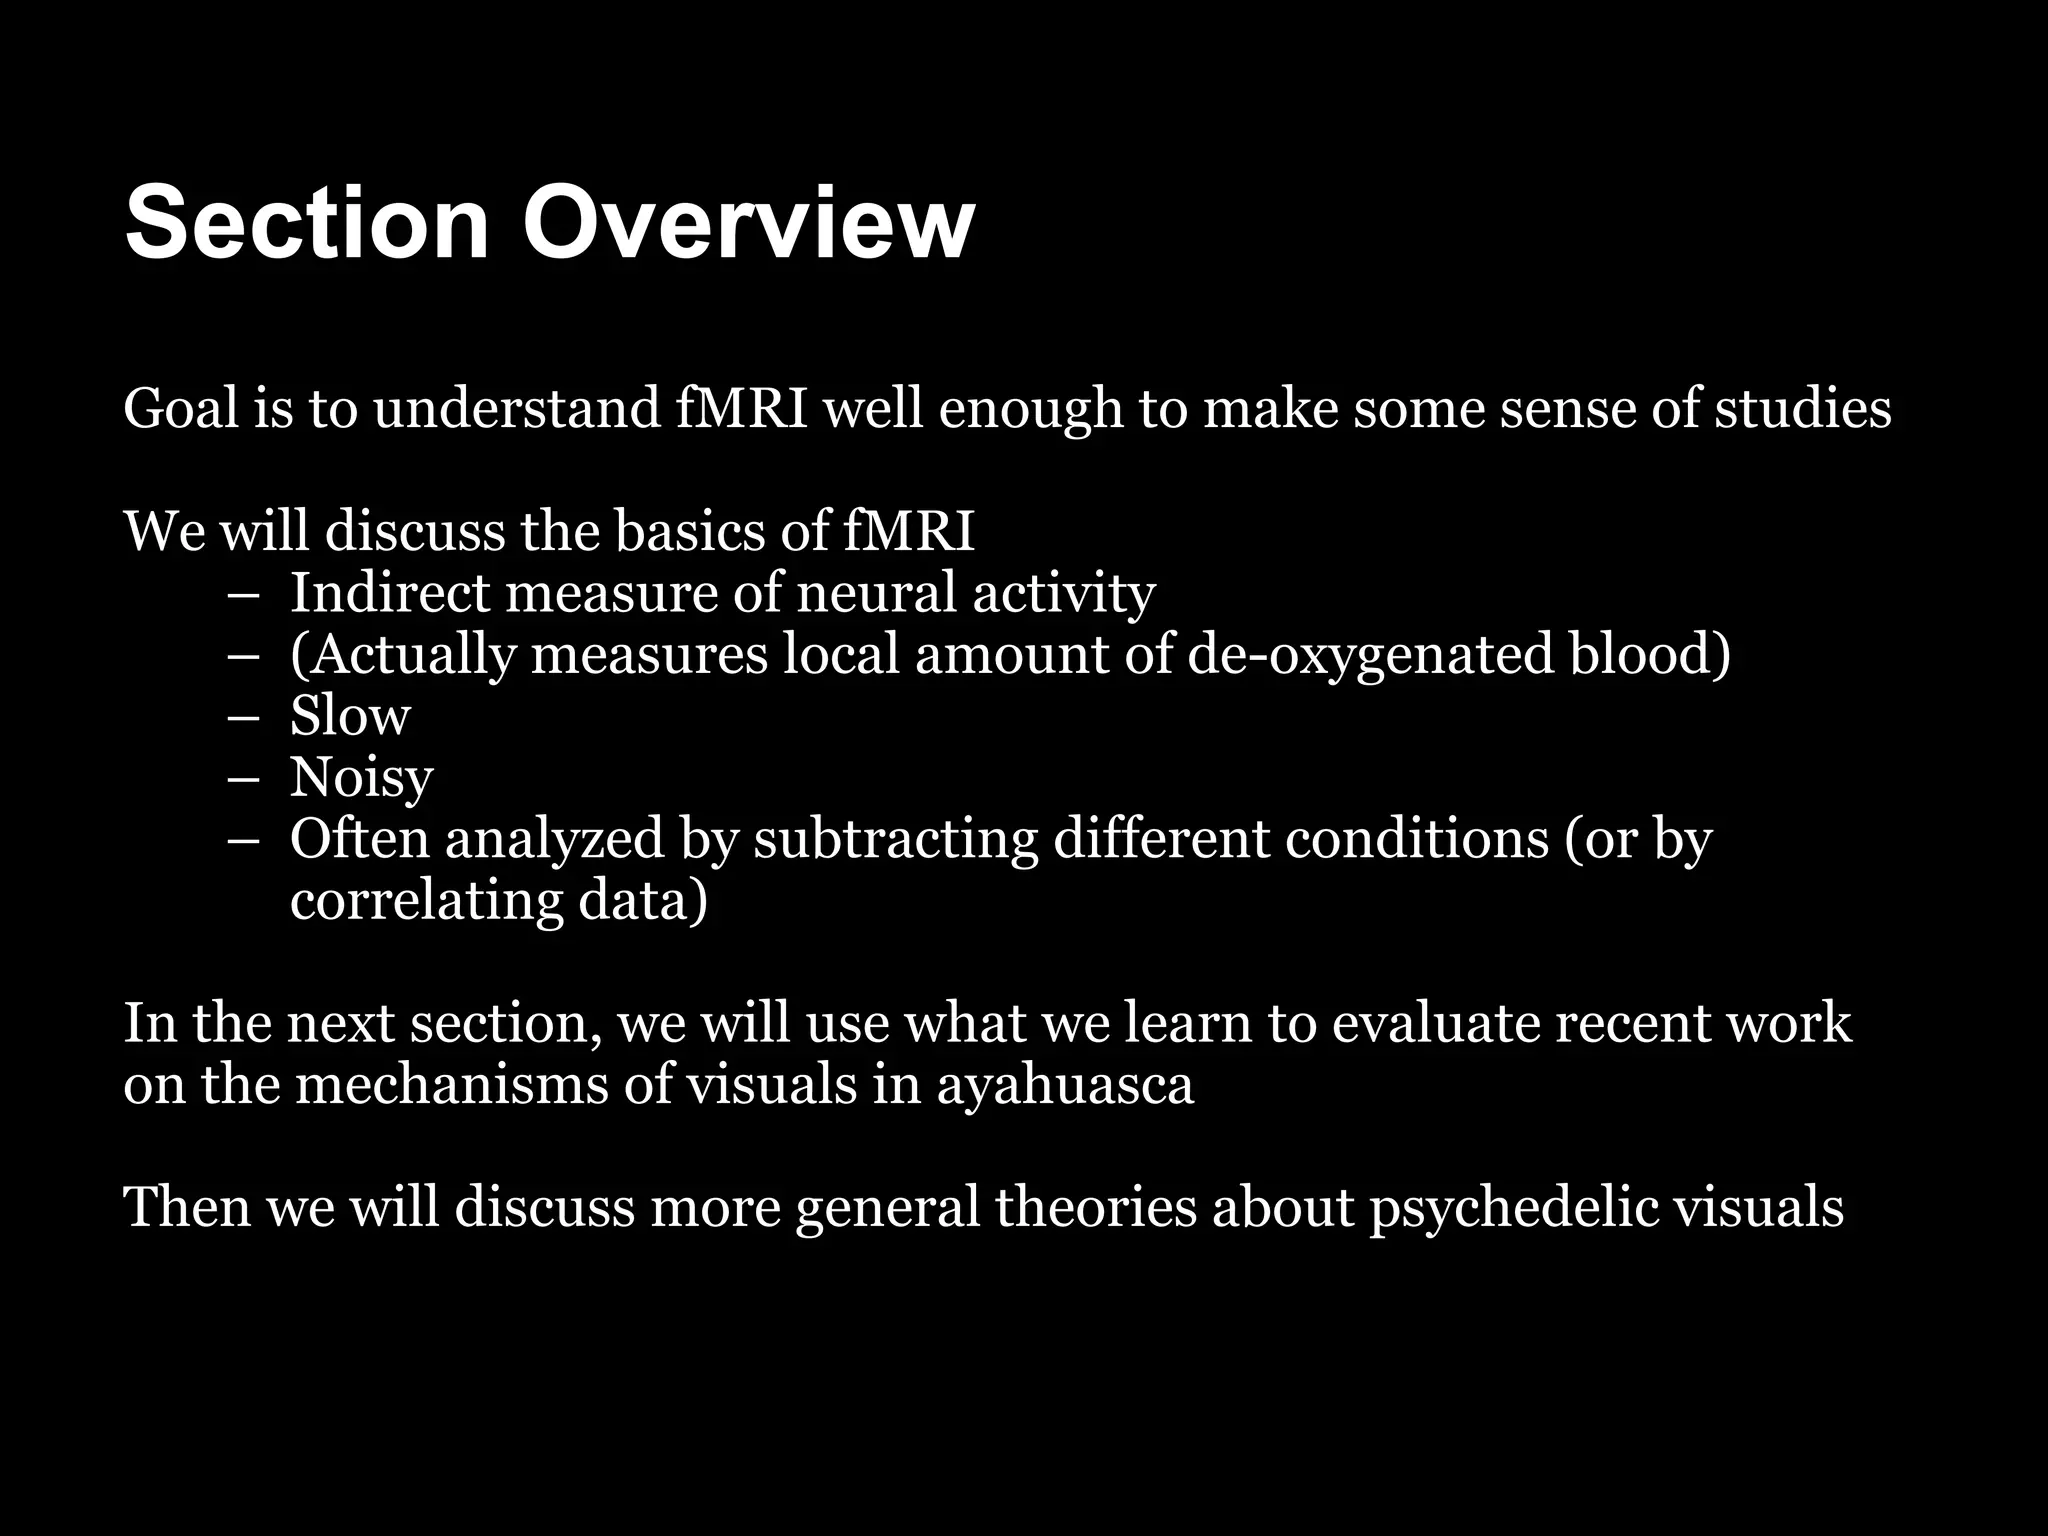


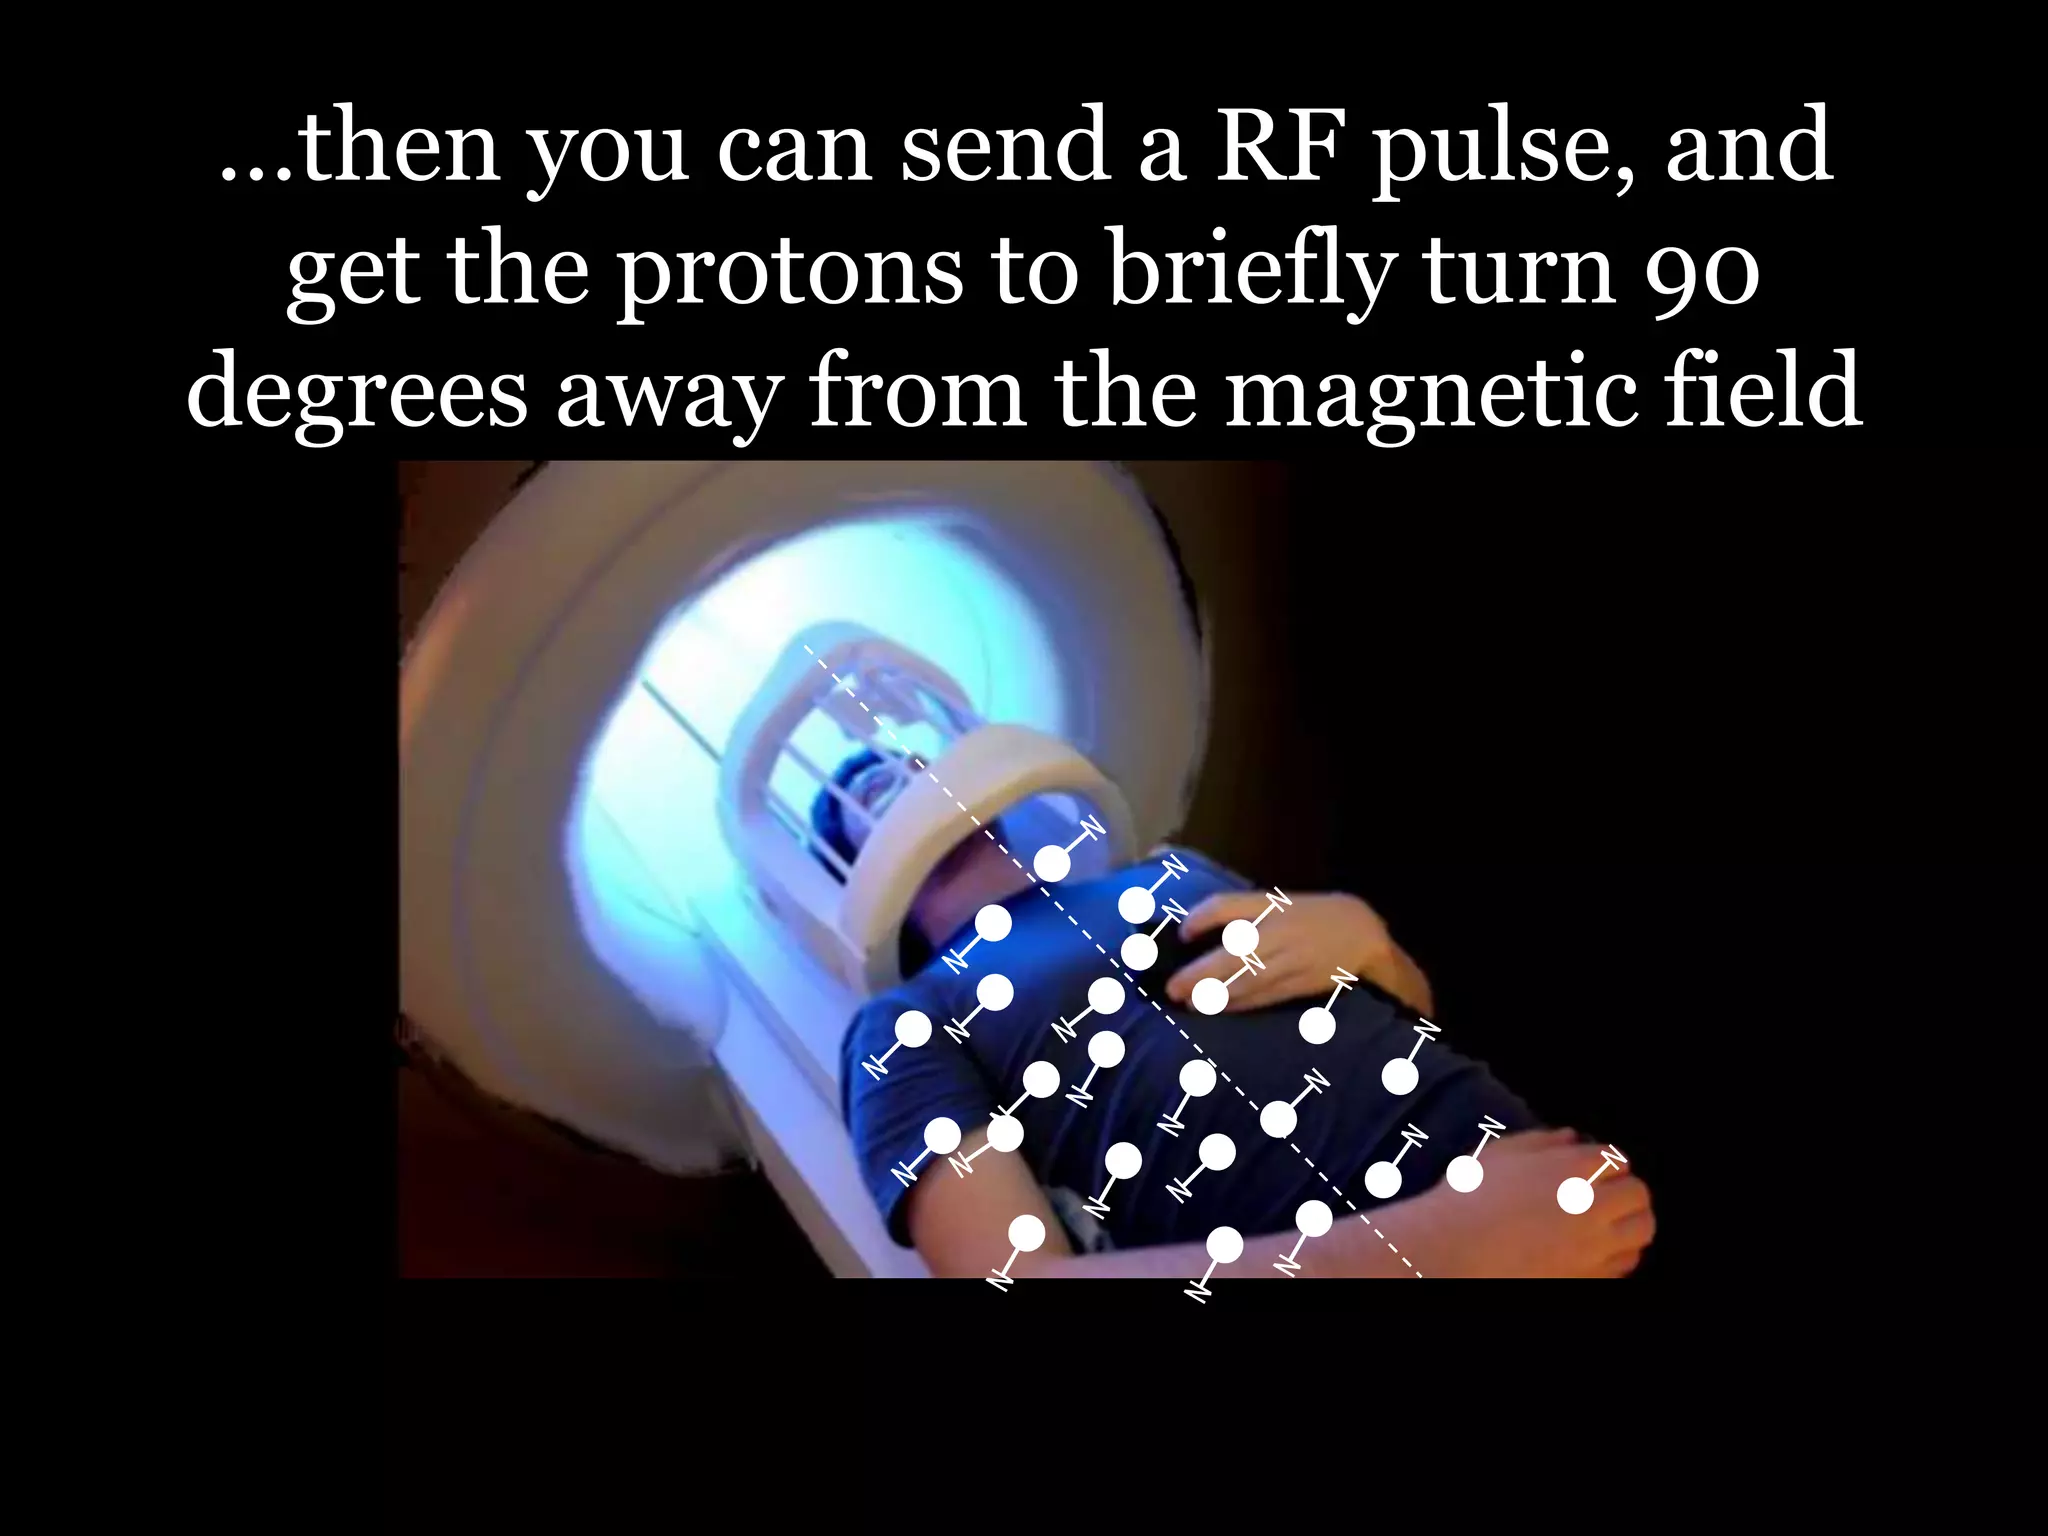

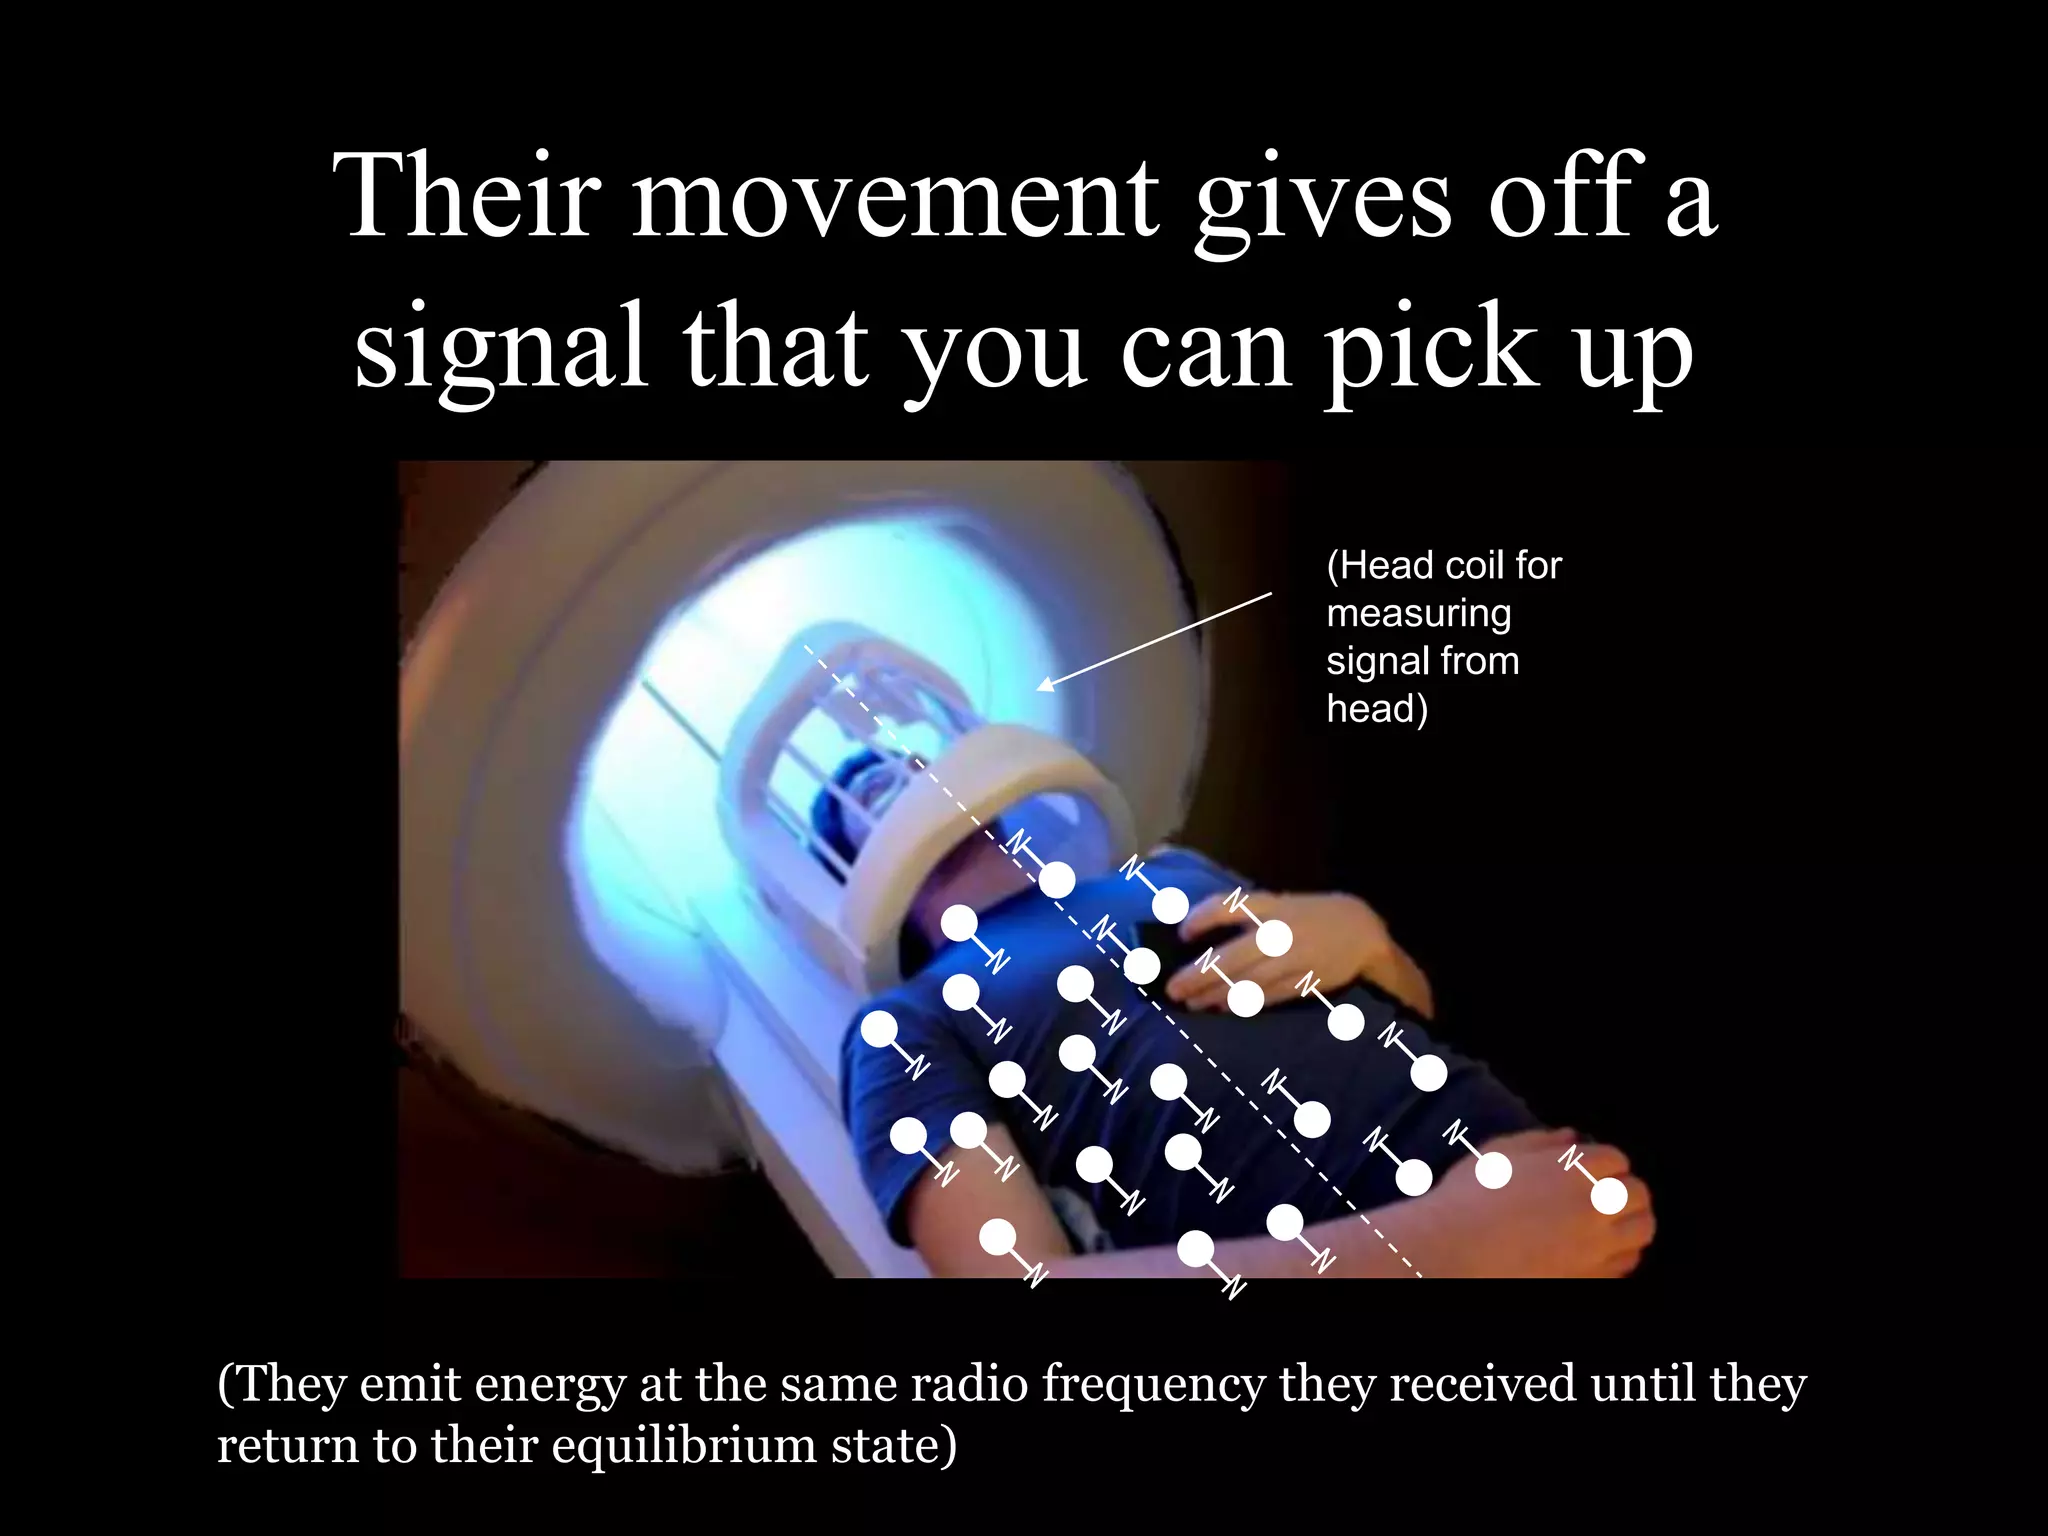


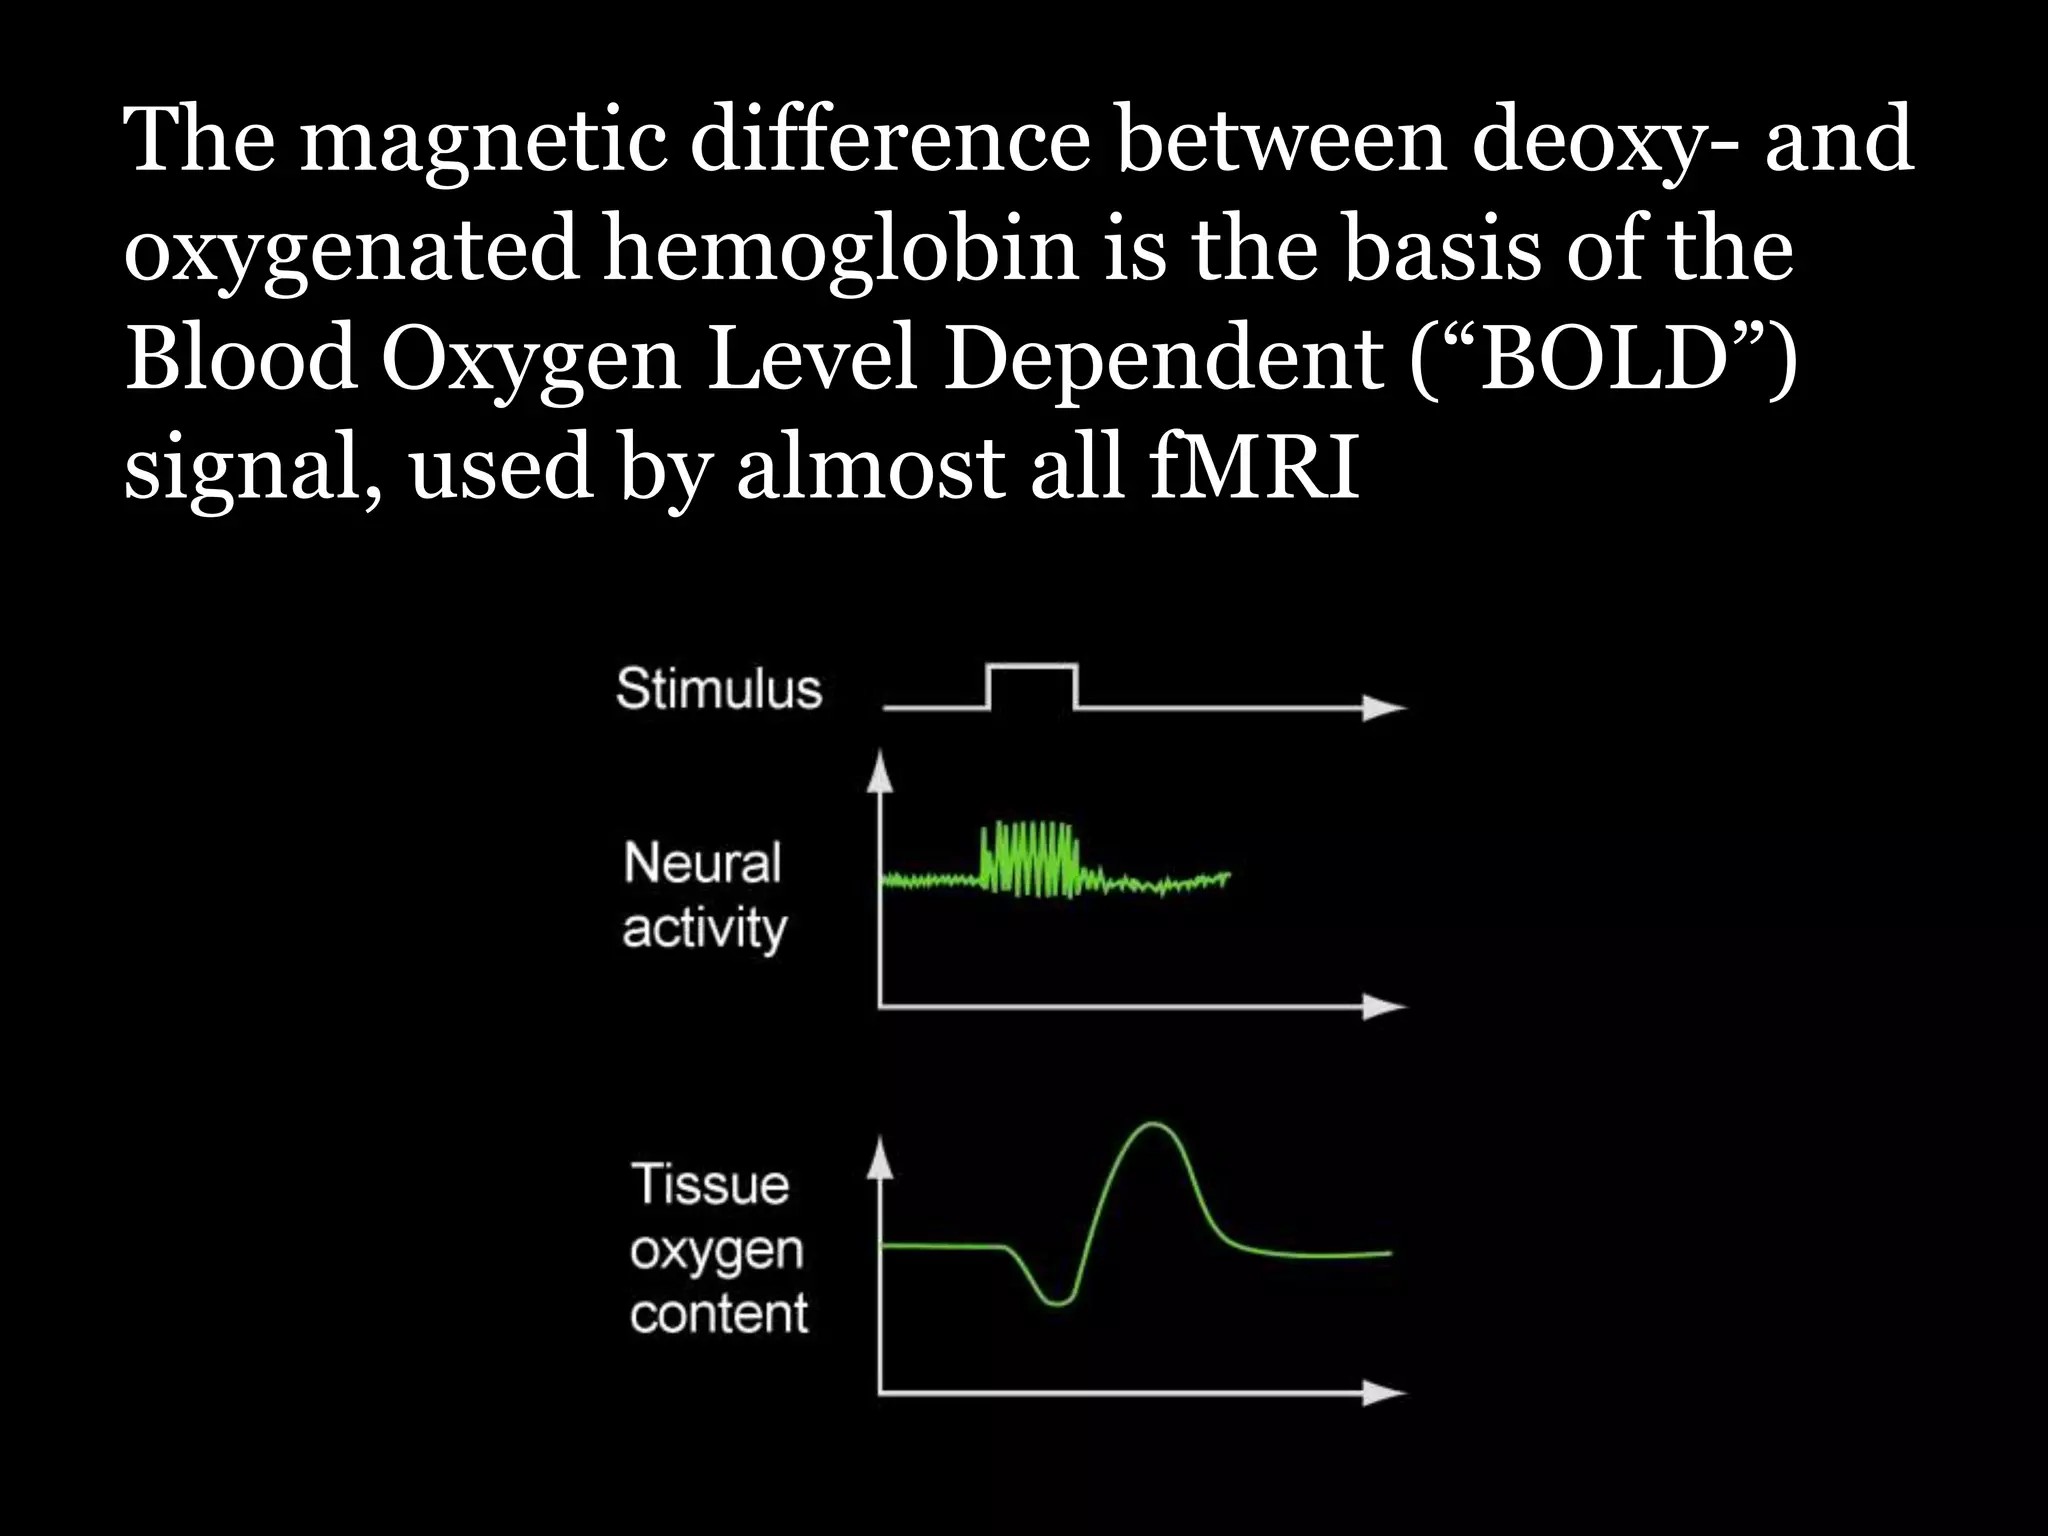
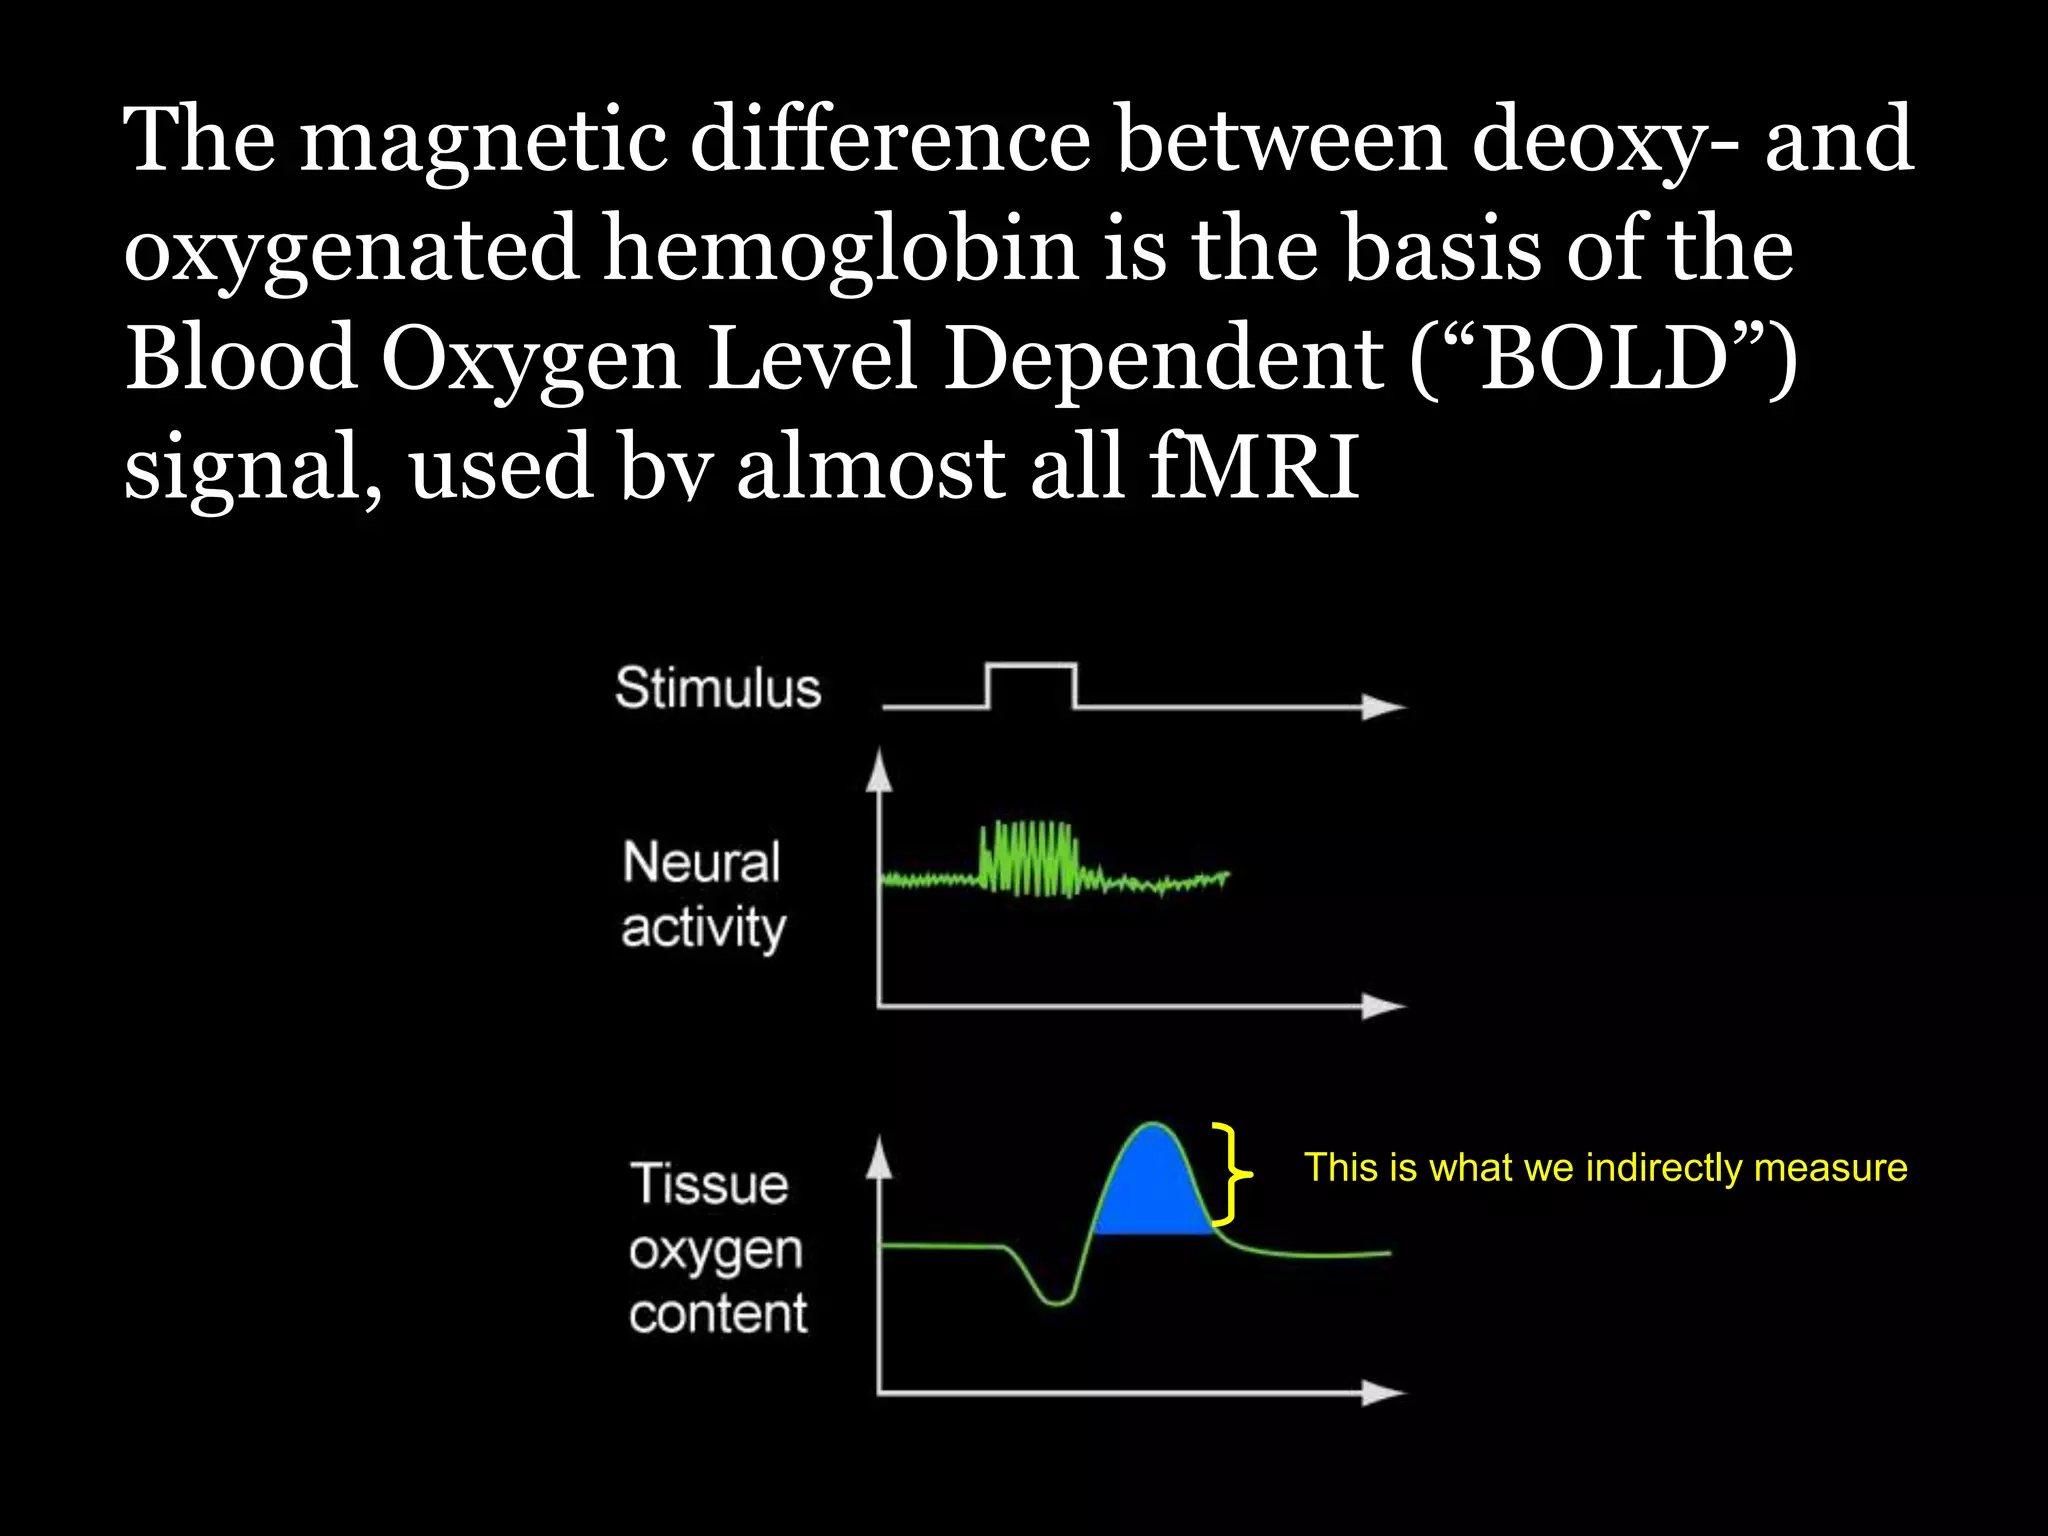
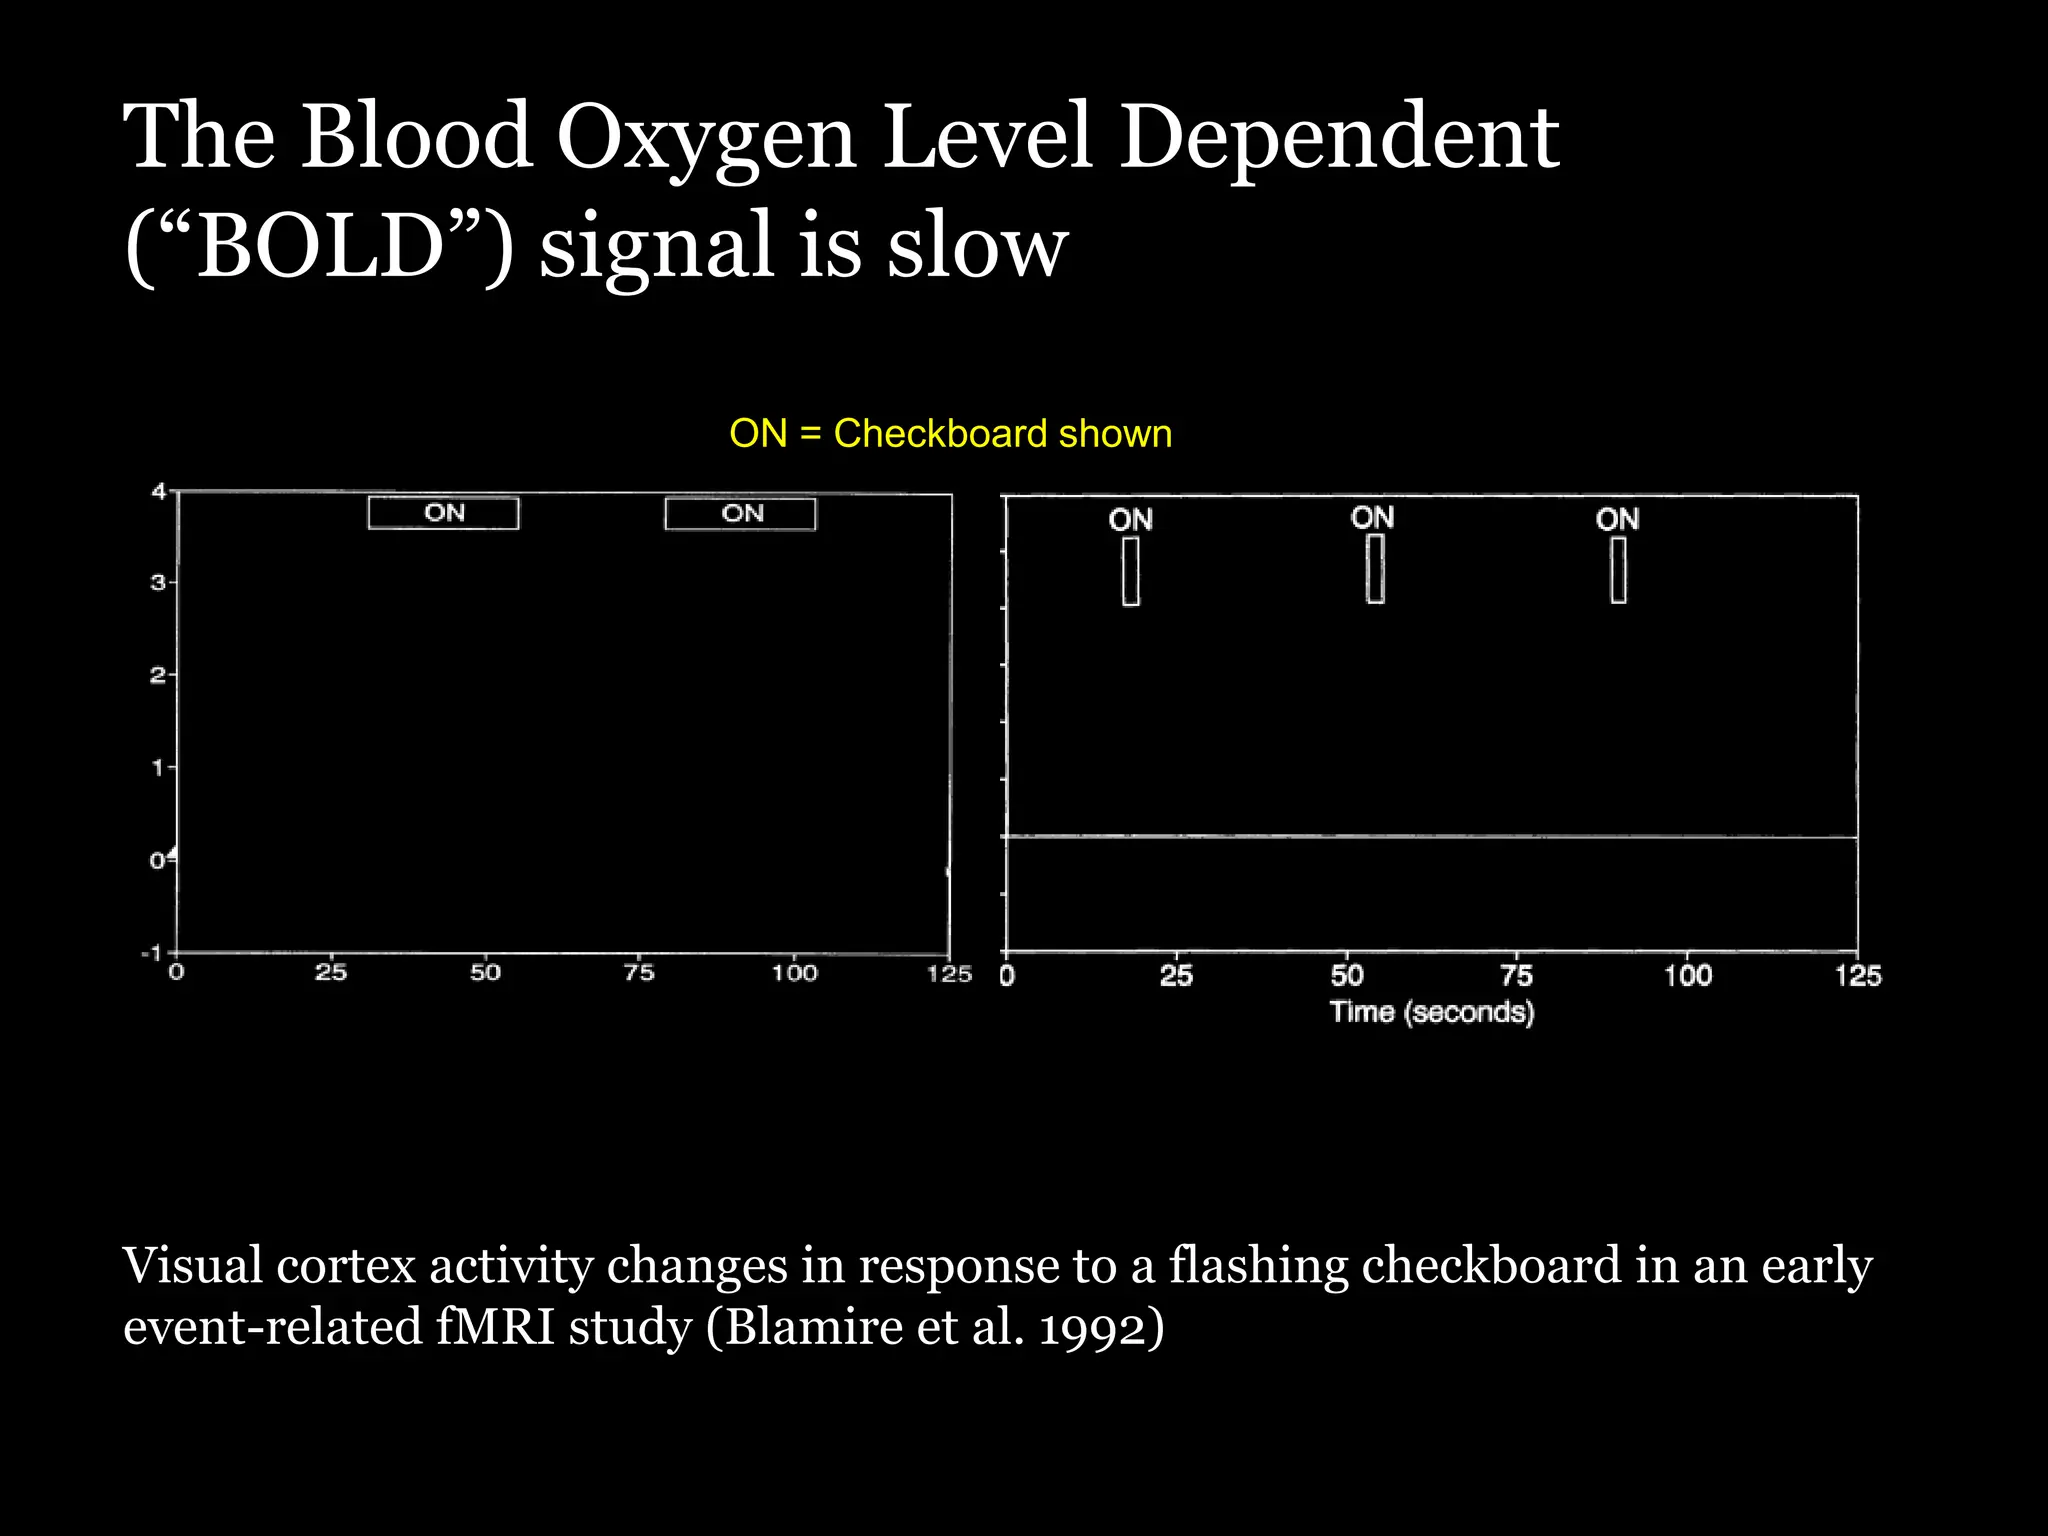
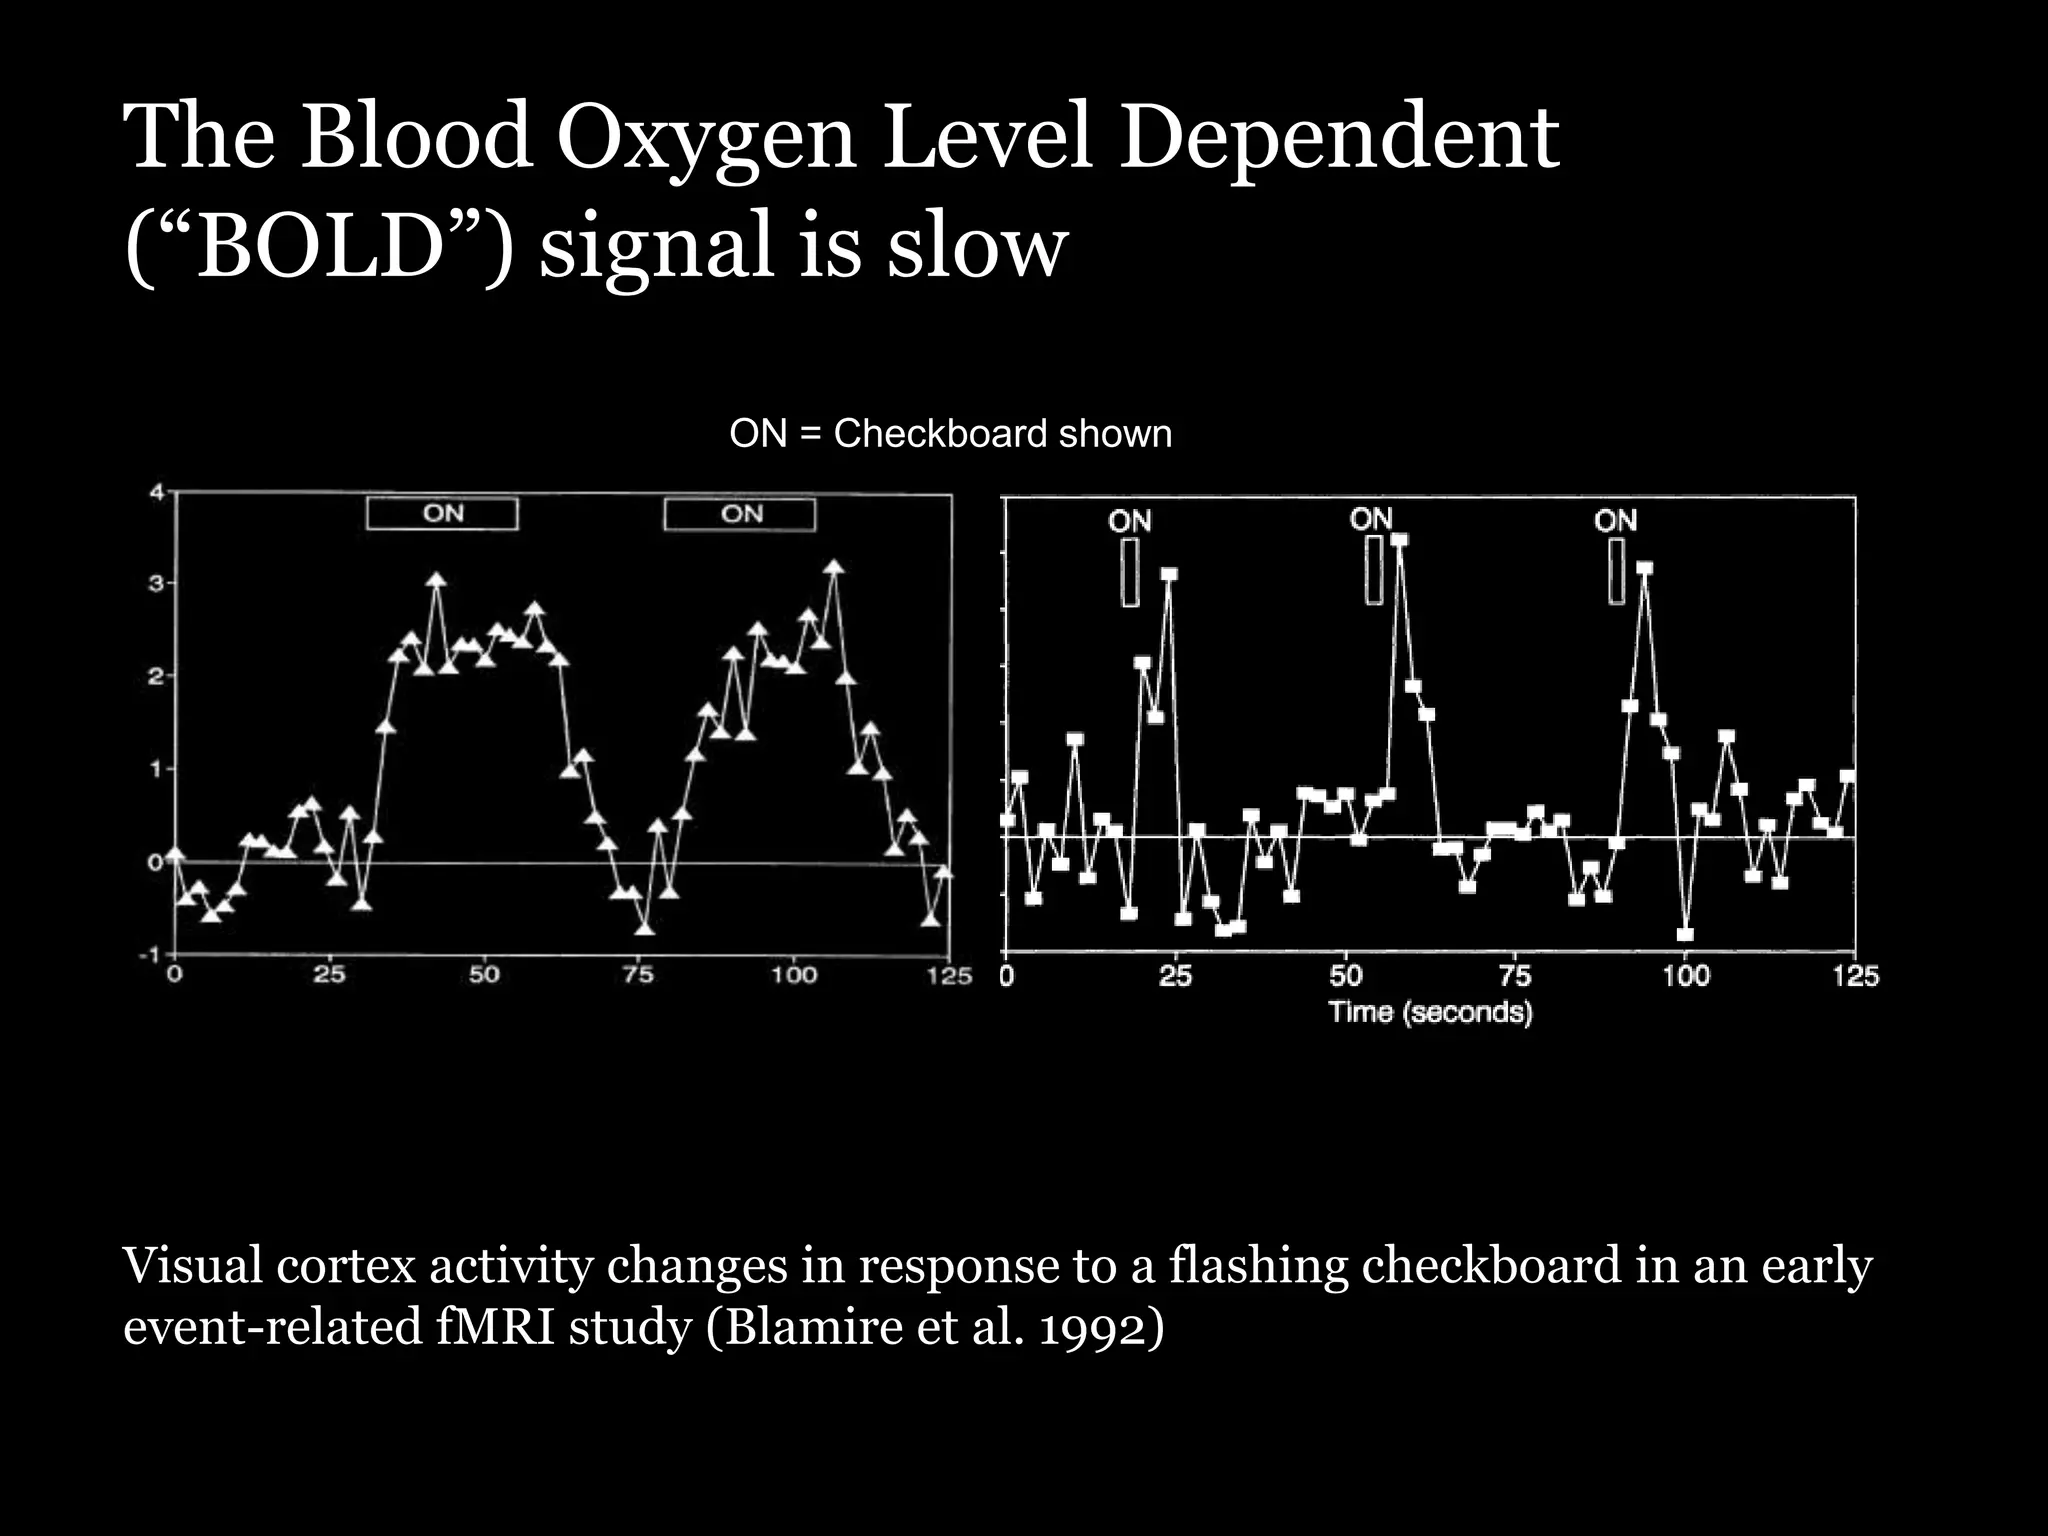
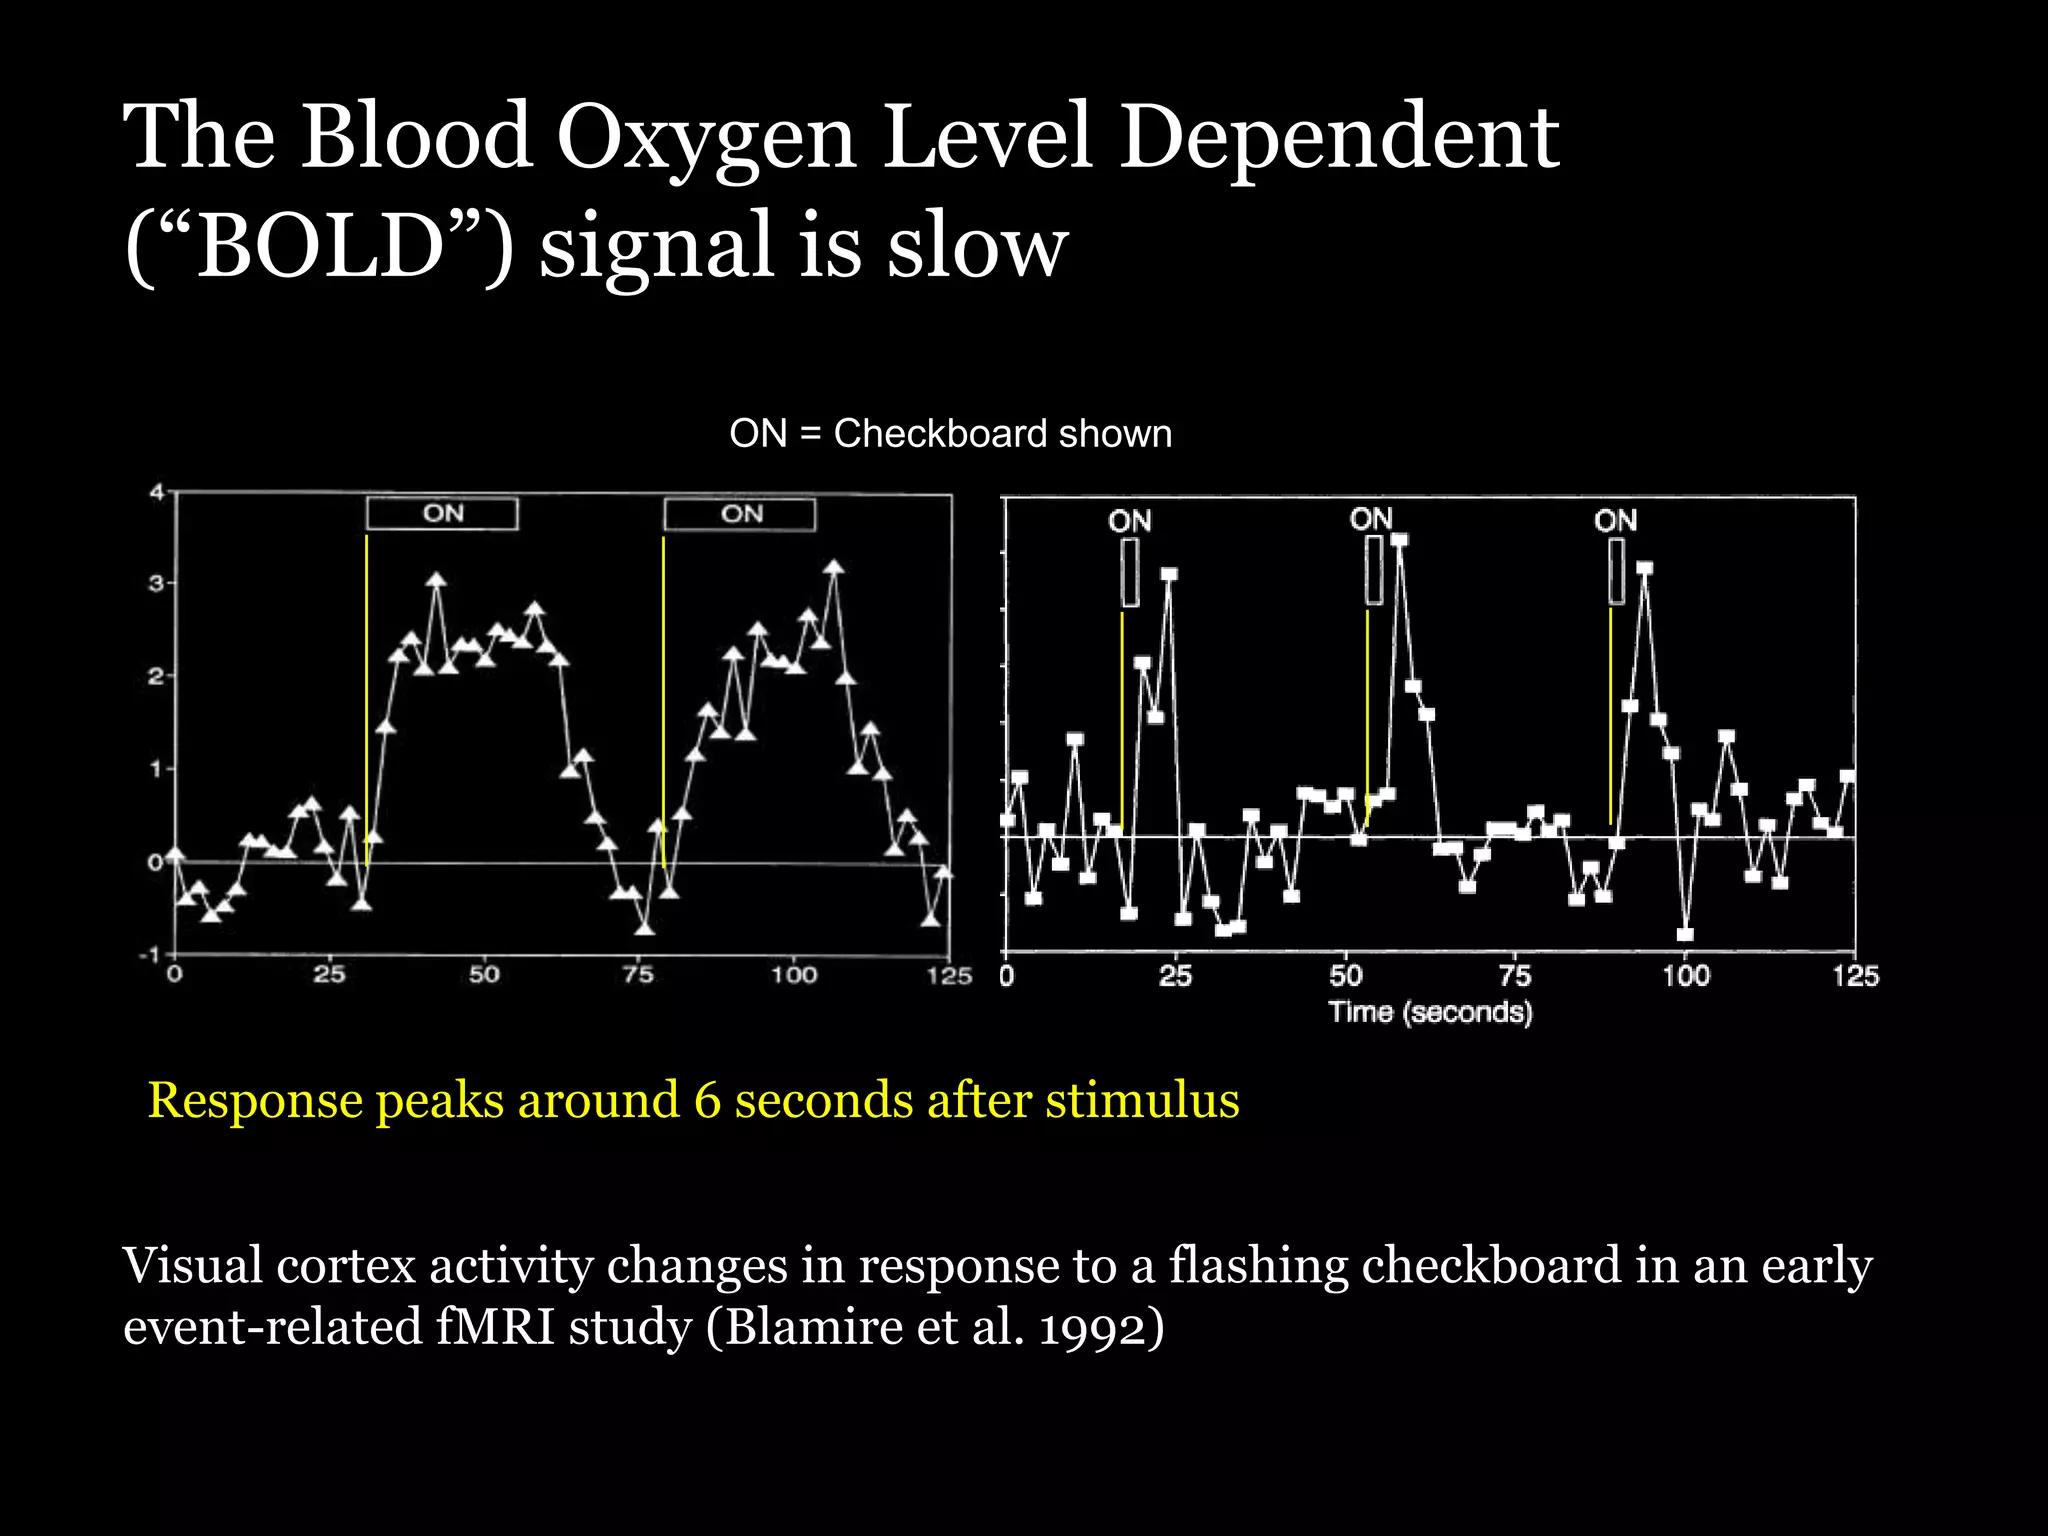
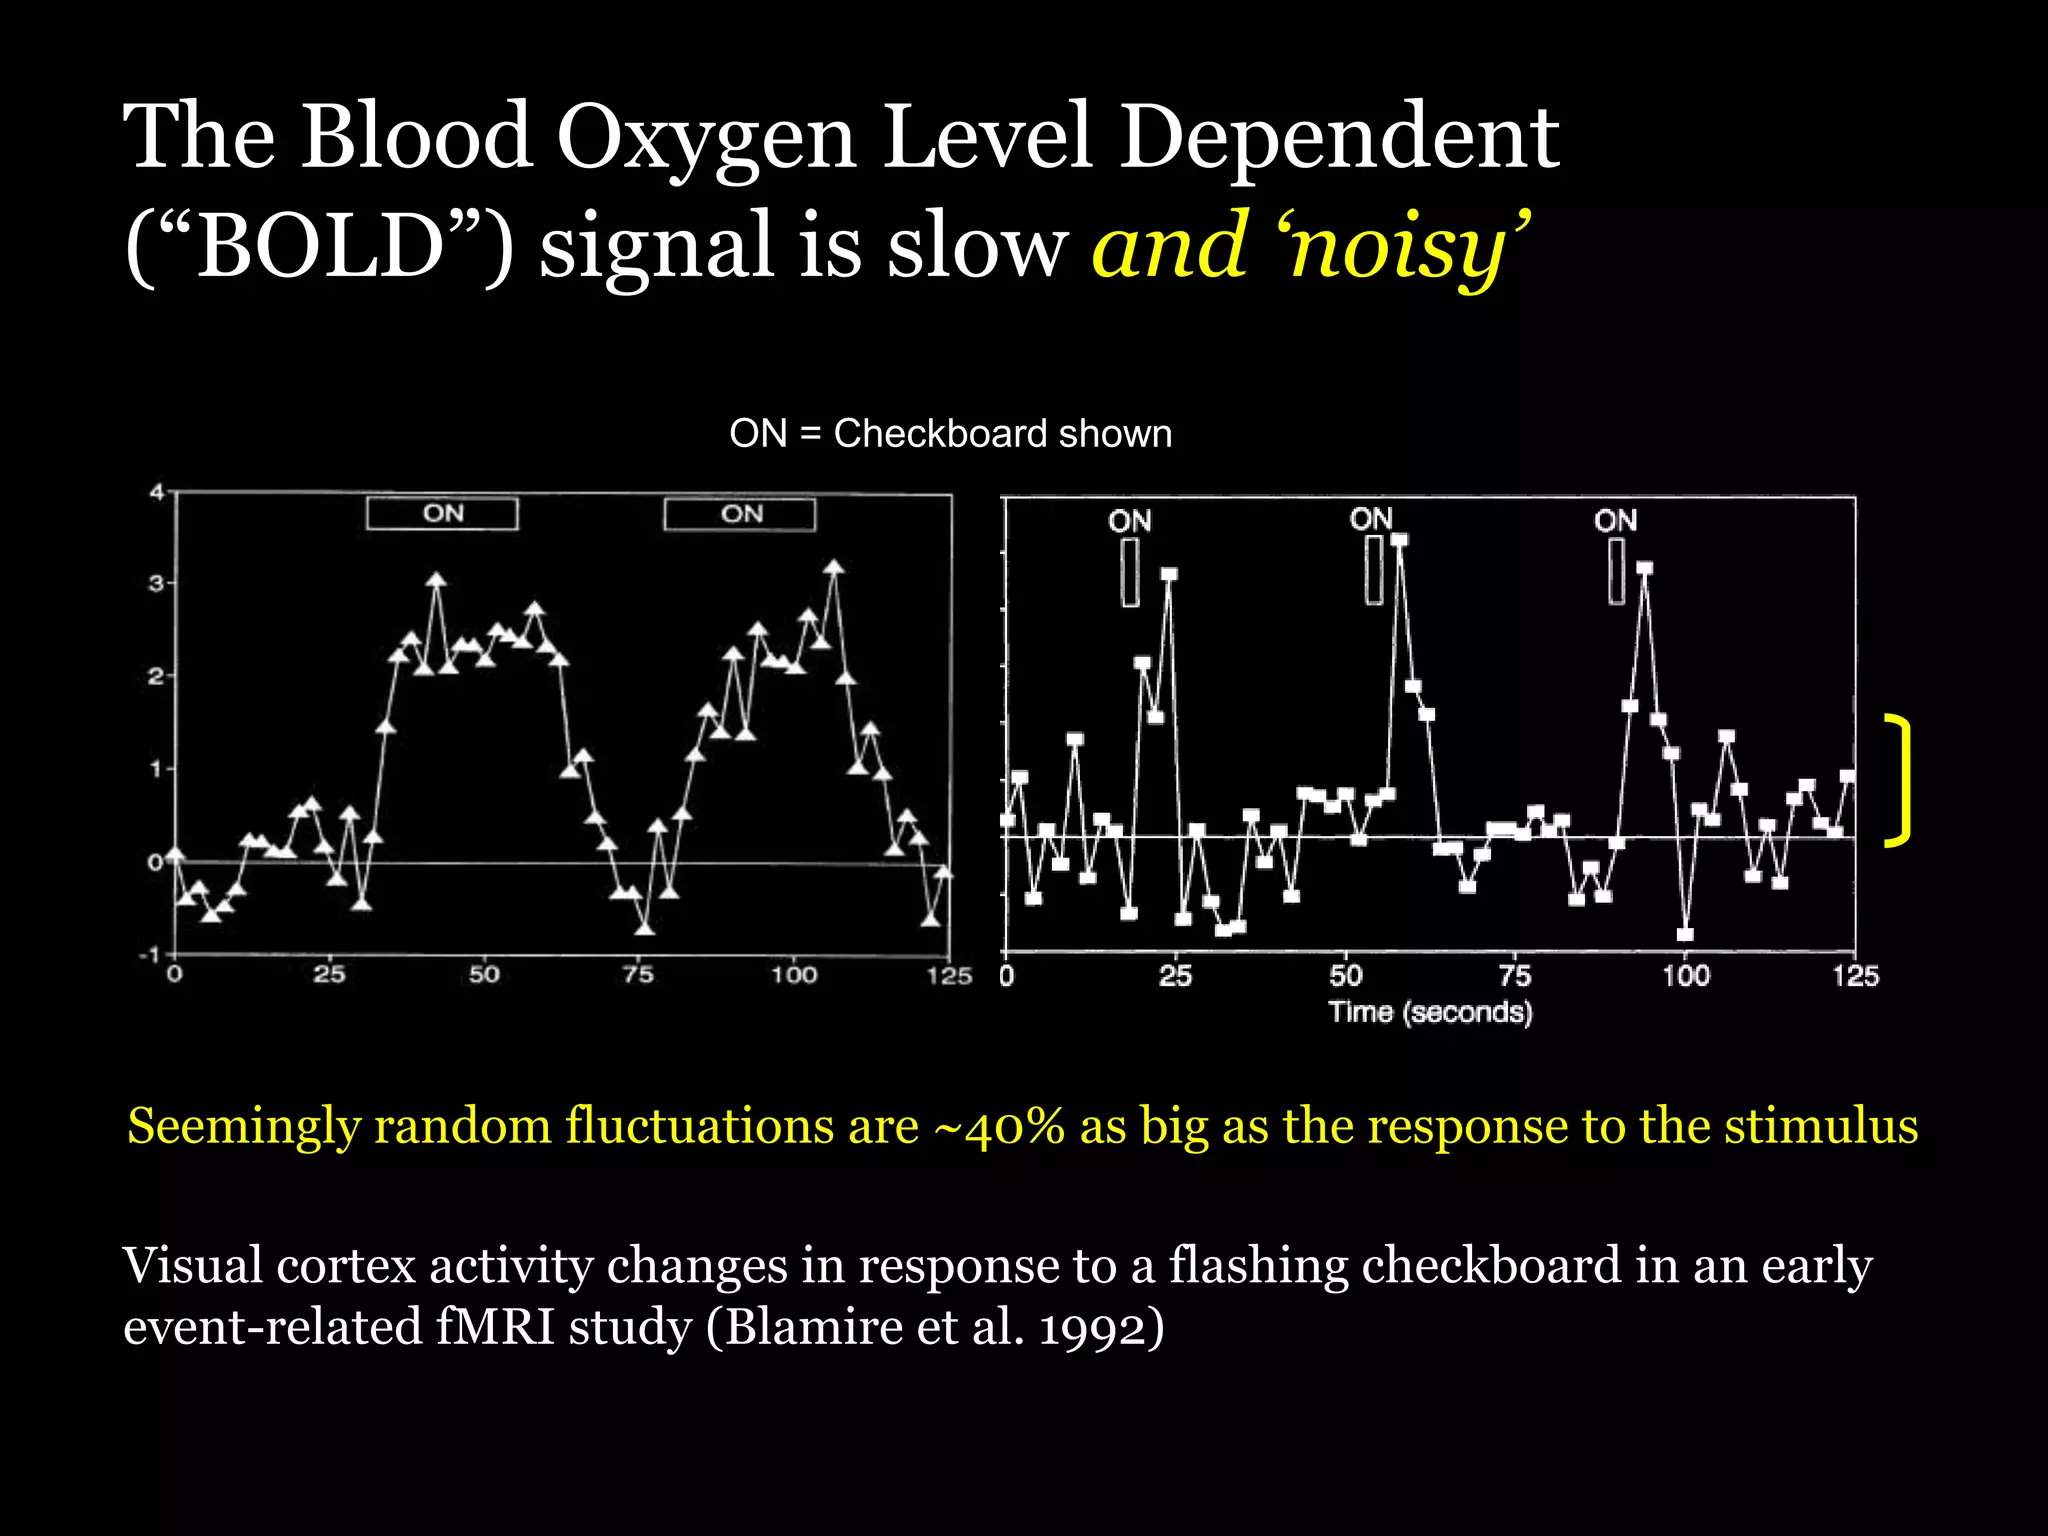
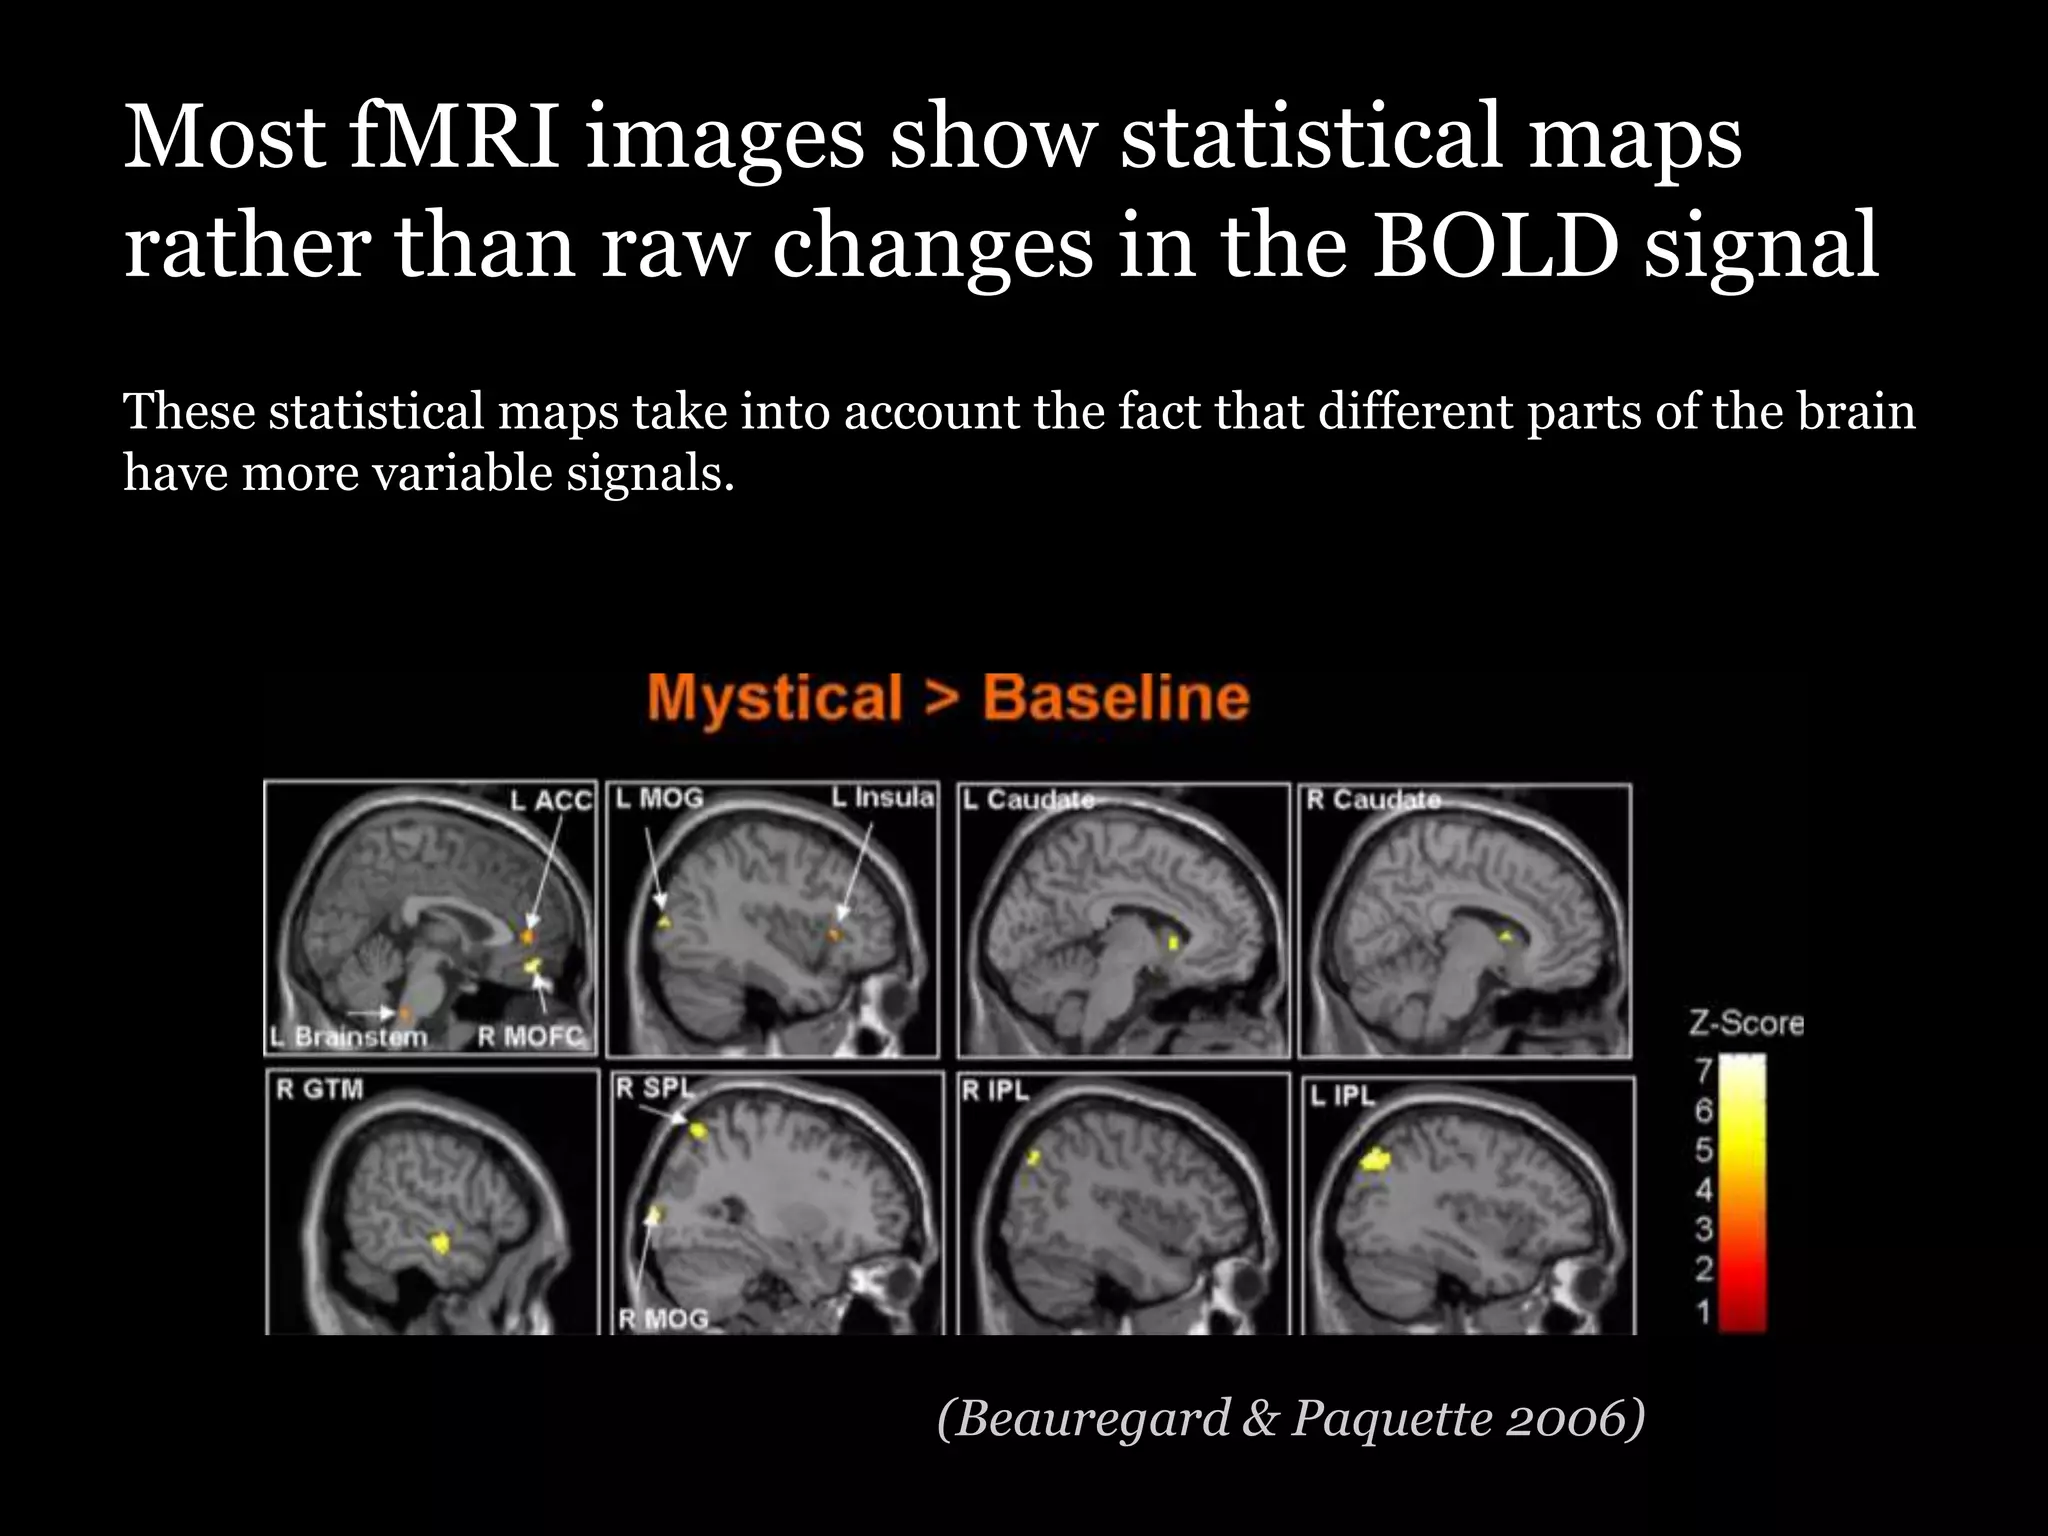
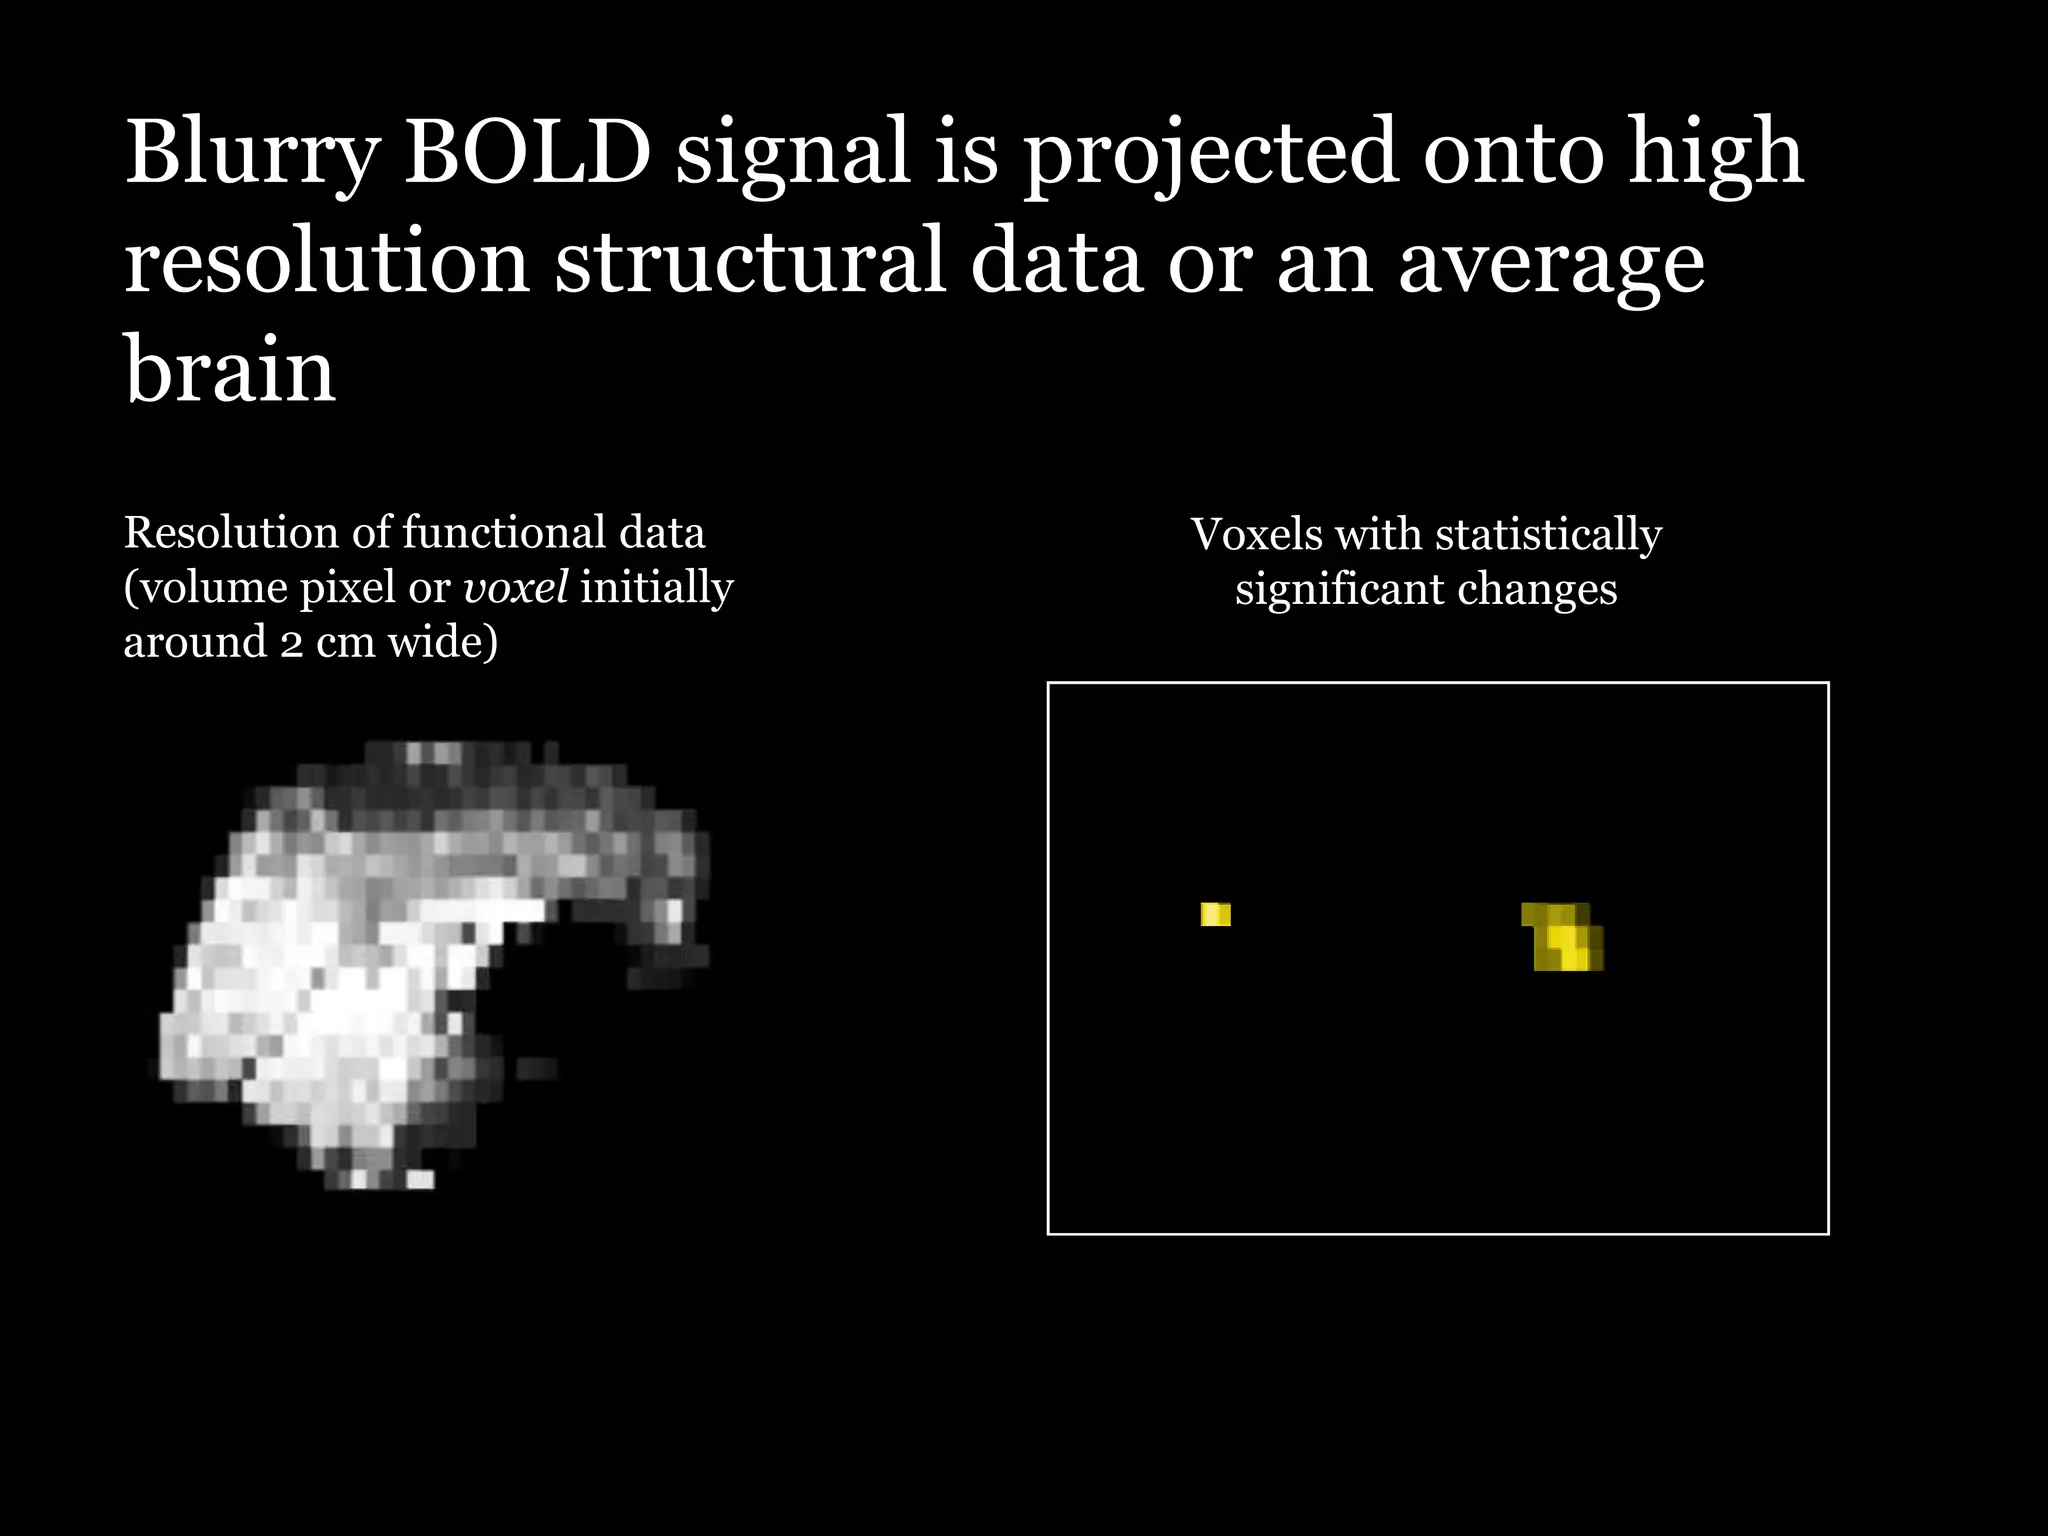
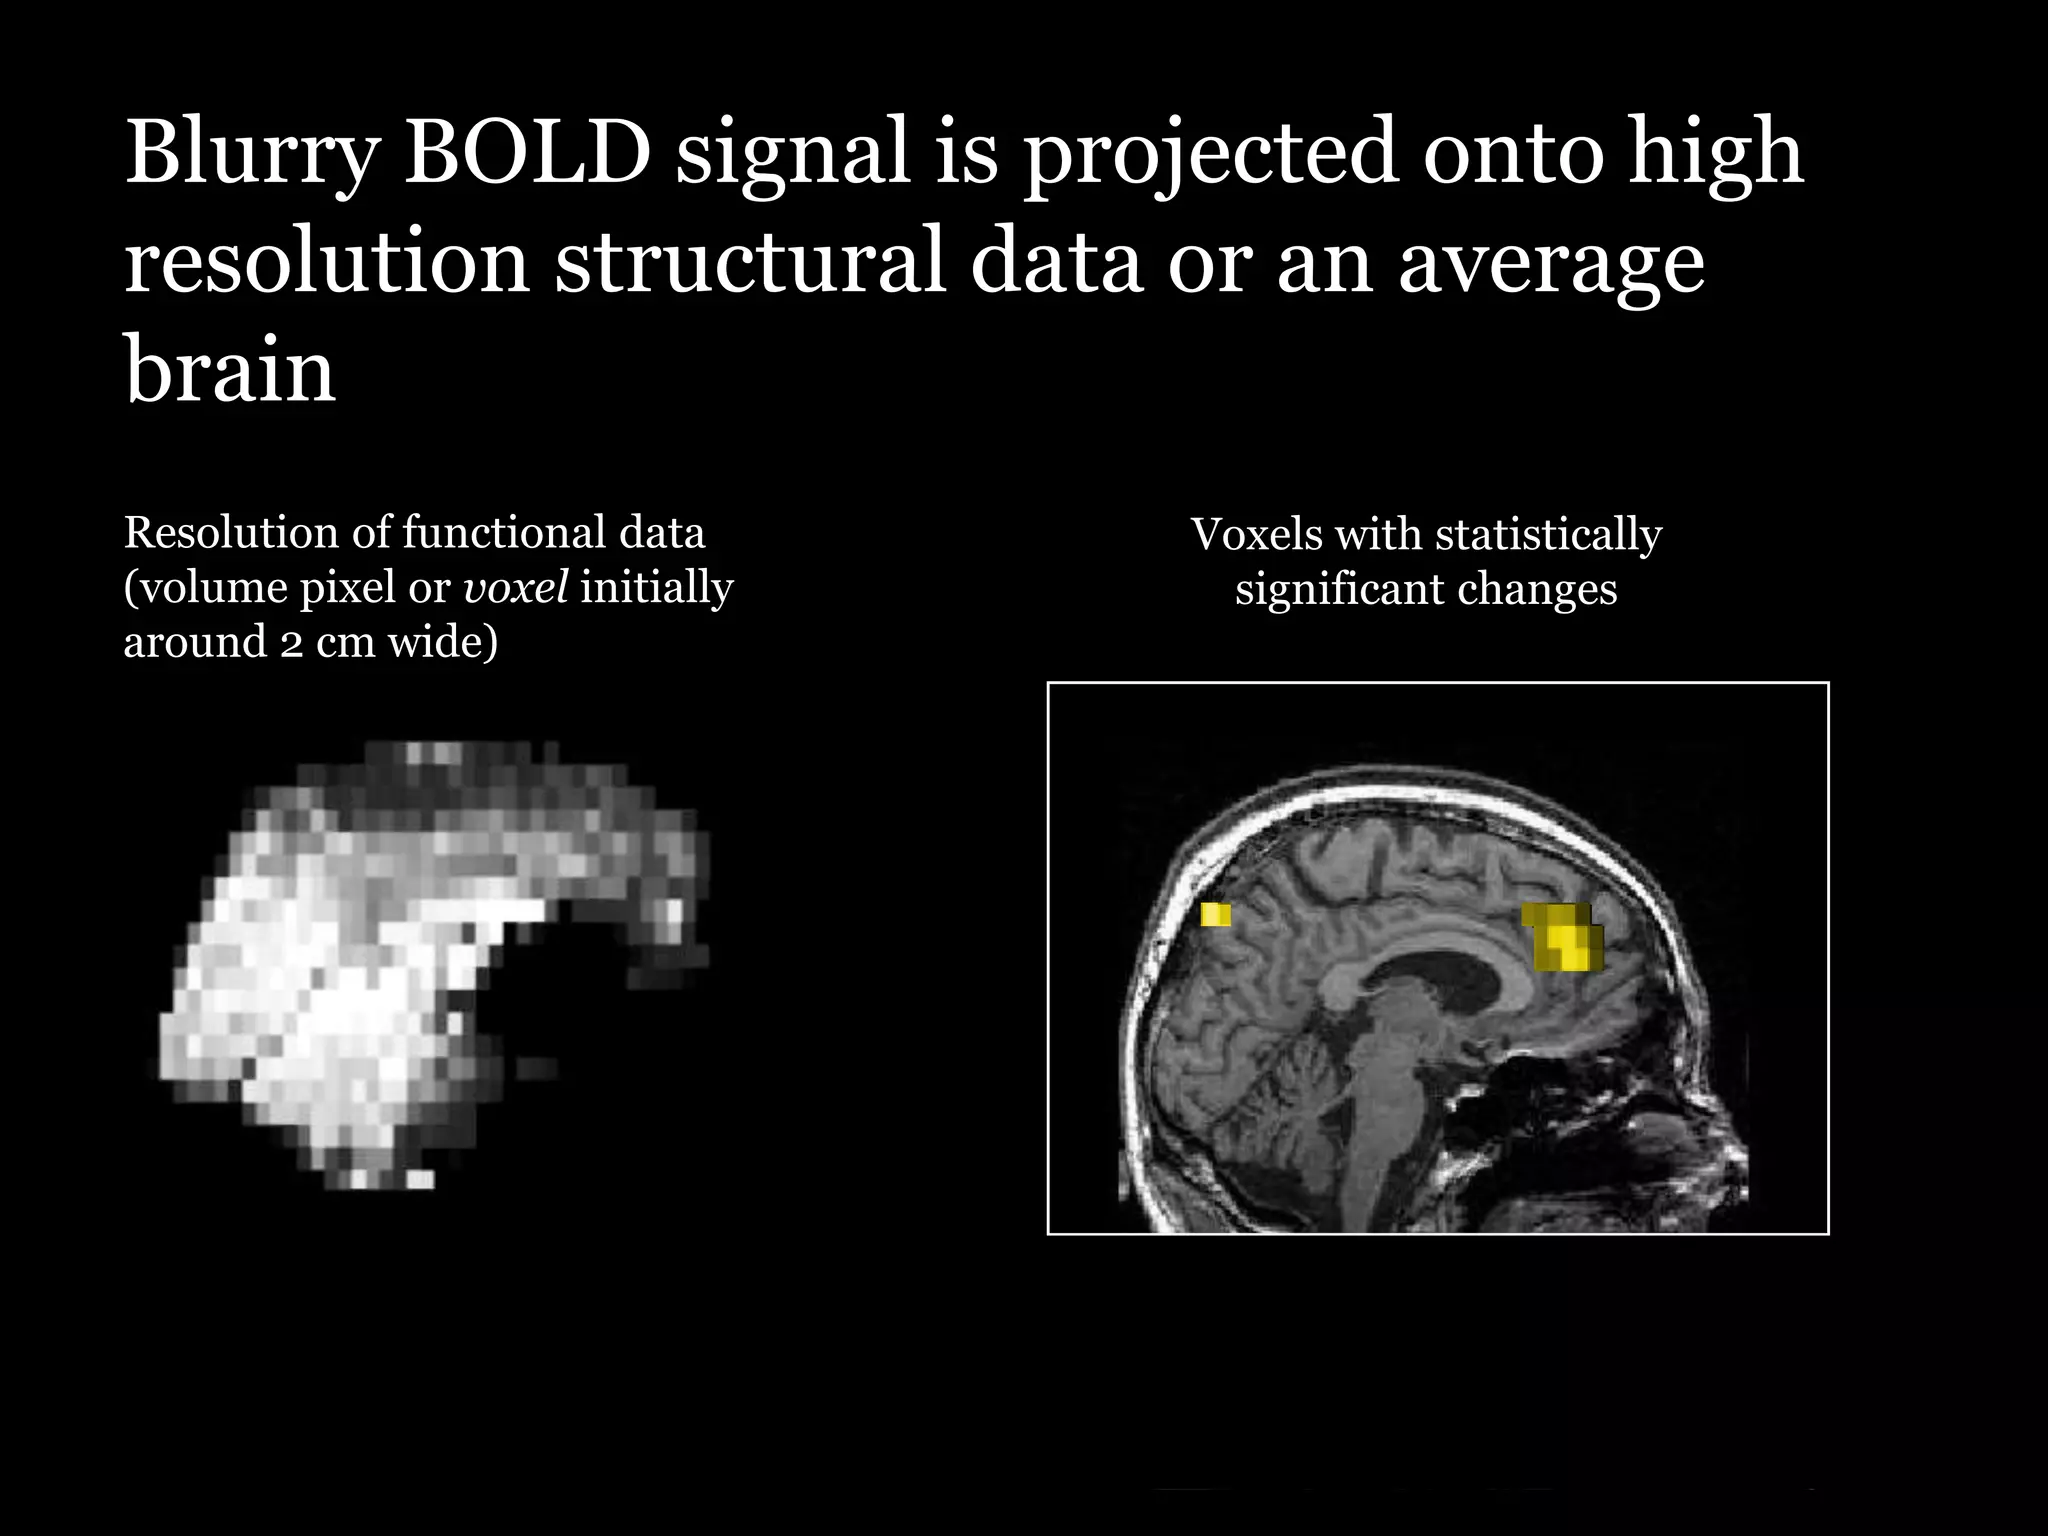
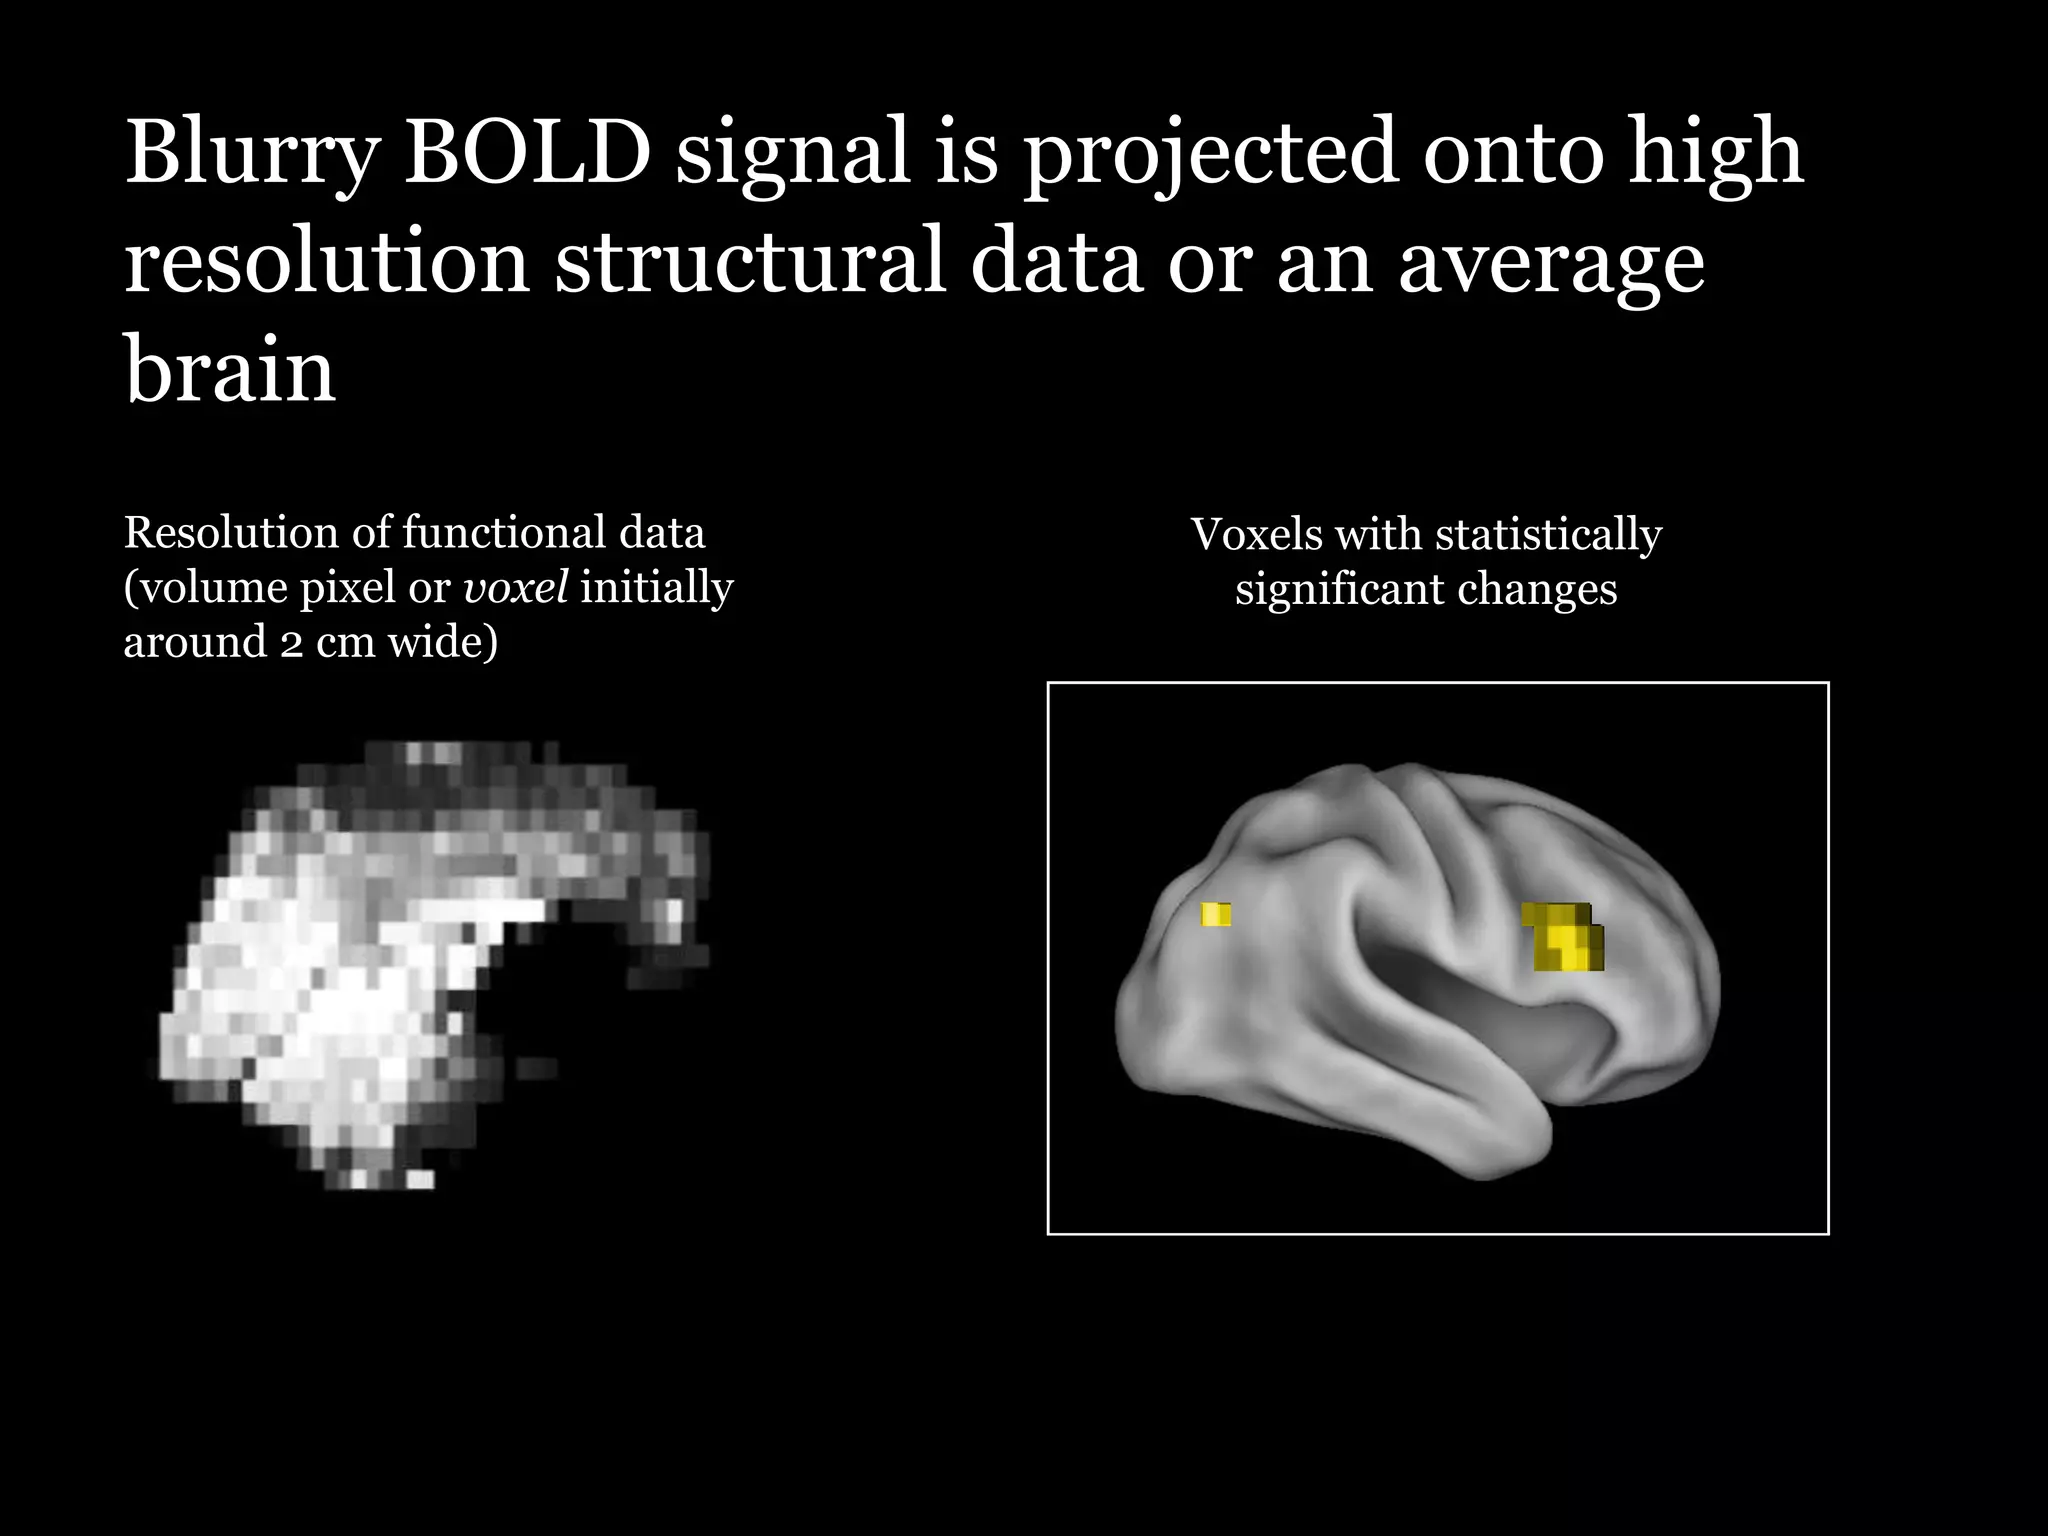
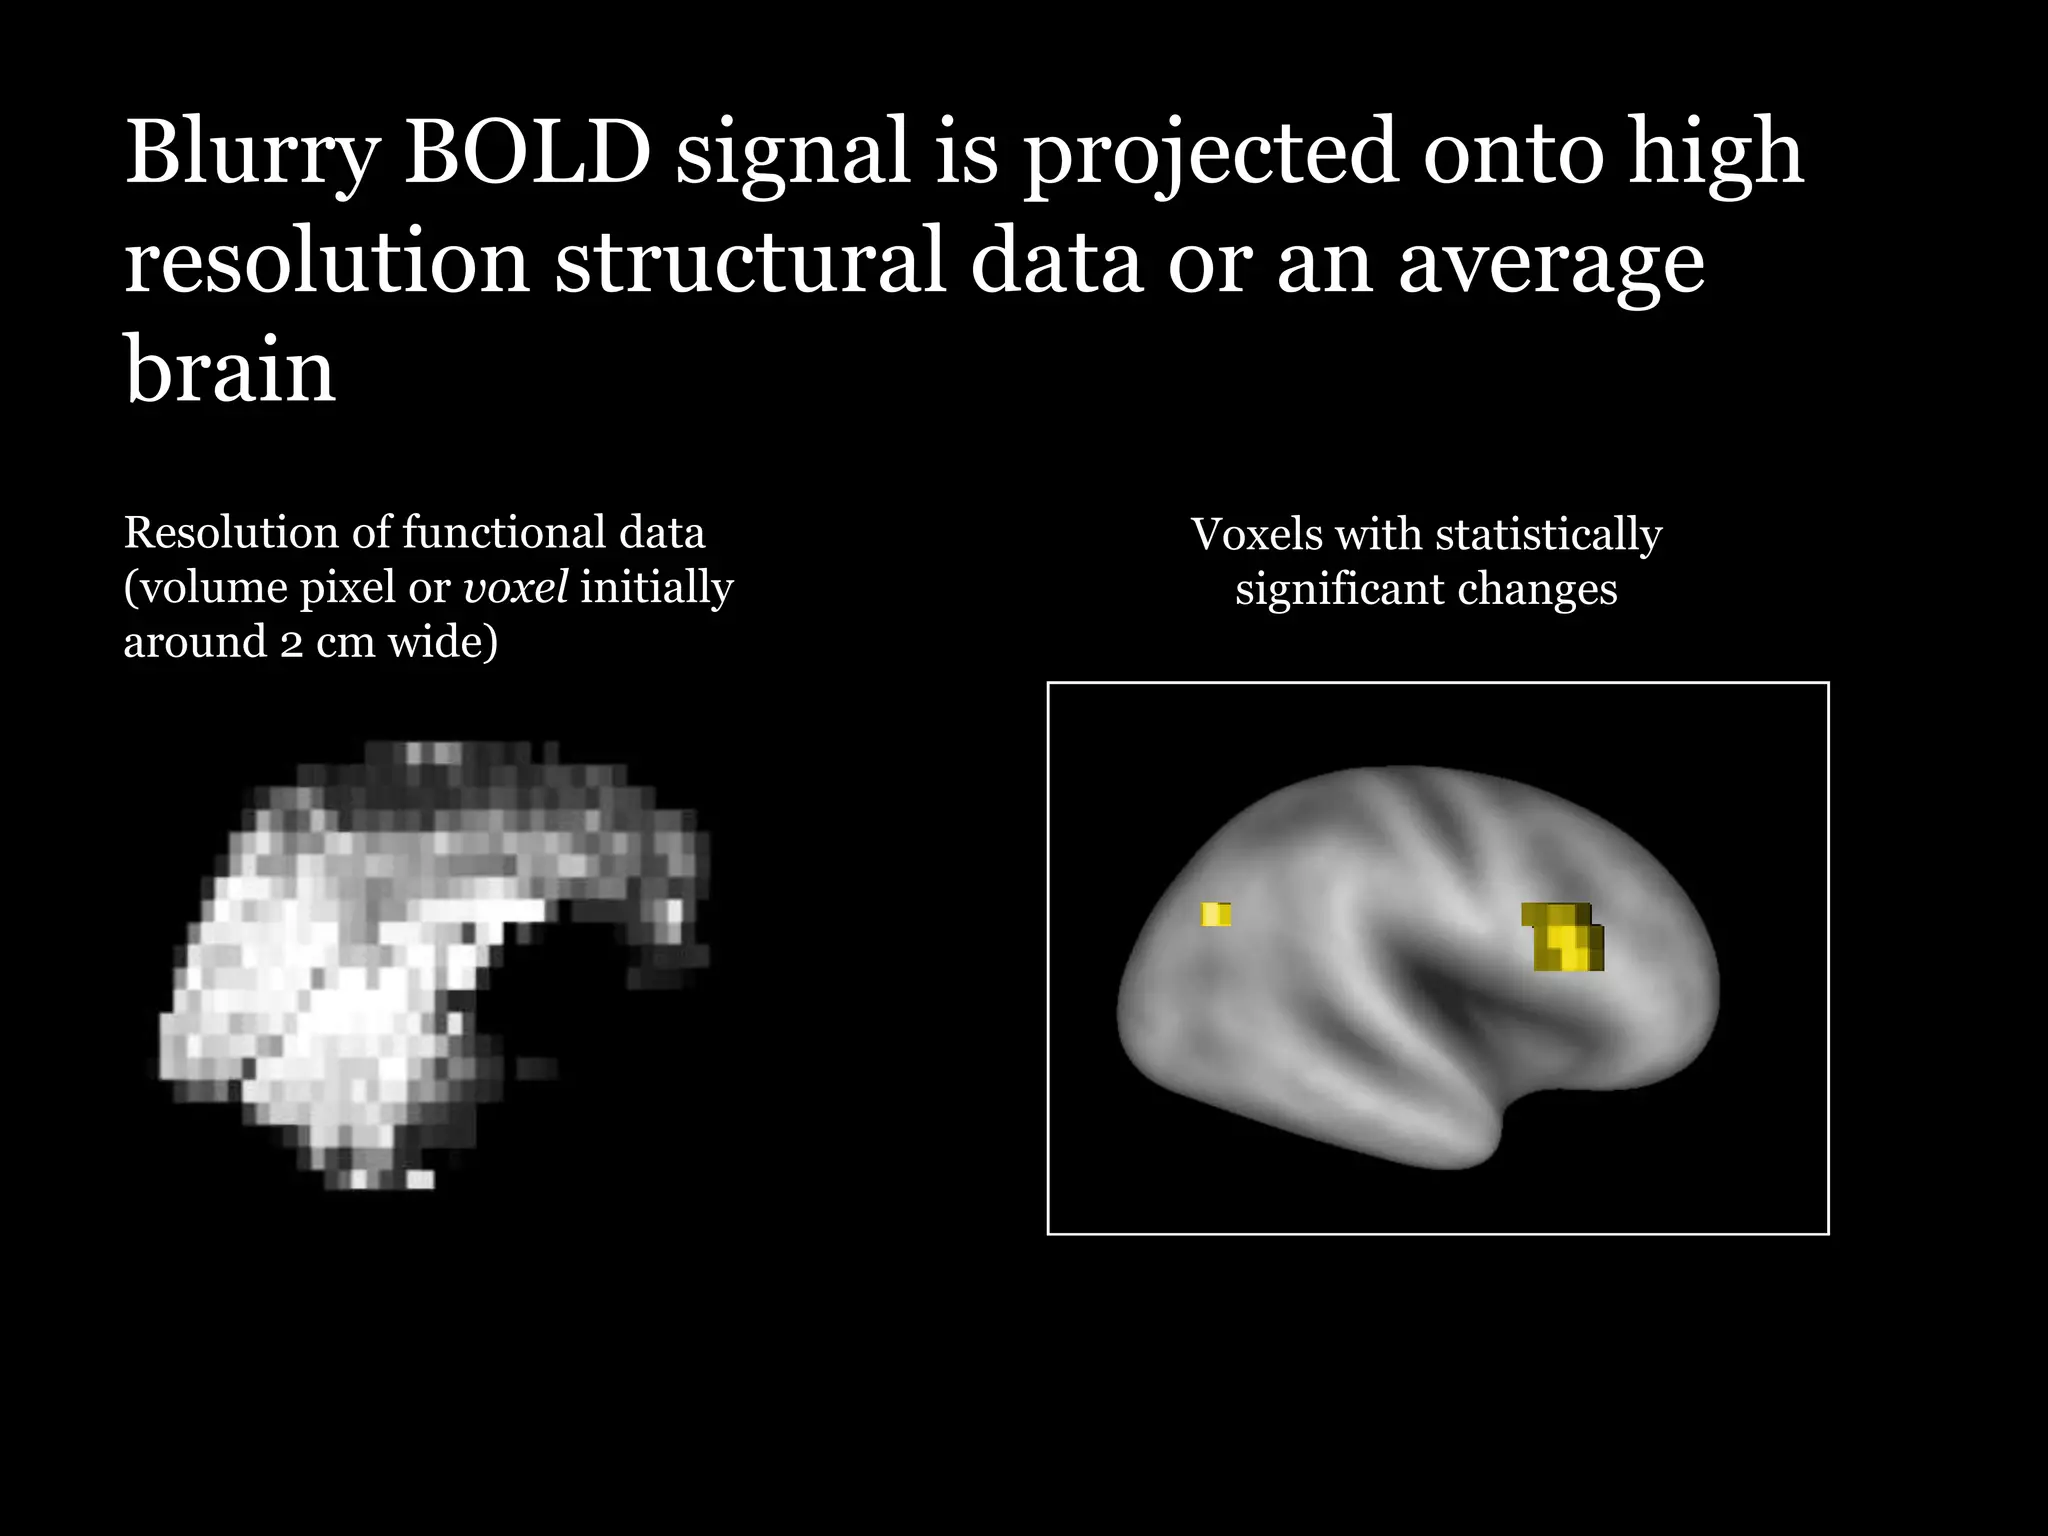
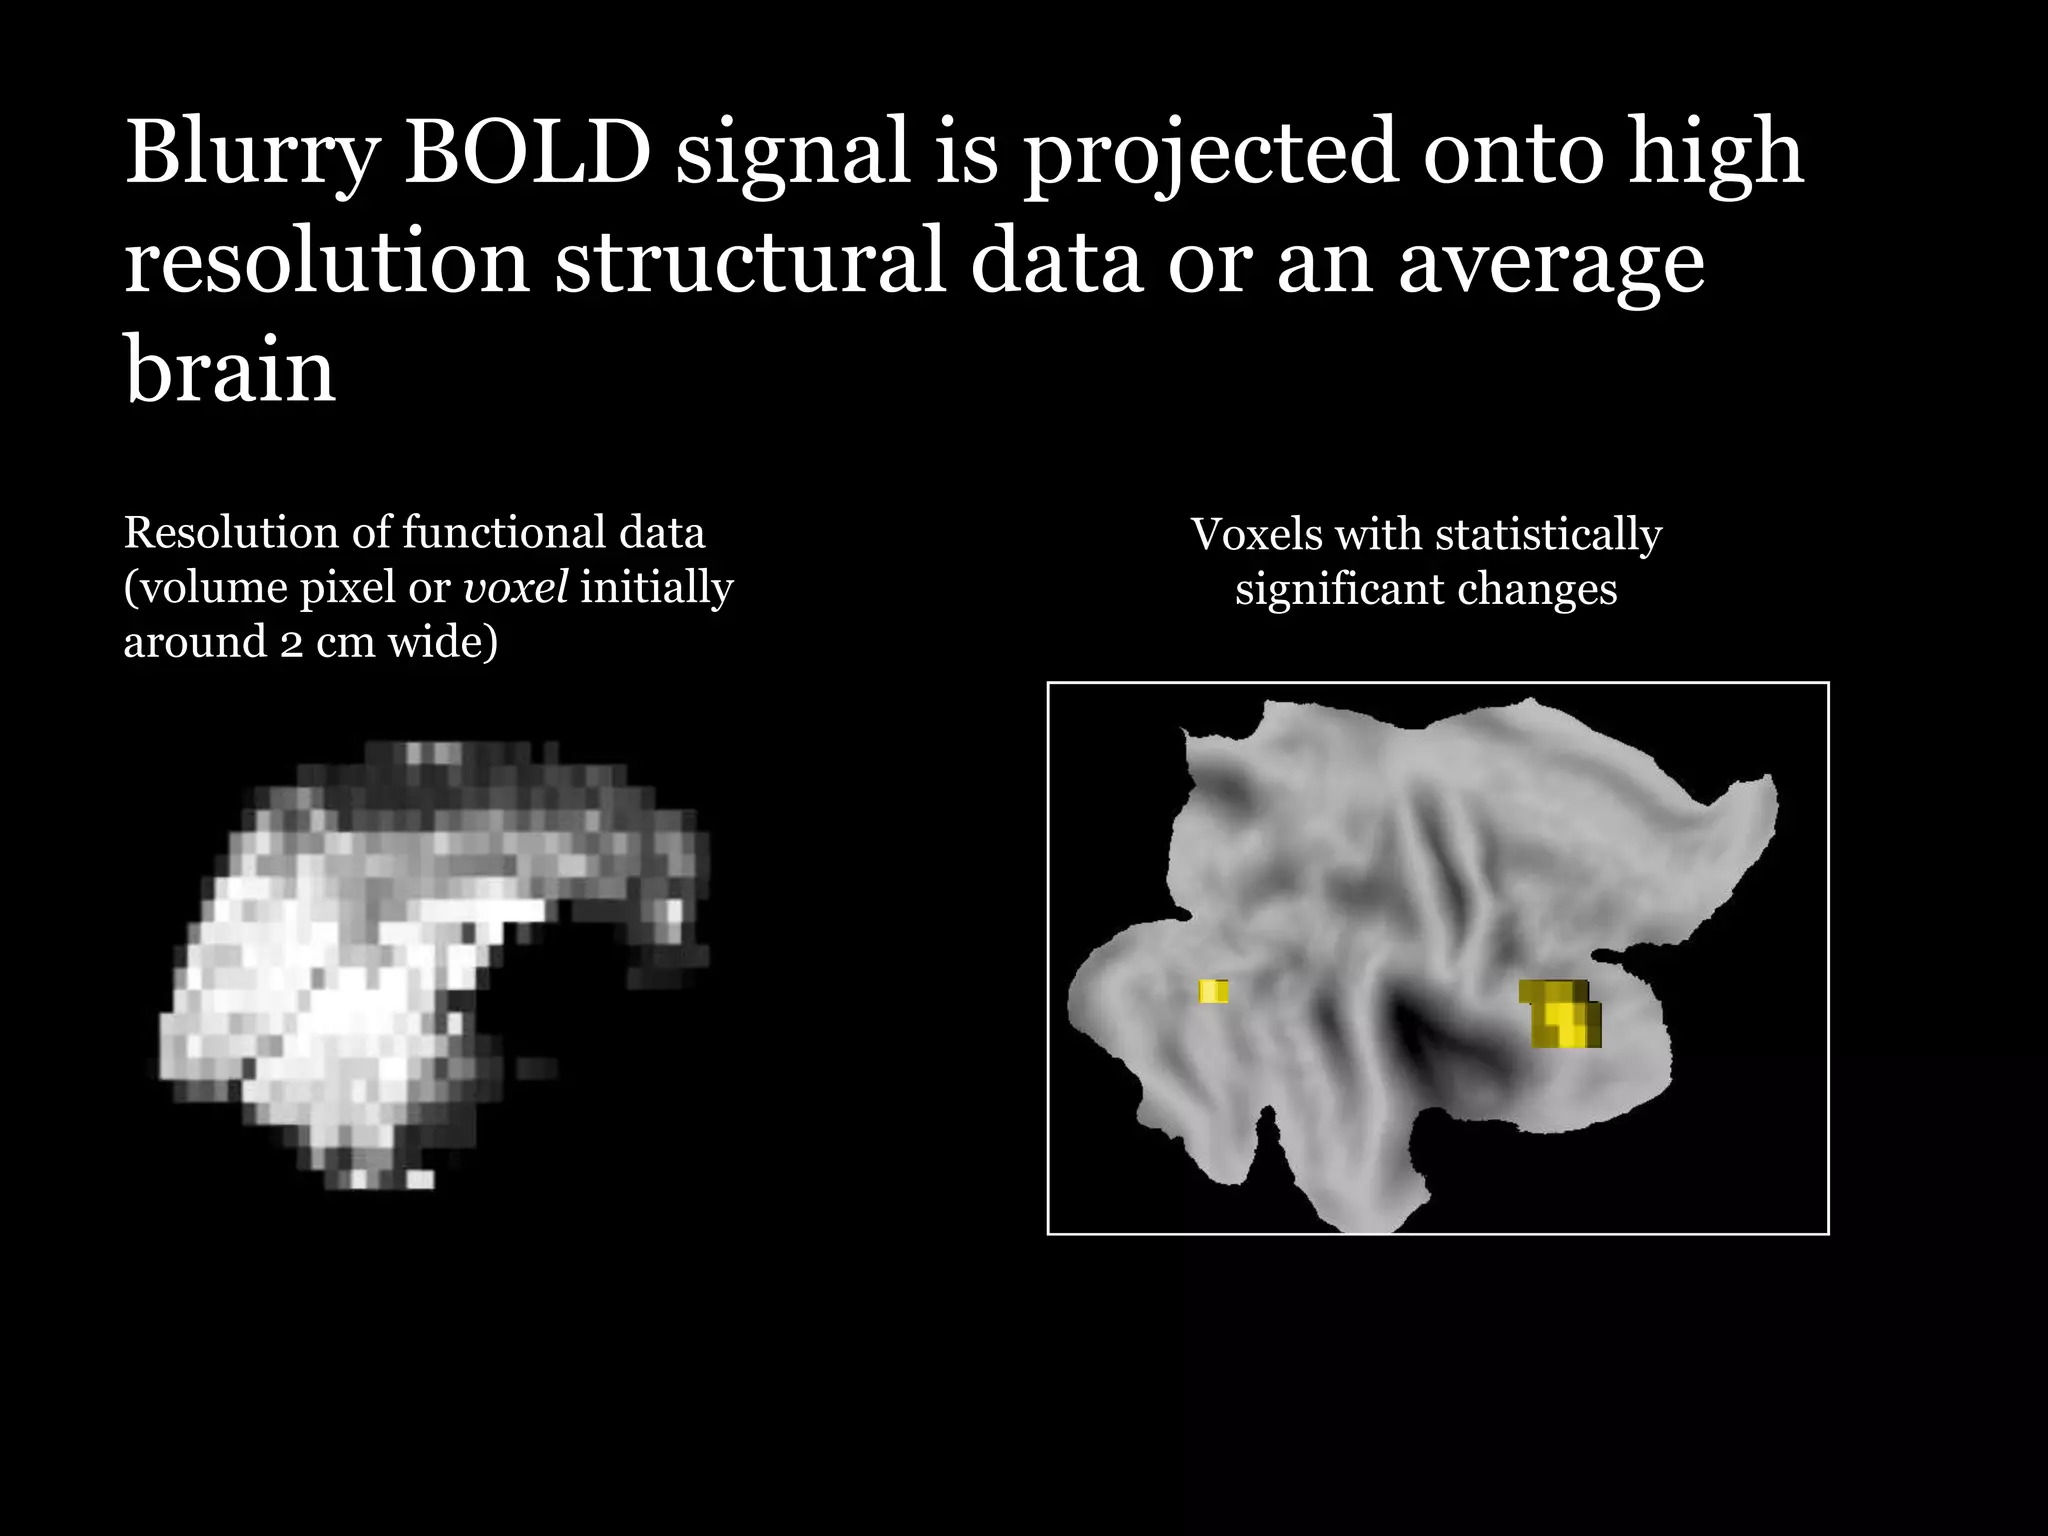
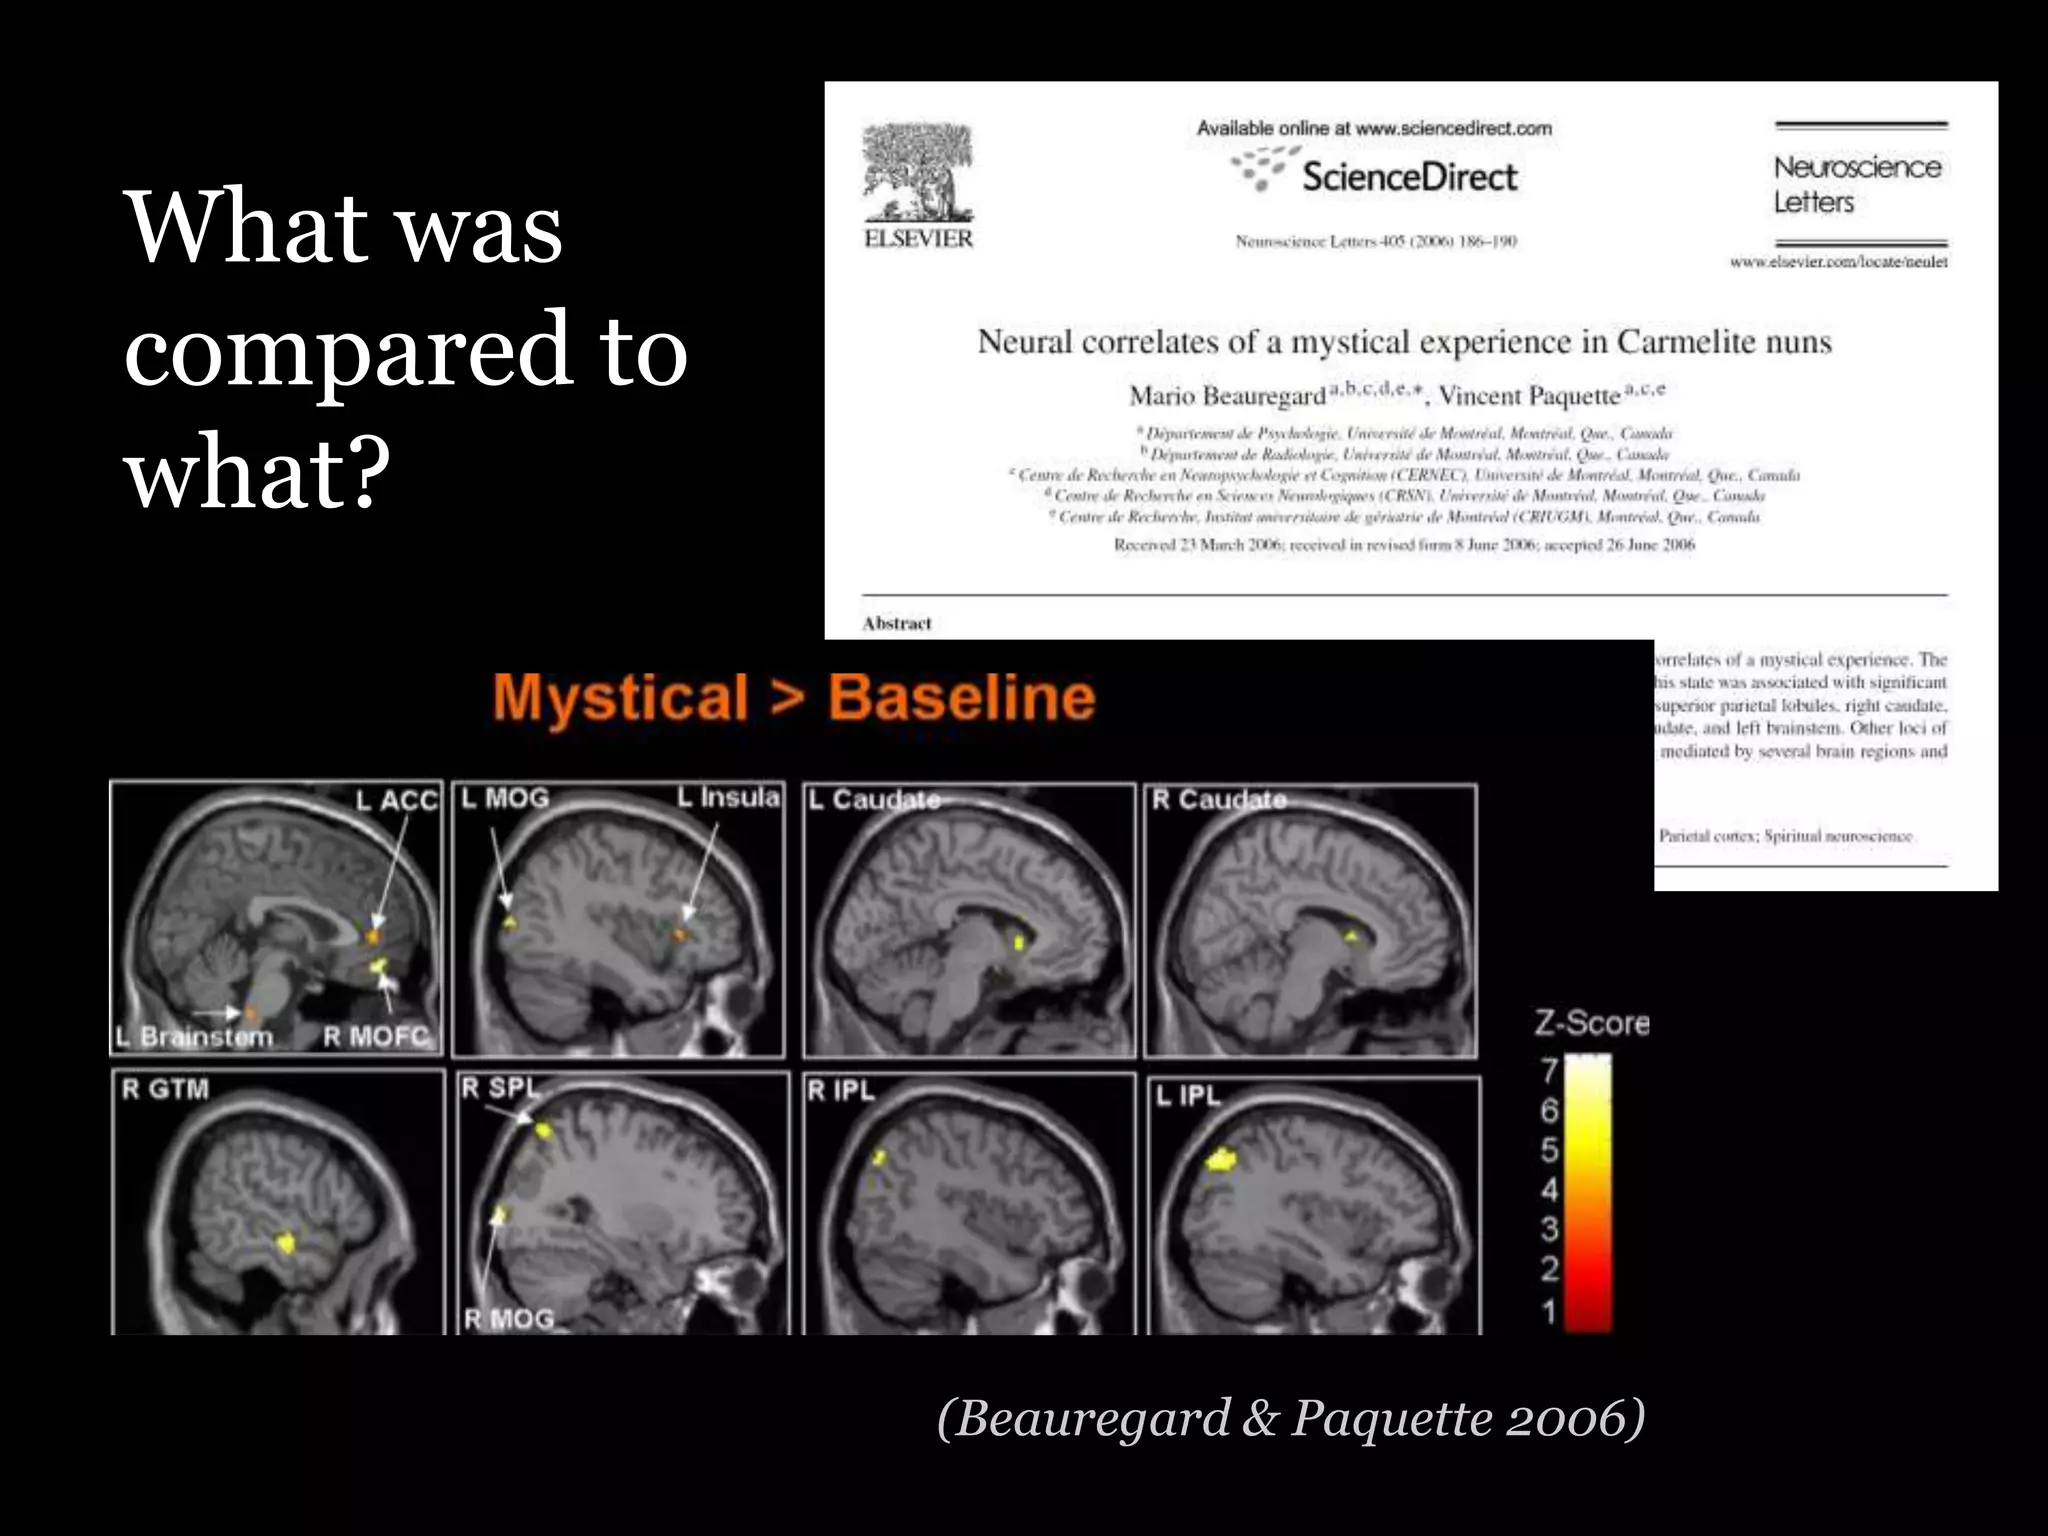

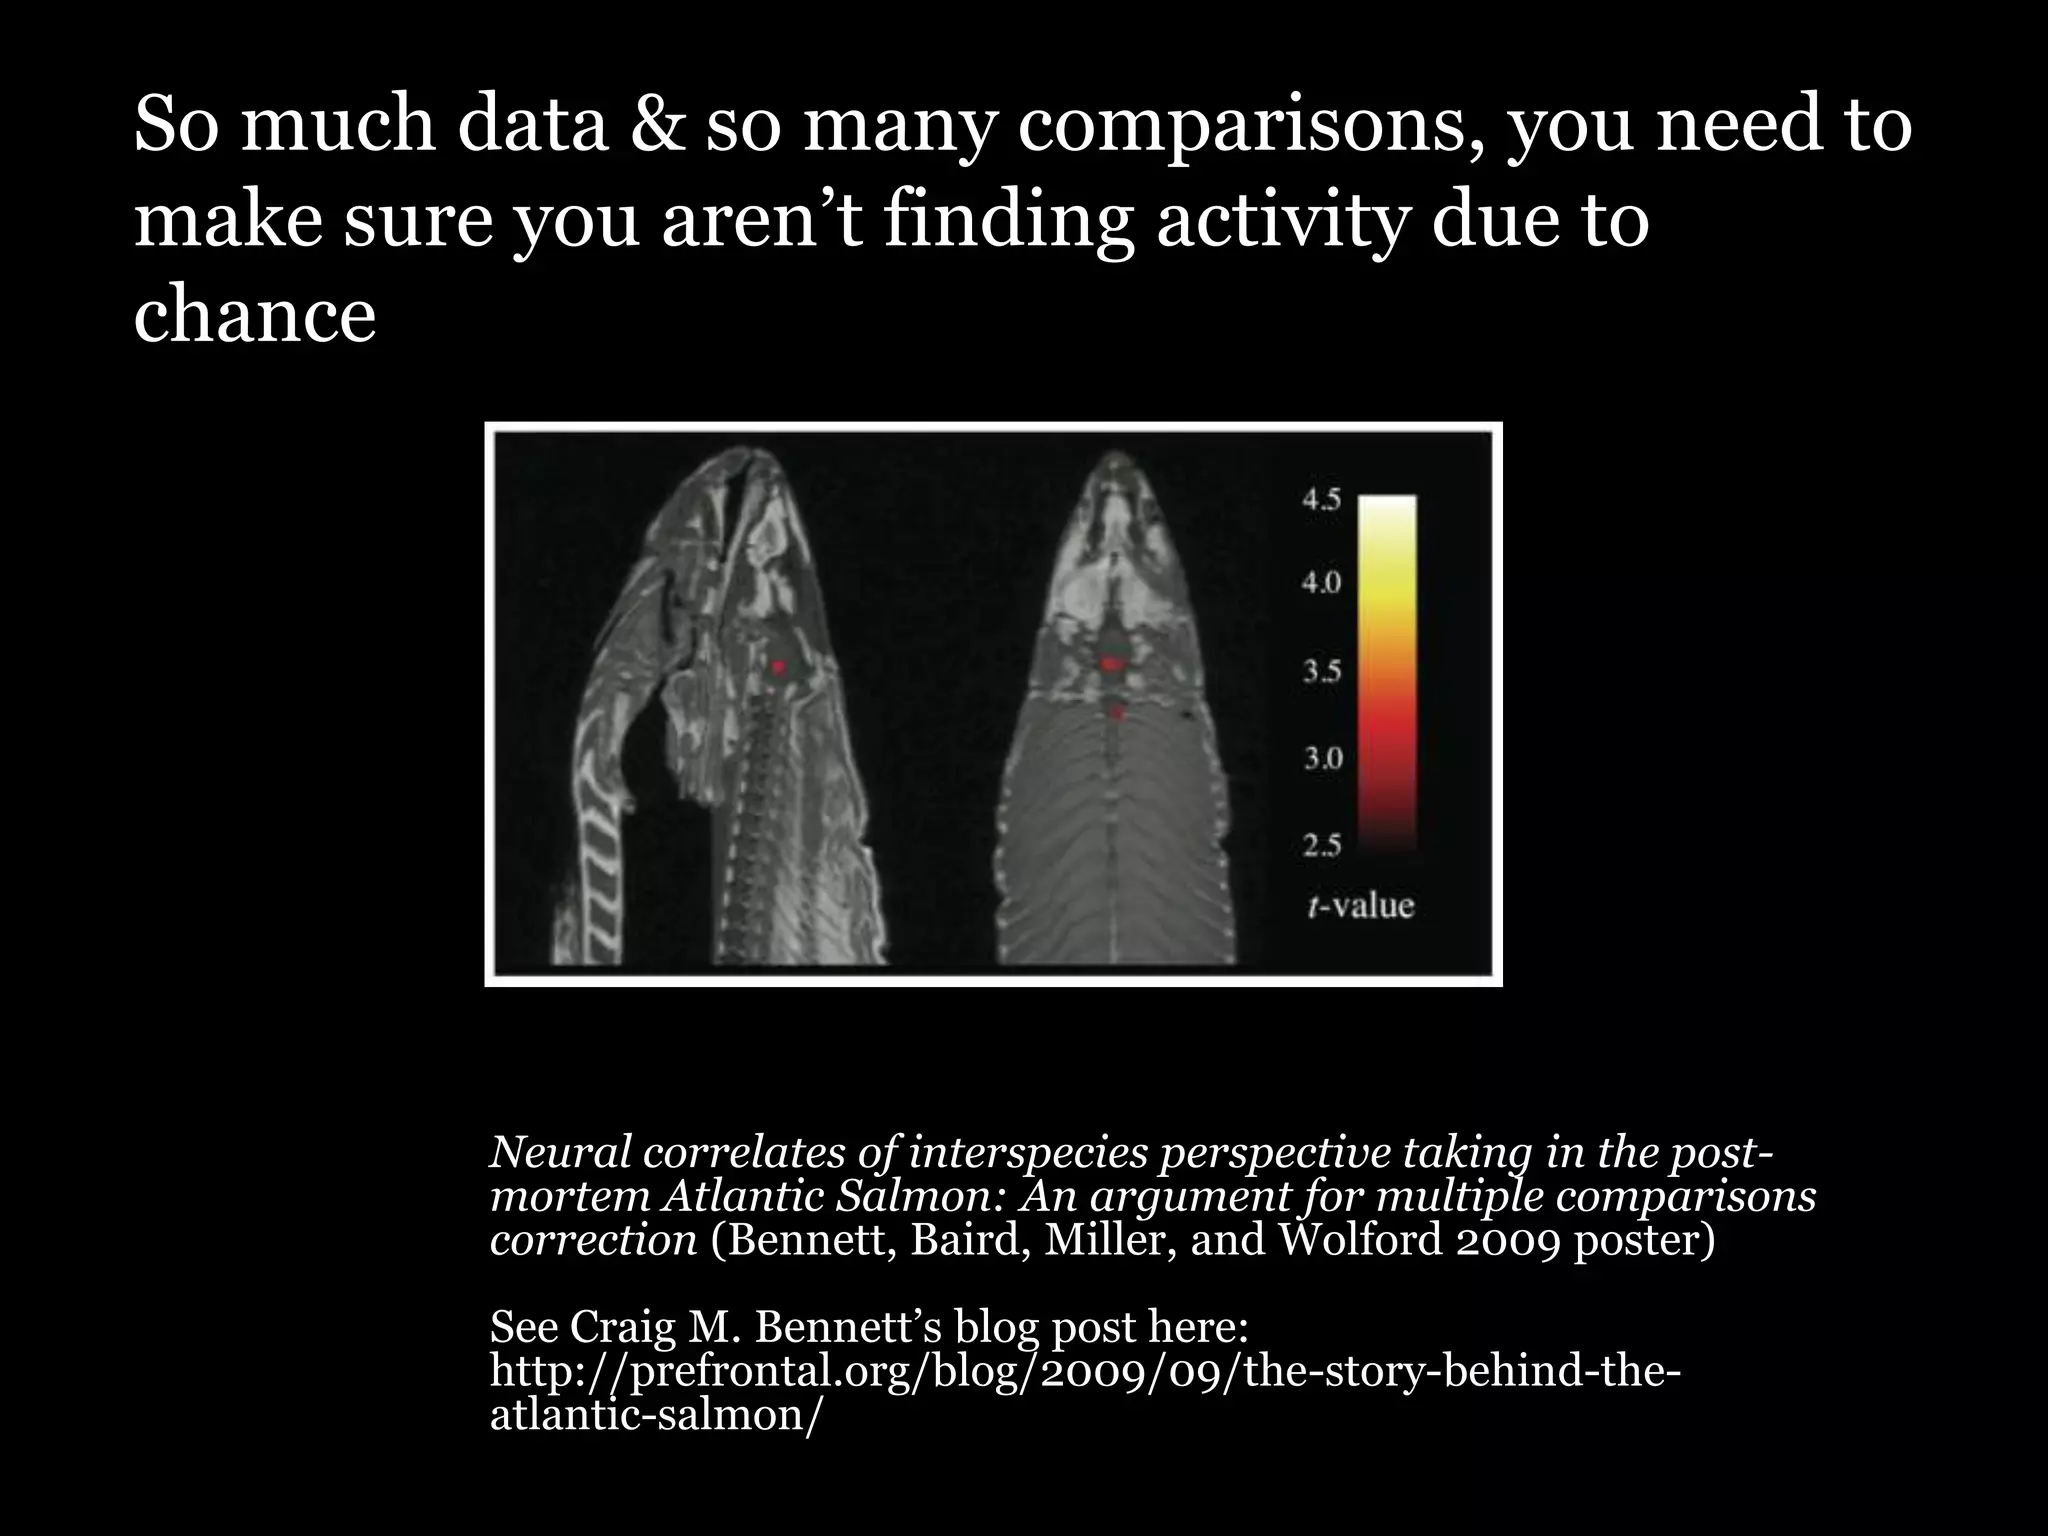
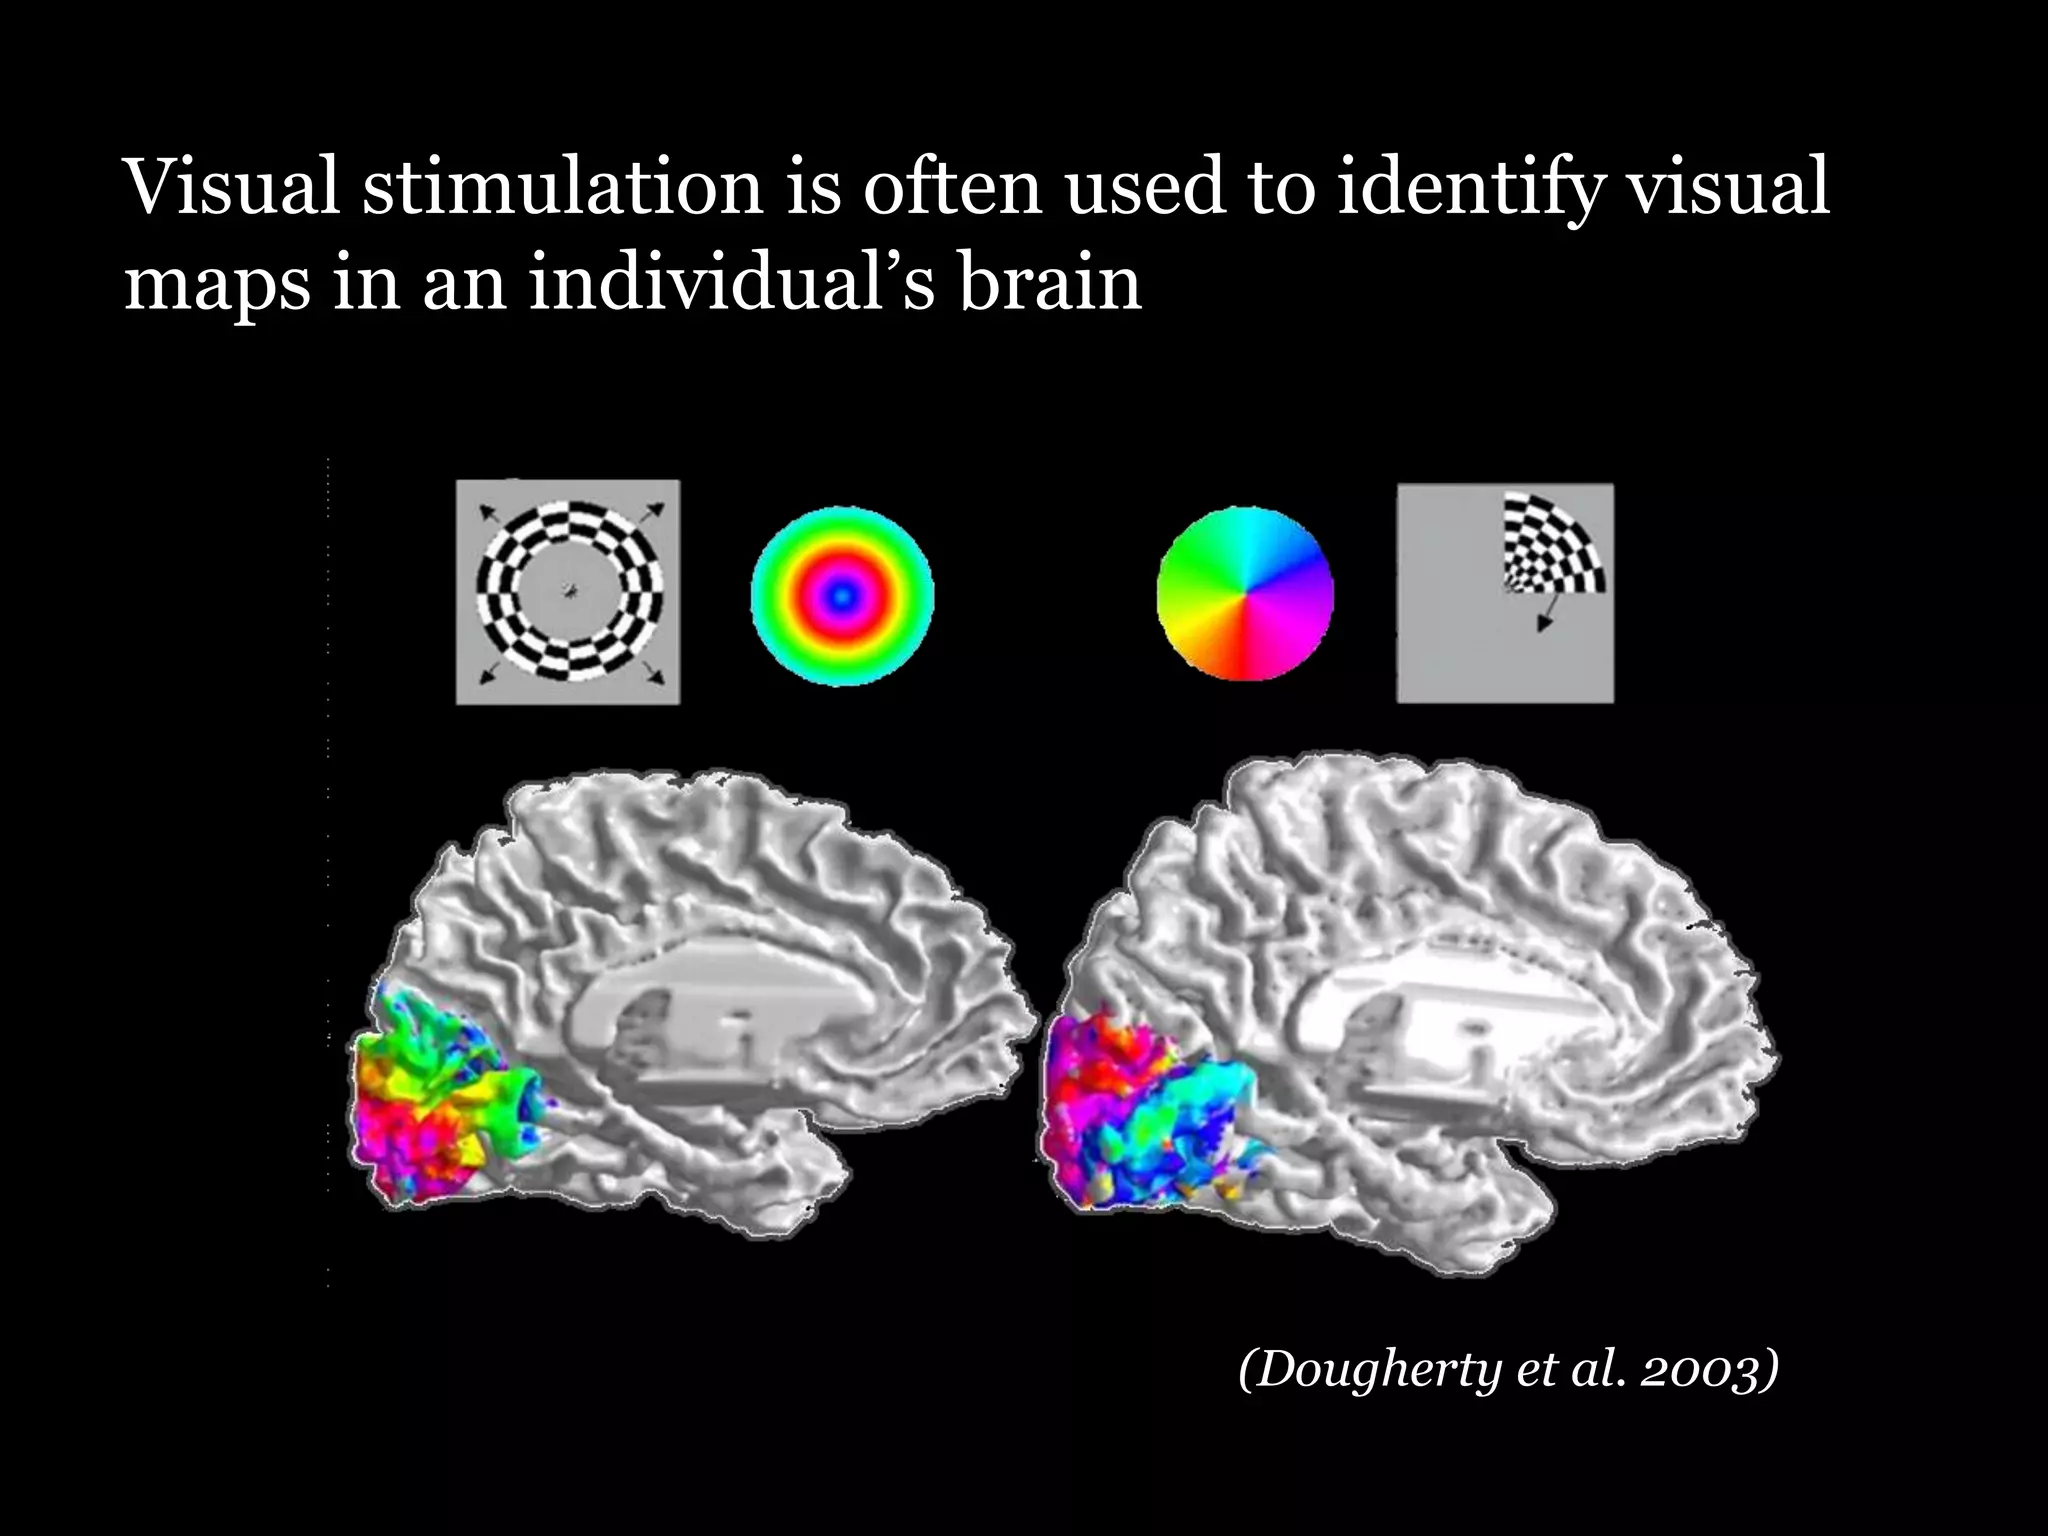

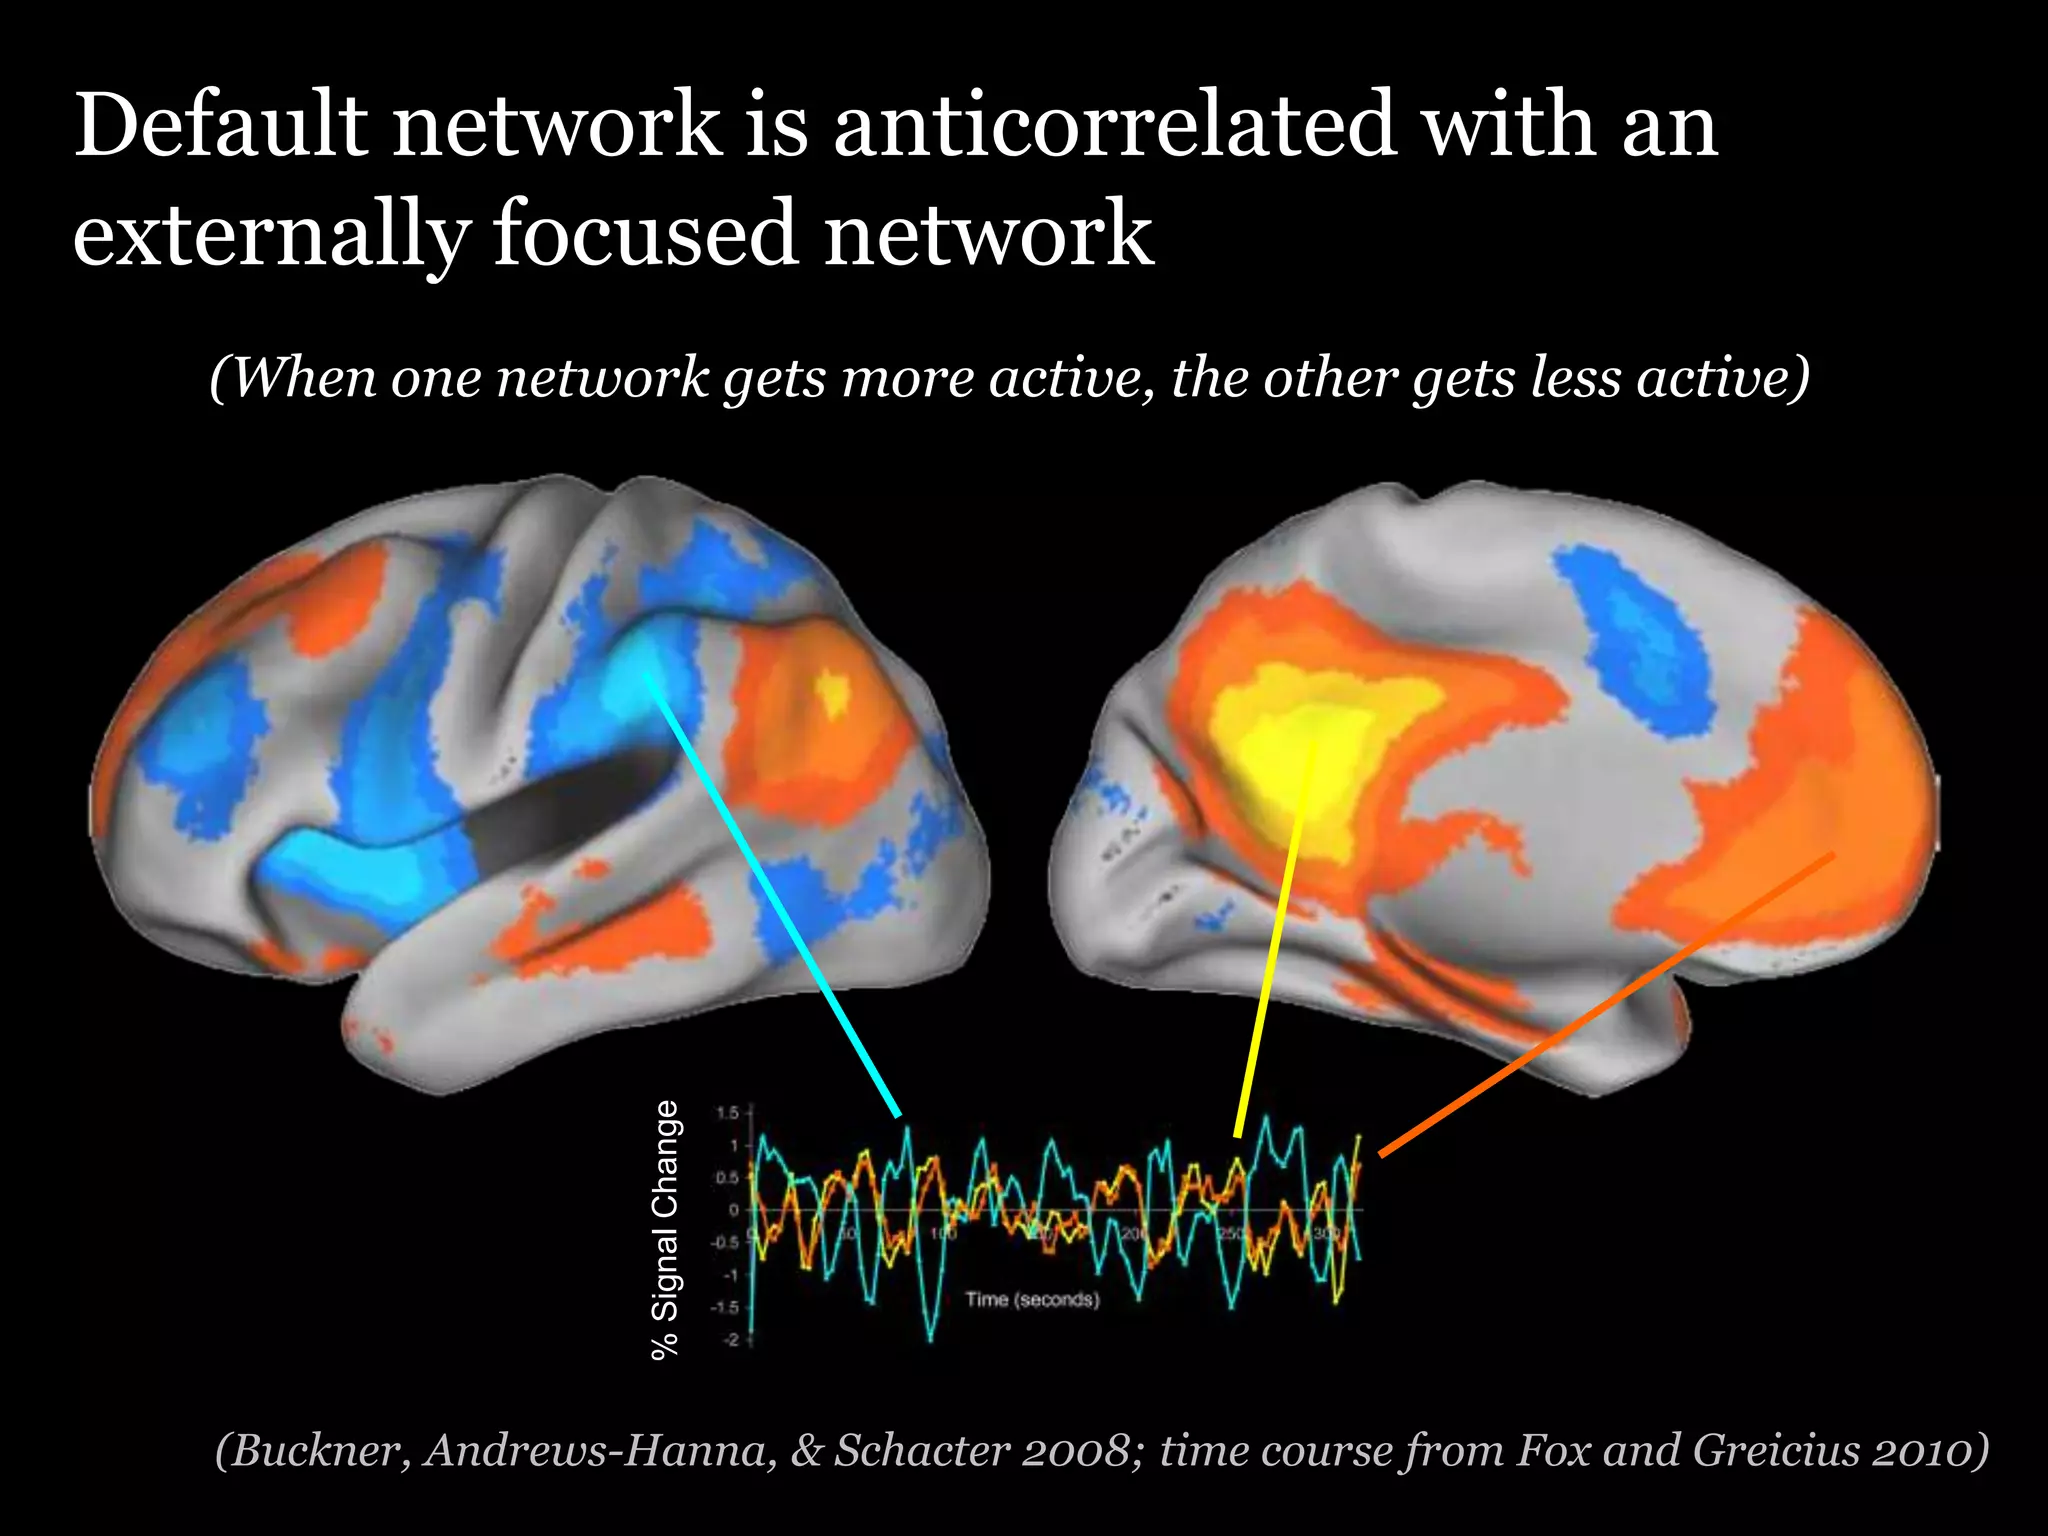

Functional magnetic resonance imaging (fMRI) indirectly measures brain activity by detecting changes in blood flow and oxygenation. It uses the difference in magnetic properties between oxygenated and deoxygenated hemoglobin, known as the blood oxygen level dependent (BOLD) signal. The BOLD signal is slow and noisy, peaks around 6 seconds after stimulation, and involves subtracting conditions to identify statistically significant activity changes. fMRI data is overlaid on high-resolution structural scans and analyzed using specialized maps of visual and other functional areas.