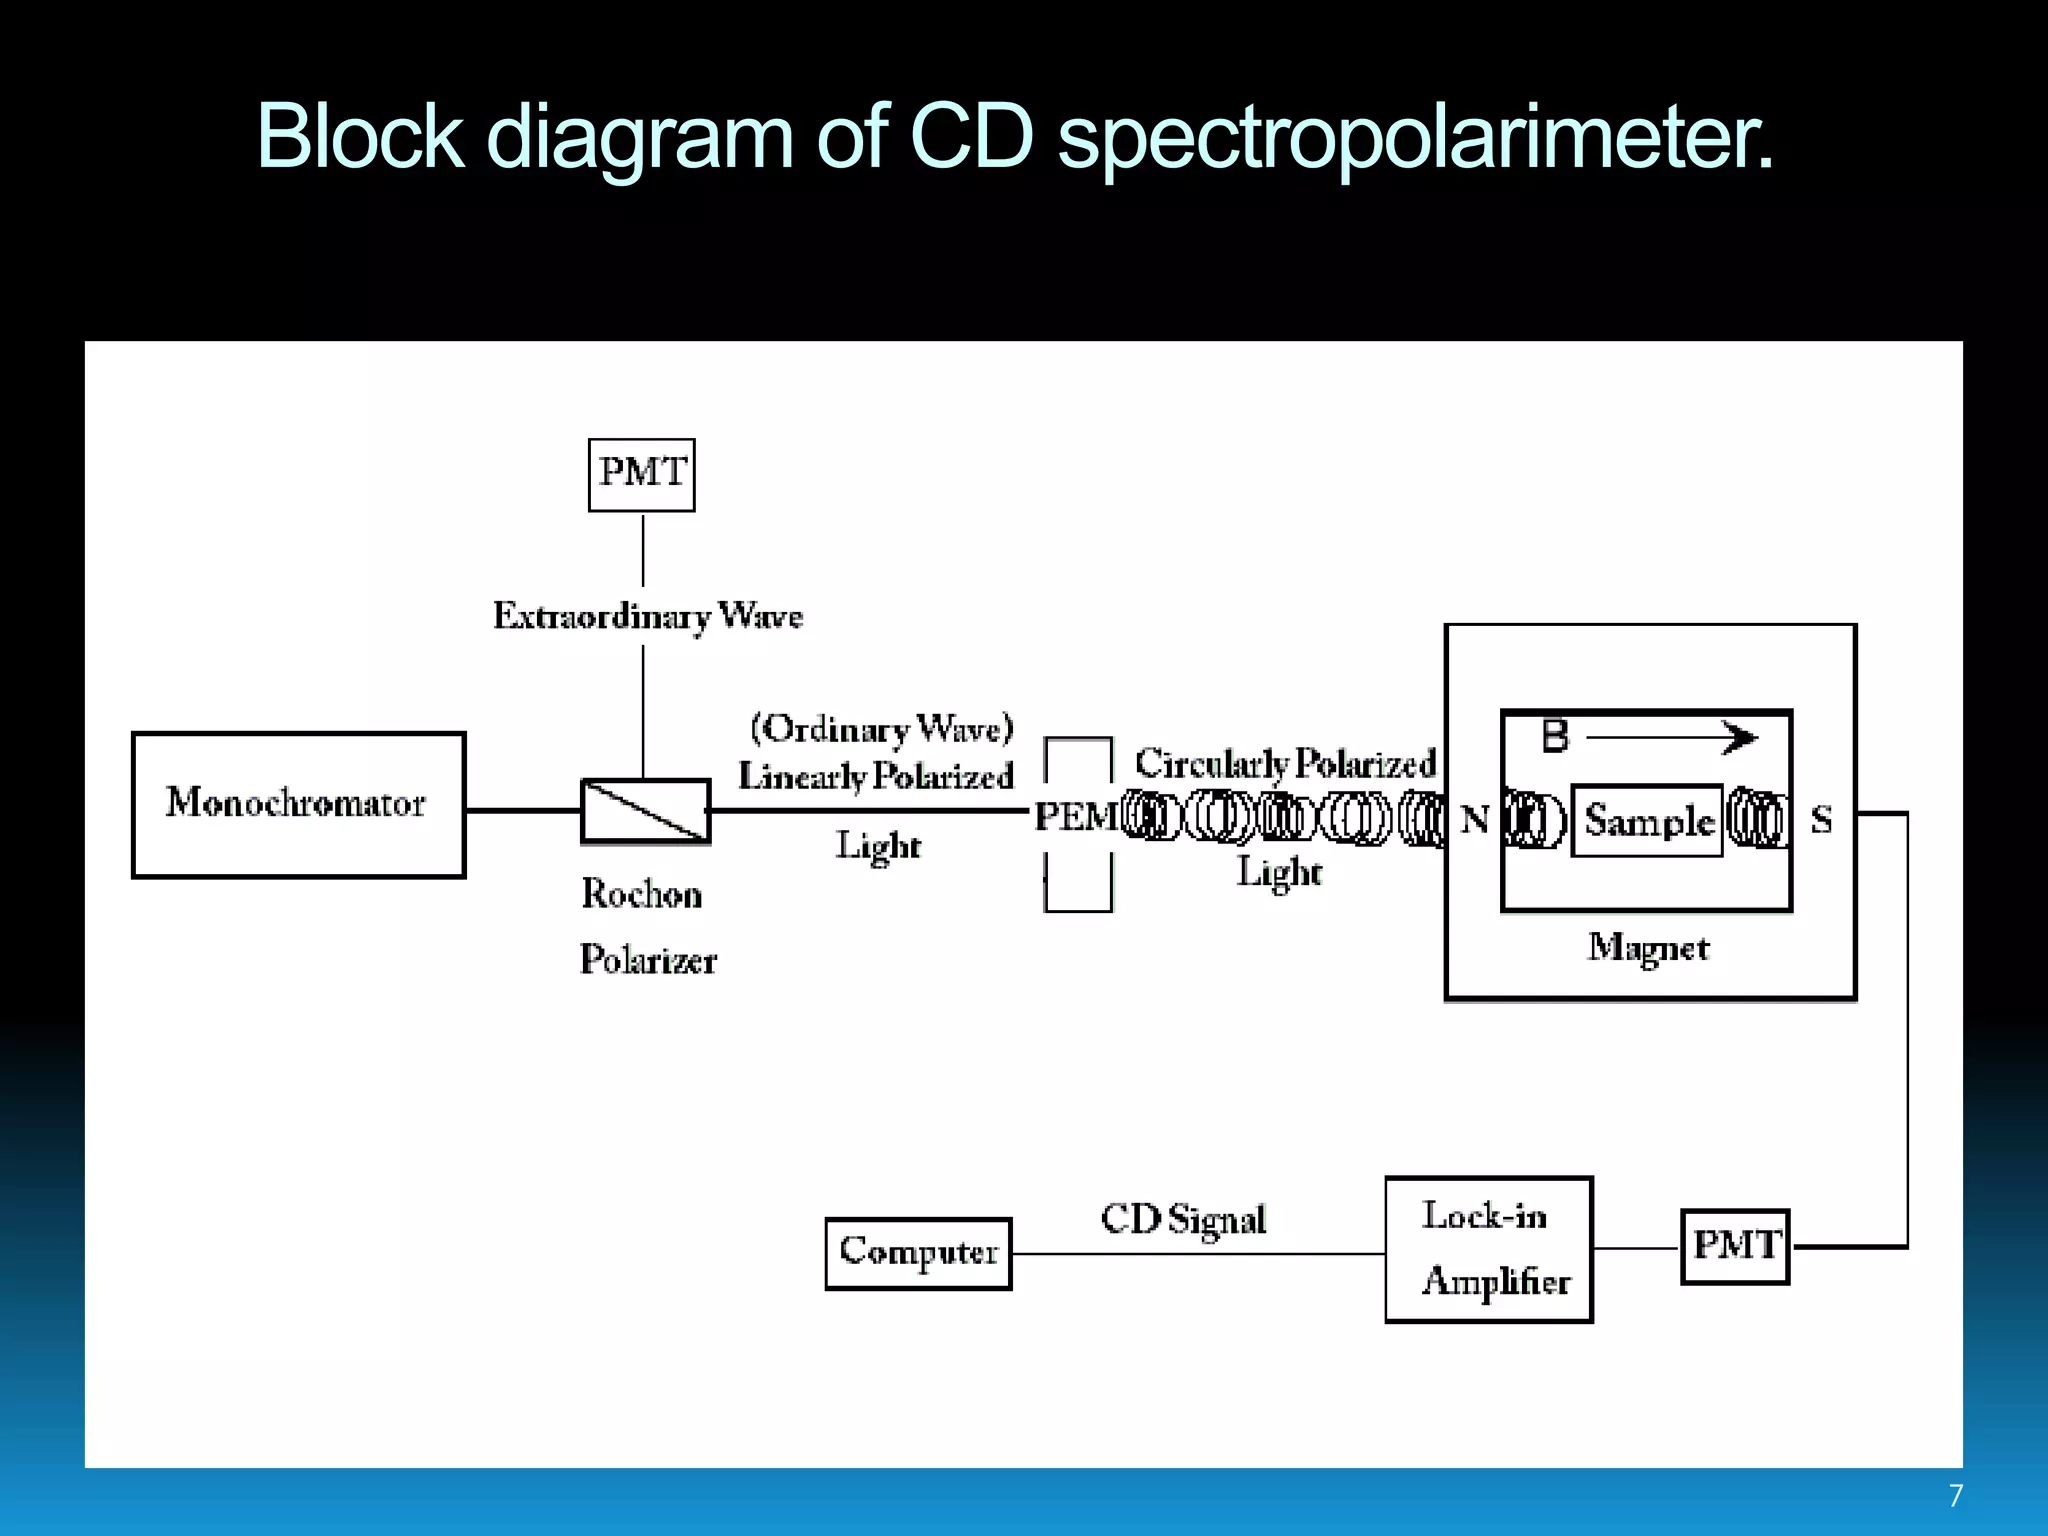
SlideShare a Scribd company logo
CIRCULAR DICHROISM
SPECTROSCOPY
PRESENTED BY:
SHRUTIKA S. HODAWDEKAR
FIRST YEAR M. PHARM.
INDUSTRAL PHARMACY.
.
1
WHAT IS CIRCULAR DICHROISM?
 Circular dichroism is observed when an optically active matter absorbs left and right
hand circular polarized slightly differently.
 Linearly polarised light is light whose oscillations are confined to a single plane.
 All polarised light states can be described as a sum of two linearly polarised states at
right angles to each other, usually referenced to the viewer as vertically and
horizontally polarised light.
Verticallypolarisedlight
2
Horizontally
polarized light.
3
B
A B
If one of the polarised states is out of phase with the other by a quarter-wave, the
resultant will be a helix and is known as circularly polarised light (CPL). The helices
can be either right-handed (R-CPL) or left-handed (L-CPL).
Left circularly polarised
light
Right circularly polarised
light
4
 Circular Dichroism (CD) is measured with a CD spectropolarimeter, which is
relatively expensive (~$70k).
 The instrument needs to be able to measure accurately in the far UV at wavelengths
down to 190-170 nm. In addition, the difference in left and right handed absorbance
A(l)- A(r) is very small (usually in the range of 0.0001) , therefore should be sensitive .
The CD is a function of wavelength.
 When circularly polarized light passes through an absorbing optically active medium,
the speeds between right and left polarizations differ (cL ≠ cR) as well as their
wavelength (λL ≠ λR) and the extent to which they are absorb (εL ≠ εR). Circular
dichroism is the difference εL ≠ εR .
 CD spectra for distinct types of secondary structure present in peptides, proteins and
nucleic acids are different. The analysis of CD spectra can therefore yield valuable
information about secondary structure of biological macromolecules.
5
CD Instrumentation
 So we needmost of the same things as for a UV/visible:
 Lamp -Xe or Xe/Hg .
 Monochromator.
 Polarizer.
 Photo-elastic modulator.
 Sample compartment.
 Detector (photomultiplier).
6
Block diagram of CD spectropolarimeter.
7
 The Chirascan™ monochromator uses two synthetic,
single‐crystal quartz prisms instead of the diffraction gratings that most people are
familiar with from normal absorbance spectrophotometers.
 Quartz prisms are more efficient than diffraction gratings for a very wide range of
wavelengths, particularly in the UV.
 Quartz is also birefringent and the prisms not only disperse light into the
component wavelengths but also, because of their birefringence, disperse the linearly
polarised components, one of which is selected for conversion to circularly polarised
light.
 A further advantage of prisms is they do not pass second‐order multiples of the
desired wavelength, which is a major source of stray‐light in grating‐based
monochromators.
8
Photo-elastic modulator:
 This is a piezoelectric element cemented to a block of fused silica.
 At rest, when the piezoelectric element is not oscillating, the silica block is not
birefringent . when driven, the piezoelectric element oscillates at its resonance
frequency (typically around 50 kHz), and induces stress in the silica in such a way
that it becomes birefringent.
 The alternating stress turns the fused silica element into a dynamic quarter‐wave
plate, retarding first vertical with respect to horizontal components of the incident
linearly polarised light by a quarter‐wave and then vice versa, producing left‐ and
then right‐ circularly polarised light at the drive frequency.
 The amplitude of the oscillation is tuned so that the retardation is appropriate for the
wavelength of light passing through the silica block.
9
CD Spectropolarimeter
10
Operation of CD spectrometer.
11
A CD active sample will absorb either L-CPL or R-CPL preferentially
Consequently there is only a steady output from the light detector.
With no CD active sample, the L-CPL and R-CPL have equal light intensities.
The photo elastic modulator converts the linearly polarised beam into left and right
circularly polarised light altering at 50 KHz.
The monochromator outputs linearly polarised light of a single
wavelength(monochromatic).
12
Plot of CD signal Vs. wavelength of light gives the CD spectrum.
The vAC signal is divided by vDC signal. The siganl is multiplied by a calibration
factor (G) to give units of milidegrees or absorbance.
The average of the light intensity over time is measured and is termed as vDC. This
can be used to scale the changes in CD measured by vAC signal.
Difference in the intensity of L-CPL and R-CPL components is measured by amplifier
tuned to the PEM frequency.
The result of the unequal amount of L-CPL and R-CPL reaching the detector , is a
signal that varies with the frequency of the PEM (50 KHz).
Sample preparation
 Additives, buffers and stabilizing compounds: Any compound which absorbs in
the region of interest (250 - 190 nm) should be avoided.
 A buffer or detergent or other chemical should not be used unless it can be shown
that the compound in question will not mask the protein signal.
 Protein solution: From the above follows that the protein solution should contain
only those chemicals necessary to maintain protein stability, and at the lowest
concentrations possible. Avoid any chemical that is unnecessary for protein
stability/solubility. The protein itself should be as pure as possible, any additional
protein or peptide will contribute to the CD signal.
13
 Contaminants: Unfolded protein, peptides, particulate matter
(scattering particles), anything that adds significant noise (or artificial
signal contributions) to the CD spectrum must be avoided. Filtering of
the solutions (0.02 um syringe filters) may improve signal to noise ratio.
 Nitrogen purging: the function of purging the CD instrument with
nitrogen is to remove oxygen from the lamp housing, monochromator,
and the sample chamber. The reason for removing oxygen is that
oxygen absorbs deep UV light, thus reducing the light available for the
measurement.
14
Typical Conditions for CD
• Protein Concentration: 0.25 mg/ml
• Cell Path Length: 1 mm
• Volume 400 μl
• Need very little sample 0.1 mg
• Concentration reasonable
• Stabilizers (Metal ions, etc.): minimum
• Buffer Concentration : 5 mM or as low as
possible while maintaining protein stability
• A structural biology method that can give real answers in a day
15
16
ADVANTAGES
 Simple and quick experiment.
 No extensive preparation..
 Relatively low
concentrations/amounts of
sample.
 Microsecond time resolution.
 Any size of macromolecule.
DISADVANTAGES
 Difficult to quantitate
similarity or differences.
 Certain buffer components
absorb strongly in Far-UV &
can cause interference.
17
Applications
CD spectroscopy has wide range of applications in many different fields.
 UV CD – to investigate the secondary structure of proteins that cannot be crystallized.
 UV/ VIS CD – to investigate charge-transfer transitions.
 Near IR CD – to investigate geometric and electronic structure by probing metal
transitions.
 Investigation of the effect of drug binding on protein secondary structure.
 Studies of the effects of environment on protein structure.
 Study of ligand -induced conformational changes.
18
References
 Applications of Circular Dichroism, International Journal of Molecular Sciences ISSN 1422-
0067.
 www.mdpi.com/journal/ijms - visited on 22/11/2014.
 Understanding Circular Dichroism , Applied Photo physics Ltd- www.photophysics.com -
22/11/2014.
 Protein Secondary Structure and Circular Dichroism : A Practical Guide, W.C.Johnson,
PROTEINS 7, 205-214 (1990).
 Circular Dichroism and Optical Rotary Dispersion of Proteins and Polypeptides, A.J.Alder,
N.J.Greenfield and G.D.Fasman, Meth. Enzymology 27, 675 (1973).
 www.wikipedia.com – 24/11/2014.
19
20

More Related Content

What's hot

FRET, FRAP, TIFR MICROSCOPY
FRET, FRAP, TIFR MICROSCOPYFRET, FRAP, TIFR MICROSCOPY
FRET, FRAP, TIFR MICROSCOPY
BaishaliTamuli1
 
fluroscence spectroscopy
fluroscence spectroscopyfluroscence spectroscopy
fluroscence spectroscopyPooja Dhurjad
 
transmission Electron Microscopy (Tem)
transmission Electron Microscopy (Tem)transmission Electron Microscopy (Tem)
transmission Electron Microscopy (Tem)
Sivasangari Shanmugam
 
Fluorescence(Forster) Resonance Energy Transfer
Fluorescence(Forster) Resonance Energy TransferFluorescence(Forster) Resonance Energy Transfer
Fluorescence(Forster) Resonance Energy Transfersavvysahana
 
MALDI-TOF Mass Spectrometry
MALDI-TOF Mass SpectrometryMALDI-TOF Mass Spectrometry
MALDI-TOF Mass Spectrometry
Nawaz Shah
 
Isoelectric focusing electrophoresis- Principle , procedure and applications
Isoelectric focusing electrophoresis- Principle , procedure and applicationsIsoelectric focusing electrophoresis- Principle , procedure and applications
Isoelectric focusing electrophoresis- Principle , procedure and applications
JaskiranKaur72
 
Electron spin resonance(ESR) spectroscopy
Electron spin resonance(ESR) spectroscopyElectron spin resonance(ESR) spectroscopy
Electron spin resonance(ESR) spectroscopy
Preeti Choudhary
 
Optical rotatory dispersion
Optical rotatory dispersionOptical rotatory dispersion
Optical rotatory dispersion
Sujit Patel
 
PAGE- Electrophoresis
PAGE- ElectrophoresisPAGE- Electrophoresis
PAGE- Electrophoresis
Tapeshwar Yadav
 
Reverse phase chromatography
Reverse phase chromatographyReverse phase chromatography
Reverse phase chromatography
faixan_live
 
OPTICAL ROTATORY DISPERSION & CIRCULAR DICHORISM(ORD CD)
OPTICAL ROTATORY DISPERSION & CIRCULAR DICHORISM(ORD CD)OPTICAL ROTATORY DISPERSION & CIRCULAR DICHORISM(ORD CD)
OPTICAL ROTATORY DISPERSION & CIRCULAR DICHORISM(ORD CD)
Suvarta Maru
 
Scanning and transmission electron microscopy
Scanning and transmission electron microscopyScanning and transmission electron microscopy
Scanning and transmission electron microscopy
gohil sanjay bhagvanji
 
Sedimentation for determining molecular weight of macromolecules
Sedimentation for determining molecular weight of macromoleculesSedimentation for determining molecular weight of macromolecules
Sedimentation for determining molecular weight of macromolecules
ShubhangiSuri1
 
Electron Spray Ionization (ESI) and its Applications
Electron Spray Ionization (ESI) and its ApplicationsElectron Spray Ionization (ESI) and its Applications
Electron Spray Ionization (ESI) and its Applications
Nisar Ali
 
Isoelectric focussing
Isoelectric focussingIsoelectric focussing
Isoelectric focussing
arushe143
 
Raman spectroscopy
Raman spectroscopyRaman spectroscopy
Raman spectroscopy
Bhaumik Bavishi
 
Basic principle of liquid scintillation counter norfaizal
Basic principle of liquid scintillation counter norfaizalBasic principle of liquid scintillation counter norfaizal
Basic principle of liquid scintillation counter norfaizal
Mahbubul Hassan
 
Principles and application of fluorescence spectroscopy
Principles and application of fluorescence spectroscopyPrinciples and application of fluorescence spectroscopy
Principles and application of fluorescence spectroscopy
ruthannfrimpong1
 
Scanning electron microscopy (sem)
Scanning electron microscopy (sem)Scanning electron microscopy (sem)
Scanning electron microscopy (sem)
Sivasangari Shanmugam
 

What's hot (20)

FRET, FRAP, TIFR MICROSCOPY
FRET, FRAP, TIFR MICROSCOPYFRET, FRAP, TIFR MICROSCOPY
FRET, FRAP, TIFR MICROSCOPY
 
fluroscence spectroscopy
fluroscence spectroscopyfluroscence spectroscopy
fluroscence spectroscopy
 
transmission Electron Microscopy (Tem)
transmission Electron Microscopy (Tem)transmission Electron Microscopy (Tem)
transmission Electron Microscopy (Tem)
 
Fluorescence(Forster) Resonance Energy Transfer
Fluorescence(Forster) Resonance Energy TransferFluorescence(Forster) Resonance Energy Transfer
Fluorescence(Forster) Resonance Energy Transfer
 
MALDI-TOF Mass Spectrometry
MALDI-TOF Mass SpectrometryMALDI-TOF Mass Spectrometry
MALDI-TOF Mass Spectrometry
 
Isoelectric focusing electrophoresis- Principle , procedure and applications
Isoelectric focusing electrophoresis- Principle , procedure and applicationsIsoelectric focusing electrophoresis- Principle , procedure and applications
Isoelectric focusing electrophoresis- Principle , procedure and applications
 
Electron spin resonance(ESR) spectroscopy
Electron spin resonance(ESR) spectroscopyElectron spin resonance(ESR) spectroscopy
Electron spin resonance(ESR) spectroscopy
 
Optical rotatory dispersion
Optical rotatory dispersionOptical rotatory dispersion
Optical rotatory dispersion
 
PAGE- Electrophoresis
PAGE- ElectrophoresisPAGE- Electrophoresis
PAGE- Electrophoresis
 
Reverse phase chromatography
Reverse phase chromatographyReverse phase chromatography
Reverse phase chromatography
 
OPTICAL ROTATORY DISPERSION & CIRCULAR DICHORISM(ORD CD)
OPTICAL ROTATORY DISPERSION & CIRCULAR DICHORISM(ORD CD)OPTICAL ROTATORY DISPERSION & CIRCULAR DICHORISM(ORD CD)
OPTICAL ROTATORY DISPERSION & CIRCULAR DICHORISM(ORD CD)
 
Scanning and transmission electron microscopy
Scanning and transmission electron microscopyScanning and transmission electron microscopy
Scanning and transmission electron microscopy
 
Sedimentation for determining molecular weight of macromolecules
Sedimentation for determining molecular weight of macromoleculesSedimentation for determining molecular weight of macromolecules
Sedimentation for determining molecular weight of macromolecules
 
Electron Spray Ionization (ESI) and its Applications
Electron Spray Ionization (ESI) and its ApplicationsElectron Spray Ionization (ESI) and its Applications
Electron Spray Ionization (ESI) and its Applications
 
Isoelectric focussing
Isoelectric focussingIsoelectric focussing
Isoelectric focussing
 
Raman spectroscopy
Raman spectroscopyRaman spectroscopy
Raman spectroscopy
 
MALDI
MALDIMALDI
MALDI
 
Basic principle of liquid scintillation counter norfaizal
Basic principle of liquid scintillation counter norfaizalBasic principle of liquid scintillation counter norfaizal
Basic principle of liquid scintillation counter norfaizal
 
Principles and application of fluorescence spectroscopy
Principles and application of fluorescence spectroscopyPrinciples and application of fluorescence spectroscopy
Principles and application of fluorescence spectroscopy
 
Scanning electron microscopy (sem)
Scanning electron microscopy (sem)Scanning electron microscopy (sem)
Scanning electron microscopy (sem)
 

Viewers also liked

MALDI-TOF: Pricinple and Its Application in Biochemistry and Biotechnology
MALDI-TOF: Pricinple  and Its Application in Biochemistry and BiotechnologyMALDI-TOF: Pricinple  and Its Application in Biochemistry and Biotechnology
MALDI-TOF: Pricinple and Its Application in Biochemistry and Biotechnology
Devakumar Jain
 
Maldi tof
Maldi tofMaldi tof
Maldi tof
purvi gosrani
 
Maldi tof ppt adnya
Maldi tof ppt adnyaMaldi tof ppt adnya
Maldi tof ppt adnyaAdnya Desai
 
MALDI - TOF
MALDI - TOFMALDI - TOF
MALDI - TOF
Hima Haridasan
 
Flame photometry
Flame photometryFlame photometry
Flame photometry
Basil "Lexi" Bruno
 
Ultra violet (UV) spectroscopy, introduction,principle instrumentation,differ...
Ultra violet (UV) spectroscopy, introduction,principle instrumentation,differ...Ultra violet (UV) spectroscopy, introduction,principle instrumentation,differ...
Ultra violet (UV) spectroscopy, introduction,principle instrumentation,differ...
mariomS7
 
UV visible spectroscopy
UV visible spectroscopyUV visible spectroscopy
UV visible spectroscopy
Santosh Damkondwar
 

Viewers also liked (7)

MALDI-TOF: Pricinple and Its Application in Biochemistry and Biotechnology
MALDI-TOF: Pricinple  and Its Application in Biochemistry and BiotechnologyMALDI-TOF: Pricinple  and Its Application in Biochemistry and Biotechnology
MALDI-TOF: Pricinple and Its Application in Biochemistry and Biotechnology
 
Maldi tof
Maldi tofMaldi tof
Maldi tof
 
Maldi tof ppt adnya
Maldi tof ppt adnyaMaldi tof ppt adnya
Maldi tof ppt adnya
 
MALDI - TOF
MALDI - TOFMALDI - TOF
MALDI - TOF
 
Flame photometry
Flame photometryFlame photometry
Flame photometry
 
Ultra violet (UV) spectroscopy, introduction,principle instrumentation,differ...
Ultra violet (UV) spectroscopy, introduction,principle instrumentation,differ...Ultra violet (UV) spectroscopy, introduction,principle instrumentation,differ...
Ultra violet (UV) spectroscopy, introduction,principle instrumentation,differ...
 
UV visible spectroscopy
UV visible spectroscopyUV visible spectroscopy
UV visible spectroscopy
 

Similar to Circular dichroism spectroscopy seminar ppt

Circular dichroism in Biochemistryppt.ppt
Circular dichroism in Biochemistryppt.pptCircular dichroism in Biochemistryppt.ppt
Circular dichroism in Biochemistryppt.ppt
ManjuSingh118444
 
CD Spectroscopy Presentation1.pptx
CD Spectroscopy Presentation1.pptxCD Spectroscopy Presentation1.pptx
CD Spectroscopy Presentation1.pptx
NIBGE-College
 
M.Sc. Part I 1.3 INFRARED SPECTROPHOTOMETRY PPT.ppsx
M.Sc. Part I  1.3 INFRARED SPECTROPHOTOMETRY PPT.ppsxM.Sc. Part I  1.3 INFRARED SPECTROPHOTOMETRY PPT.ppsx
M.Sc. Part I 1.3 INFRARED SPECTROPHOTOMETRY PPT.ppsx
Dipu77
 
M.Sc. Part I 1.3 INFRARED SPECTROPHOTOMETRY PPT (1).ppsx
M.Sc. Part I  1.3 INFRARED SPECTROPHOTOMETRY PPT (1).ppsxM.Sc. Part I  1.3 INFRARED SPECTROPHOTOMETRY PPT (1).ppsx
M.Sc. Part I 1.3 INFRARED SPECTROPHOTOMETRY PPT (1).ppsx
SIMARANJAISWAL41M3S
 
Circular dichroism & Ord
Circular dichroism & Ord Circular dichroism & Ord
Circular dichroism & Ord
Lovnish Thakur
 
Ir spectroscopy
Ir spectroscopyIr spectroscopy
Ir spectroscopy
JaydevVadachhak
 
2.ir jntu pharmacy
2.ir jntu pharmacy2.ir jntu pharmacy
2.ir jntu pharmacy
Dr. Suman Pattanayak
 
JASCO-CD-Webinar-Part-1-FINAL.pptx
JASCO-CD-Webinar-Part-1-FINAL.pptxJASCO-CD-Webinar-Part-1-FINAL.pptx
JASCO-CD-Webinar-Part-1-FINAL.pptx
NIBGE-College
 
Optical rotatory dispersion and circular dichroism
Optical rotatory dispersion and circular dichroismOptical rotatory dispersion and circular dichroism
Optical rotatory dispersion and circular dichroism
arimilli haritha
 
Determination of secondary structure of proteins
Determination of secondary structure of proteinsDetermination of secondary structure of proteins
Determination of secondary structure of proteins
Bahauddin zakariya university,Multan
 
INFRARED SPECTROSCOPY
INFRARED SPECTROSCOPYINFRARED SPECTROSCOPY
INFRARED SPECTROSCOPY
Nur Fatihah
 
Chapter 16 - Infrared Spectroscopy. Overview of infrared spectroscopy
Chapter 16 - Infrared Spectroscopy. Overview of infrared spectroscopyChapter 16 - Infrared Spectroscopy. Overview of infrared spectroscopy
Chapter 16 - Infrared Spectroscopy. Overview of infrared spectroscopy
sanjayduttainbox
 
5. cd and ord jntu pharmacy
5. cd and ord jntu pharmacy5. cd and ord jntu pharmacy
5. cd and ord jntu pharmacy
Dr. Suman Pattanayak
 
INFRARED SPECTROSCOPY to find the functional group
INFRARED SPECTROSCOPY to find the functional groupINFRARED SPECTROSCOPY to find the functional group
INFRARED SPECTROSCOPY to find the functional group
ssusera34ec2
 
Instrumental and Modern methods.ppt
Instrumental and Modern methods.pptInstrumental and Modern methods.ppt
Instrumental and Modern methods.ppt
BlackStunnerjunior
 
Chemiluminescence
ChemiluminescenceChemiluminescence
Chemiluminescence
vedshree raole
 
Uvspectroscopyup 140119003106-phpapp01
Uvspectroscopyup 140119003106-phpapp01Uvspectroscopyup 140119003106-phpapp01
Uvspectroscopyup 140119003106-phpapp01
Shaik Imran
 
Detectors.pptx
Detectors.pptxDetectors.pptx
Detectors.pptx
KhuzaimaHussain
 
Sachin new ftir
Sachin new ftirSachin new ftir

Similar to Circular dichroism spectroscopy seminar ppt (20)

Circular dichroism in Biochemistryppt.ppt
Circular dichroism in Biochemistryppt.pptCircular dichroism in Biochemistryppt.ppt
Circular dichroism in Biochemistryppt.ppt
 
CD Spectroscopy Presentation1.pptx
CD Spectroscopy Presentation1.pptxCD Spectroscopy Presentation1.pptx
CD Spectroscopy Presentation1.pptx
 
M.Sc. Part I 1.3 INFRARED SPECTROPHOTOMETRY PPT.ppsx
M.Sc. Part I  1.3 INFRARED SPECTROPHOTOMETRY PPT.ppsxM.Sc. Part I  1.3 INFRARED SPECTROPHOTOMETRY PPT.ppsx
M.Sc. Part I 1.3 INFRARED SPECTROPHOTOMETRY PPT.ppsx
 
M.Sc. Part I 1.3 INFRARED SPECTROPHOTOMETRY PPT (1).ppsx
M.Sc. Part I  1.3 INFRARED SPECTROPHOTOMETRY PPT (1).ppsxM.Sc. Part I  1.3 INFRARED SPECTROPHOTOMETRY PPT (1).ppsx
M.Sc. Part I 1.3 INFRARED SPECTROPHOTOMETRY PPT (1).ppsx
 
Circular dichroism & Ord
Circular dichroism & Ord Circular dichroism & Ord
Circular dichroism & Ord
 
Ir spectroscopy
Ir spectroscopyIr spectroscopy
Ir spectroscopy
 
2.ir jntu pharmacy
2.ir jntu pharmacy2.ir jntu pharmacy
2.ir jntu pharmacy
 
JASCO-CD-Webinar-Part-1-FINAL.pptx
JASCO-CD-Webinar-Part-1-FINAL.pptxJASCO-CD-Webinar-Part-1-FINAL.pptx
JASCO-CD-Webinar-Part-1-FINAL.pptx
 
Optical rotatory dispersion and circular dichroism
Optical rotatory dispersion and circular dichroismOptical rotatory dispersion and circular dichroism
Optical rotatory dispersion and circular dichroism
 
Determination of secondary structure of proteins
Determination of secondary structure of proteinsDetermination of secondary structure of proteins
Determination of secondary structure of proteins
 
INFRARED SPECTROSCOPY
INFRARED SPECTROSCOPYINFRARED SPECTROSCOPY
INFRARED SPECTROSCOPY
 
Chapter 16 - Infrared Spectroscopy. Overview of infrared spectroscopy
Chapter 16 - Infrared Spectroscopy. Overview of infrared spectroscopyChapter 16 - Infrared Spectroscopy. Overview of infrared spectroscopy
Chapter 16 - Infrared Spectroscopy. Overview of infrared spectroscopy
 
5. cd and ord jntu pharmacy
5. cd and ord jntu pharmacy5. cd and ord jntu pharmacy
5. cd and ord jntu pharmacy
 
INFRARED SPECTROSCOPY to find the functional group
INFRARED SPECTROSCOPY to find the functional groupINFRARED SPECTROSCOPY to find the functional group
INFRARED SPECTROSCOPY to find the functional group
 
Instrumental and Modern methods.ppt
Instrumental and Modern methods.pptInstrumental and Modern methods.ppt
Instrumental and Modern methods.ppt
 
Chemiluminescence
ChemiluminescenceChemiluminescence
Chemiluminescence
 
Uvspectroscopyup 140119003106-phpapp01
Uvspectroscopyup 140119003106-phpapp01Uvspectroscopyup 140119003106-phpapp01
Uvspectroscopyup 140119003106-phpapp01
 
ORD CD AMU notes.pdf
ORD CD  AMU notes.pdfORD CD  AMU notes.pdf
ORD CD AMU notes.pdf
 
Detectors.pptx
Detectors.pptxDetectors.pptx
Detectors.pptx
 
Sachin new ftir
Sachin new ftirSachin new ftir
Sachin new ftir
 

Recently uploaded

Richard's aventures in two entangled wonderlands
Richard's aventures in two entangled wonderlandsRichard's aventures in two entangled wonderlands
Richard's aventures in two entangled wonderlands
Richard Gill
 
Citrus Greening Disease and its Management
Citrus Greening Disease and its ManagementCitrus Greening Disease and its Management
Citrus Greening Disease and its Management
subedisuryaofficial
 
platelets_clotting_biogenesis.clot retractionpptx
platelets_clotting_biogenesis.clot retractionpptxplatelets_clotting_biogenesis.clot retractionpptx
platelets_clotting_biogenesis.clot retractionpptx
muralinath2
 
role of pramana in research.pptx in science
role of pramana in research.pptx in sciencerole of pramana in research.pptx in science
role of pramana in research.pptx in science
sonaliswain16
 
Unveiling the Energy Potential of Marshmallow Deposits.pdf
Unveiling the Energy Potential of Marshmallow Deposits.pdfUnveiling the Energy Potential of Marshmallow Deposits.pdf
Unveiling the Energy Potential of Marshmallow Deposits.pdf
Erdal Coalmaker
 
extra-chromosomal-inheritance[1].pptx.pdfpdf
extra-chromosomal-inheritance[1].pptx.pdfpdfextra-chromosomal-inheritance[1].pptx.pdfpdf
extra-chromosomal-inheritance[1].pptx.pdfpdf
DiyaBiswas10
 
Body fluids_tonicity_dehydration_hypovolemia_hypervolemia.pptx
Body fluids_tonicity_dehydration_hypovolemia_hypervolemia.pptxBody fluids_tonicity_dehydration_hypovolemia_hypervolemia.pptx
Body fluids_tonicity_dehydration_hypovolemia_hypervolemia.pptx
muralinath2
 
THE IMPORTANCE OF MARTIAN ATMOSPHERE SAMPLE RETURN.
THE IMPORTANCE OF MARTIAN ATMOSPHERE SAMPLE RETURN.THE IMPORTANCE OF MARTIAN ATMOSPHERE SAMPLE RETURN.
THE IMPORTANCE OF MARTIAN ATMOSPHERE SAMPLE RETURN.
Sérgio Sacani
 
Cancer cell metabolism: special Reference to Lactate Pathway
Cancer cell metabolism: special Reference to Lactate PathwayCancer cell metabolism: special Reference to Lactate Pathway
Cancer cell metabolism: special Reference to Lactate Pathway
AADYARAJPANDEY1
 
(May 29th, 2024) Advancements in Intravital Microscopy- Insights for Preclini...
(May 29th, 2024) Advancements in Intravital Microscopy- Insights for Preclini...(May 29th, 2024) Advancements in Intravital Microscopy- Insights for Preclini...
(May 29th, 2024) Advancements in Intravital Microscopy- Insights for Preclini...
Scintica Instrumentation
 
erythropoiesis-I_mechanism& clinical significance.pptx
erythropoiesis-I_mechanism& clinical significance.pptxerythropoiesis-I_mechanism& clinical significance.pptx
erythropoiesis-I_mechanism& clinical significance.pptx
muralinath2
 
Orion Air Quality Monitoring Systems - CWS
Orion Air Quality Monitoring Systems - CWSOrion Air Quality Monitoring Systems - CWS
Orion Air Quality Monitoring Systems - CWS
Columbia Weather Systems
 
Hemoglobin metabolism_pathophysiology.pptx
Hemoglobin metabolism_pathophysiology.pptxHemoglobin metabolism_pathophysiology.pptx
Hemoglobin metabolism_pathophysiology.pptx
muralinath2
 
general properties of oerganologametal.ppt
general properties of oerganologametal.pptgeneral properties of oerganologametal.ppt
general properties of oerganologametal.ppt
IqrimaNabilatulhusni
 
Seminar of U.V. Spectroscopy by SAMIR PANDA
 Seminar of U.V. Spectroscopy by SAMIR PANDA Seminar of U.V. Spectroscopy by SAMIR PANDA
Seminar of U.V. Spectroscopy by SAMIR PANDA
SAMIR PANDA
 
Nutraceutical market, scope and growth: Herbal drug technology
Nutraceutical market, scope and growth: Herbal drug technologyNutraceutical market, scope and growth: Herbal drug technology
Nutraceutical market, scope and growth: Herbal drug technology
Lokesh Patil
 
GBSN - Microbiology (Lab 4) Culture Media
GBSN - Microbiology (Lab 4) Culture MediaGBSN - Microbiology (Lab 4) Culture Media
GBSN - Microbiology (Lab 4) Culture Media
Areesha Ahmad
 
Lateral Ventricles.pdf very easy good diagrams comprehensive
Lateral Ventricles.pdf very easy good diagrams comprehensiveLateral Ventricles.pdf very easy good diagrams comprehensive
Lateral Ventricles.pdf very easy good diagrams comprehensive
silvermistyshot
 
Earliest Galaxies in the JADES Origins Field: Luminosity Function and Cosmic ...
Earliest Galaxies in the JADES Origins Field: Luminosity Function and Cosmic ...Earliest Galaxies in the JADES Origins Field: Luminosity Function and Cosmic ...
Earliest Galaxies in the JADES Origins Field: Luminosity Function and Cosmic ...
Sérgio Sacani
 
SCHIZOPHRENIA Disorder/ Brain Disorder.pdf
SCHIZOPHRENIA Disorder/ Brain Disorder.pdfSCHIZOPHRENIA Disorder/ Brain Disorder.pdf
SCHIZOPHRENIA Disorder/ Brain Disorder.pdf
SELF-EXPLANATORY
 

Recently uploaded (20)

Richard's aventures in two entangled wonderlands
Richard's aventures in two entangled wonderlandsRichard's aventures in two entangled wonderlands
Richard's aventures in two entangled wonderlands
 
Citrus Greening Disease and its Management
Citrus Greening Disease and its ManagementCitrus Greening Disease and its Management
Citrus Greening Disease and its Management
 
platelets_clotting_biogenesis.clot retractionpptx
platelets_clotting_biogenesis.clot retractionpptxplatelets_clotting_biogenesis.clot retractionpptx
platelets_clotting_biogenesis.clot retractionpptx
 
role of pramana in research.pptx in science
role of pramana in research.pptx in sciencerole of pramana in research.pptx in science
role of pramana in research.pptx in science
 
Unveiling the Energy Potential of Marshmallow Deposits.pdf
Unveiling the Energy Potential of Marshmallow Deposits.pdfUnveiling the Energy Potential of Marshmallow Deposits.pdf
Unveiling the Energy Potential of Marshmallow Deposits.pdf
 
extra-chromosomal-inheritance[1].pptx.pdfpdf
extra-chromosomal-inheritance[1].pptx.pdfpdfextra-chromosomal-inheritance[1].pptx.pdfpdf
extra-chromosomal-inheritance[1].pptx.pdfpdf
 
Body fluids_tonicity_dehydration_hypovolemia_hypervolemia.pptx
Body fluids_tonicity_dehydration_hypovolemia_hypervolemia.pptxBody fluids_tonicity_dehydration_hypovolemia_hypervolemia.pptx
Body fluids_tonicity_dehydration_hypovolemia_hypervolemia.pptx
 
THE IMPORTANCE OF MARTIAN ATMOSPHERE SAMPLE RETURN.
THE IMPORTANCE OF MARTIAN ATMOSPHERE SAMPLE RETURN.THE IMPORTANCE OF MARTIAN ATMOSPHERE SAMPLE RETURN.
THE IMPORTANCE OF MARTIAN ATMOSPHERE SAMPLE RETURN.
 
Cancer cell metabolism: special Reference to Lactate Pathway
Cancer cell metabolism: special Reference to Lactate PathwayCancer cell metabolism: special Reference to Lactate Pathway
Cancer cell metabolism: special Reference to Lactate Pathway
 
(May 29th, 2024) Advancements in Intravital Microscopy- Insights for Preclini...
(May 29th, 2024) Advancements in Intravital Microscopy- Insights for Preclini...(May 29th, 2024) Advancements in Intravital Microscopy- Insights for Preclini...
(May 29th, 2024) Advancements in Intravital Microscopy- Insights for Preclini...
 
erythropoiesis-I_mechanism& clinical significance.pptx
erythropoiesis-I_mechanism& clinical significance.pptxerythropoiesis-I_mechanism& clinical significance.pptx
erythropoiesis-I_mechanism& clinical significance.pptx
 
Orion Air Quality Monitoring Systems - CWS
Orion Air Quality Monitoring Systems - CWSOrion Air Quality Monitoring Systems - CWS
Orion Air Quality Monitoring Systems - CWS
 
Hemoglobin metabolism_pathophysiology.pptx
Hemoglobin metabolism_pathophysiology.pptxHemoglobin metabolism_pathophysiology.pptx
Hemoglobin metabolism_pathophysiology.pptx
 
general properties of oerganologametal.ppt
general properties of oerganologametal.pptgeneral properties of oerganologametal.ppt
general properties of oerganologametal.ppt
 
Seminar of U.V. Spectroscopy by SAMIR PANDA
 Seminar of U.V. Spectroscopy by SAMIR PANDA Seminar of U.V. Spectroscopy by SAMIR PANDA
Seminar of U.V. Spectroscopy by SAMIR PANDA
 
Nutraceutical market, scope and growth: Herbal drug technology
Nutraceutical market, scope and growth: Herbal drug technologyNutraceutical market, scope and growth: Herbal drug technology
Nutraceutical market, scope and growth: Herbal drug technology
 
GBSN - Microbiology (Lab 4) Culture Media
GBSN - Microbiology (Lab 4) Culture MediaGBSN - Microbiology (Lab 4) Culture Media
GBSN - Microbiology (Lab 4) Culture Media
 
Lateral Ventricles.pdf very easy good diagrams comprehensive
Lateral Ventricles.pdf very easy good diagrams comprehensiveLateral Ventricles.pdf very easy good diagrams comprehensive
Lateral Ventricles.pdf very easy good diagrams comprehensive
 
Earliest Galaxies in the JADES Origins Field: Luminosity Function and Cosmic ...
Earliest Galaxies in the JADES Origins Field: Luminosity Function and Cosmic ...Earliest Galaxies in the JADES Origins Field: Luminosity Function and Cosmic ...
Earliest Galaxies in the JADES Origins Field: Luminosity Function and Cosmic ...
 
SCHIZOPHRENIA Disorder/ Brain Disorder.pdf
SCHIZOPHRENIA Disorder/ Brain Disorder.pdfSCHIZOPHRENIA Disorder/ Brain Disorder.pdf
SCHIZOPHRENIA Disorder/ Brain Disorder.pdf
 

Circular dichroism spectroscopy seminar ppt

  • 1. CIRCULAR DICHROISM SPECTROSCOPY PRESENTED BY: SHRUTIKA S. HODAWDEKAR FIRST YEAR M. PHARM. INDUSTRAL PHARMACY. . 1
  • 2. WHAT IS CIRCULAR DICHROISM?  Circular dichroism is observed when an optically active matter absorbs left and right hand circular polarized slightly differently.  Linearly polarised light is light whose oscillations are confined to a single plane.  All polarised light states can be described as a sum of two linearly polarised states at right angles to each other, usually referenced to the viewer as vertically and horizontally polarised light. Verticallypolarisedlight 2
  • 4. If one of the polarised states is out of phase with the other by a quarter-wave, the resultant will be a helix and is known as circularly polarised light (CPL). The helices can be either right-handed (R-CPL) or left-handed (L-CPL). Left circularly polarised light Right circularly polarised light 4
  • 5.  Circular Dichroism (CD) is measured with a CD spectropolarimeter, which is relatively expensive (~$70k).  The instrument needs to be able to measure accurately in the far UV at wavelengths down to 190-170 nm. In addition, the difference in left and right handed absorbance A(l)- A(r) is very small (usually in the range of 0.0001) , therefore should be sensitive . The CD is a function of wavelength.  When circularly polarized light passes through an absorbing optically active medium, the speeds between right and left polarizations differ (cL ≠ cR) as well as their wavelength (λL ≠ λR) and the extent to which they are absorb (εL ≠ εR). Circular dichroism is the difference εL ≠ εR .  CD spectra for distinct types of secondary structure present in peptides, proteins and nucleic acids are different. The analysis of CD spectra can therefore yield valuable information about secondary structure of biological macromolecules. 5
  • 6. CD Instrumentation  So we needmost of the same things as for a UV/visible:  Lamp -Xe or Xe/Hg .  Monochromator.  Polarizer.  Photo-elastic modulator.  Sample compartment.  Detector (photomultiplier). 6
  • 7. Block diagram of CD spectropolarimeter. 7
  • 8.  The Chirascan™ monochromator uses two synthetic, single‐crystal quartz prisms instead of the diffraction gratings that most people are familiar with from normal absorbance spectrophotometers.  Quartz prisms are more efficient than diffraction gratings for a very wide range of wavelengths, particularly in the UV.  Quartz is also birefringent and the prisms not only disperse light into the component wavelengths but also, because of their birefringence, disperse the linearly polarised components, one of which is selected for conversion to circularly polarised light.  A further advantage of prisms is they do not pass second‐order multiples of the desired wavelength, which is a major source of stray‐light in grating‐based monochromators. 8
  • 9. Photo-elastic modulator:  This is a piezoelectric element cemented to a block of fused silica.  At rest, when the piezoelectric element is not oscillating, the silica block is not birefringent . when driven, the piezoelectric element oscillates at its resonance frequency (typically around 50 kHz), and induces stress in the silica in such a way that it becomes birefringent.  The alternating stress turns the fused silica element into a dynamic quarter‐wave plate, retarding first vertical with respect to horizontal components of the incident linearly polarised light by a quarter‐wave and then vice versa, producing left‐ and then right‐ circularly polarised light at the drive frequency.  The amplitude of the oscillation is tuned so that the retardation is appropriate for the wavelength of light passing through the silica block. 9
  • 11. Operation of CD spectrometer. 11 A CD active sample will absorb either L-CPL or R-CPL preferentially Consequently there is only a steady output from the light detector. With no CD active sample, the L-CPL and R-CPL have equal light intensities. The photo elastic modulator converts the linearly polarised beam into left and right circularly polarised light altering at 50 KHz. The monochromator outputs linearly polarised light of a single wavelength(monochromatic).
  • 12. 12 Plot of CD signal Vs. wavelength of light gives the CD spectrum. The vAC signal is divided by vDC signal. The siganl is multiplied by a calibration factor (G) to give units of milidegrees or absorbance. The average of the light intensity over time is measured and is termed as vDC. This can be used to scale the changes in CD measured by vAC signal. Difference in the intensity of L-CPL and R-CPL components is measured by amplifier tuned to the PEM frequency. The result of the unequal amount of L-CPL and R-CPL reaching the detector , is a signal that varies with the frequency of the PEM (50 KHz).
  • 13. Sample preparation  Additives, buffers and stabilizing compounds: Any compound which absorbs in the region of interest (250 - 190 nm) should be avoided.  A buffer or detergent or other chemical should not be used unless it can be shown that the compound in question will not mask the protein signal.  Protein solution: From the above follows that the protein solution should contain only those chemicals necessary to maintain protein stability, and at the lowest concentrations possible. Avoid any chemical that is unnecessary for protein stability/solubility. The protein itself should be as pure as possible, any additional protein or peptide will contribute to the CD signal. 13
  • 14.  Contaminants: Unfolded protein, peptides, particulate matter (scattering particles), anything that adds significant noise (or artificial signal contributions) to the CD spectrum must be avoided. Filtering of the solutions (0.02 um syringe filters) may improve signal to noise ratio.  Nitrogen purging: the function of purging the CD instrument with nitrogen is to remove oxygen from the lamp housing, monochromator, and the sample chamber. The reason for removing oxygen is that oxygen absorbs deep UV light, thus reducing the light available for the measurement. 14
  • 15. Typical Conditions for CD • Protein Concentration: 0.25 mg/ml • Cell Path Length: 1 mm • Volume 400 μl • Need very little sample 0.1 mg • Concentration reasonable • Stabilizers (Metal ions, etc.): minimum • Buffer Concentration : 5 mM or as low as possible while maintaining protein stability • A structural biology method that can give real answers in a day 15
  • 16. 16
  • 17. ADVANTAGES  Simple and quick experiment.  No extensive preparation..  Relatively low concentrations/amounts of sample.  Microsecond time resolution.  Any size of macromolecule. DISADVANTAGES  Difficult to quantitate similarity or differences.  Certain buffer components absorb strongly in Far-UV & can cause interference. 17
  • 18. Applications CD spectroscopy has wide range of applications in many different fields.  UV CD – to investigate the secondary structure of proteins that cannot be crystallized.  UV/ VIS CD – to investigate charge-transfer transitions.  Near IR CD – to investigate geometric and electronic structure by probing metal transitions.  Investigation of the effect of drug binding on protein secondary structure.  Studies of the effects of environment on protein structure.  Study of ligand -induced conformational changes. 18
  • 19. References  Applications of Circular Dichroism, International Journal of Molecular Sciences ISSN 1422- 0067.  www.mdpi.com/journal/ijms - visited on 22/11/2014.  Understanding Circular Dichroism , Applied Photo physics Ltd- www.photophysics.com - 22/11/2014.  Protein Secondary Structure and Circular Dichroism : A Practical Guide, W.C.Johnson, PROTEINS 7, 205-214 (1990).  Circular Dichroism and Optical Rotary Dispersion of Proteins and Polypeptides, A.J.Alder, N.J.Greenfield and G.D.Fasman, Meth. Enzymology 27, 675 (1973).  www.wikipedia.com – 24/11/2014. 19
  • 20. 20