Downloaded 79 times

![GOVERNMENT COMPARISON
GOVERNMENT OF CHINA
EXECUTIVELEGISLATIVE JUDICIARY
State Council
Functional Center of State
power
Headed by premier
NPC Standing
Committee
Headed by Chairman
160 members
National Peoples
Congress(NPC) Body
3000 delegates
Forum of debeting ideas
within the CPC/govt
Chief of State:
President
Vice President
Head of Government:
Primier
Executive Vice
Premier
Supreme People's
Court
Higher People's Courts
Intermediate People's
Courts
District and County
People's Courts
Political Parties:
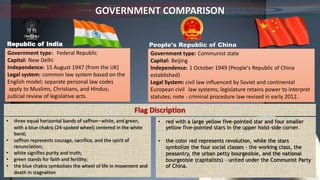
India- India has dozens of national and regional political parties. E.g. Bharatiya Janata Party or BJP,
Indian National Congress or INC, Aam Aadmi Party or AAP
China-Chinese Communist Party or CCP [XI Jinping] and eight nominally independent small parties
ultimately controlled by the CCP.](https://image.slidesharecdn.com/finalpresentation-160529205945/85/Country-Comparison-Between-India-and-China-12-320.jpg)
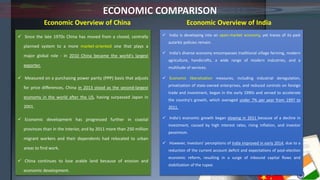
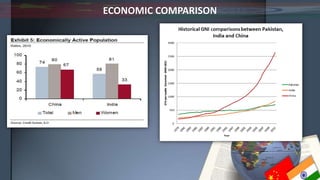
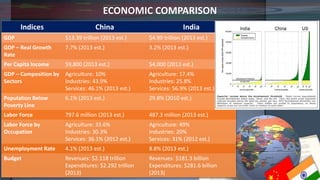
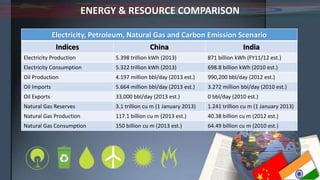


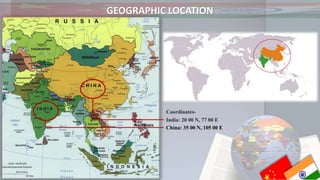
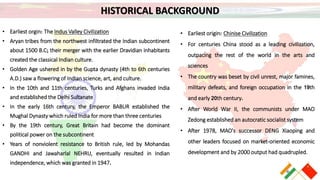
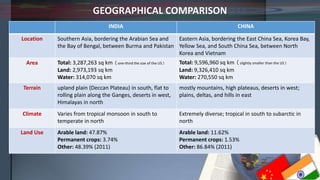
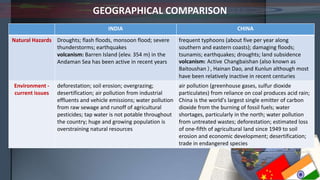
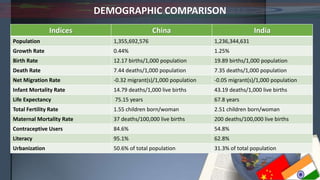
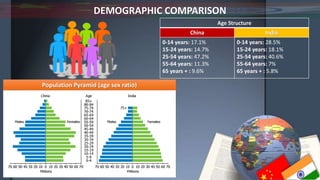
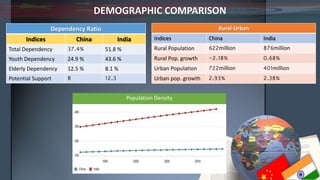
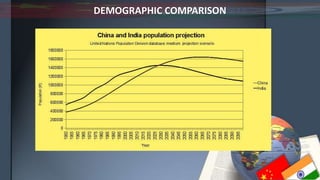
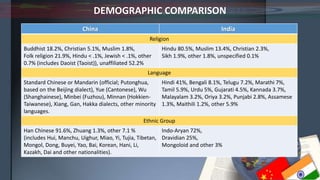
This document compares India and China across several categories including geography, history, demographics, government, economy, military, and energy resources. Some key points of comparison are: - Geographically, China is larger than India and more mountainous while India has more coastline. - Historically, both countries have ancient civilizations but China was impacted by foreign rule and civil unrest in the 19th-20th centuries while India gained independence from Britain in 1947. - Demographically, China has an aging population while India's is younger with a higher birth rate. China also has a lower fertility rate and higher life expectancy. - Economically, China has a larger GDP and faster growth rate than India though India's


