(MEERA) Dapodi Call Girls Just Call 7001035870 [ Cash on Delivery ] Pune Escorts
frequency_analysis_2.pdf Engineering hydro
1. Ocean
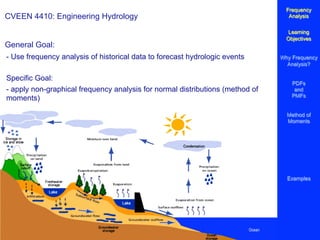
CVEEN 4410: Engineering Hydrology
General Goal:
Frequency
Analysis
Learning
Objectives
Why Frequency
Analysis?
PDFs
and
PMFs
Method of
Moments
Examples
- Use frequency analysis of historical data to forecast hydrologic events
Specific Goal:
- apply non-graphical frequency analysis for normal distributions (method of
moments)
2. 2
Frequency Analysis II CVEEN 4410 Engineering Hydrology
Why Frequency Analysis?
Example: Folsom Dam
• The dam is 340 feet high and 1,400 feet
long.
• There is enough concrete in the dam to
build a sidewalk (4 inches thick by 3
feet wide) from San Francisco to New
York.
• The dam weighs 2,343,000 tons but it is
40% hollow inside.
• Folsom Dam is located about 23 miles
northeast of Sacramento.
Frequency
Analysis
Learning
Objectives
Why Frequency
Analysis?
PDFs
and
PMFs
Method of
Moments
Examples
Yesterday I was asked “how important is frequency analysis?”
3. 3
Frequency Analysis II CVEEN 4410 Engineering Hydrology
• In 1955, during the construction
phase and in 1964 and 1986,
Folsom Dam saved the
Sacramento area from major
flooding when torrential rain and
heavy snows fell in the Sierra
Nevada/American River Basin.
• Up to February 1986, the
estimated flood savings totaled
$438 million. In February 1986,
Folsom Dam prevented an
estimated $4.7 billion in flood
damages.
Why Frequency Analysis?
Frequency
Analysis
Learning
Objectives
Why Frequency
Analysis?
PDFs
and
PMFs
Method of
Moments
Examples
4. 4
Frequency Analysis II CVEEN 4410 Engineering Hydrology
Observed hydrologic events = random sample
(observed set of events)
→ used to make inferences about the true
population (all possible events)
Why Frequency Analysis?
Frequency
Analysis
Learning
Objectives
Why Frequency
Analysis?
PDFs
and
PMFs
Method of
Moments
Examples
5. 5
Frequency Analysis II CVEEN 4410 Engineering Hydrology
Frequency analysis is an information
problem: if one had a sufficiently
long record of flood flows, rainfall,
or low flows, then a frequency
distribution for a site could be
precisely determined.
We have to assume that no change
(e.g. urbanization, climate change)
occurs within the period of record.
In most situations, available data
sets are insufficiently long to
define the risk of extreme events.
Why Frequency Analysis?
Frequency
Analysis
Learning
Objectives
Why Frequency
Analysis?
PDFs
and
PMFs
Method of
Moments
Examples
6. 6
Frequency Analysis II CVEEN 4410 Engineering Hydrology
PDFs (and PMF, the discrete equivalent):
Frequency
Analysis
Learning
Objectives
Why Frequency
Analysis?
PDFs
and
PMFs
Method of
Moments
Examples
See Spreadsheet Freq_Analy_1.xls
Review:
7. 7
Frequency Analysis II CVEEN 4410 Engineering Hydrology
1. Assume random variable has a specific probability
distribution (e.g., normal distribution) with population
parameters µ and σ
2. Equate the sample moments to the population
parameters
3. Calculate probabilities or evaluate fit of data to the
assumed probability distribution and analyze that fit
Method of Moments
Frequency
Analysis
Learning
Objectives
Why Frequency
Analysis?
PDFs
and
PMFs
Method of
Moments
Examples
Review:
8. 14
Frequency Analysis I CVEEN 4410 Engineering Hydrology
Review:
The cumulative distribution function, or CDF:
; note that T = 1 / (1 - F)
The CDF represents the probability that a random
variable X takes on a value less than or equal to x. T
is the return period -- an annual maximum event has
a return period of T years if its magnitude is equaled
or exceeded once, on average, every T years. F is
also the NON-EXCEEDANCE PROBABILITY.
Return Period = T =
1
1-(non-exceedance probability)
=
1
exceedance probability
F(x) = P(X ≤ x) = 1 - (1 / T)
Frequency
Analysis
Learning
Objectives
Why Frequency
Analysis?
PDFs
and
PMFs
Method of
Moments
Examples
9. 9
Frequency Analysis II CVEEN 4410 Engineering Hydrology
Review:
The frequency factor:
Where the variables in the numerator are the random
variable and its mean, respectively, and Sx is the
standard deviation
K =
x − x
Sx
Frequency
Analysis
Learning
Objectives
Why Frequency
Analysis?
PDFs
and
PMFs
Method of
Moments
Examples
10. 18
Frequency Analysis I CVEEN 4410 Engineering Hydrology
Typical Questions that Frequency Analysis Can Answer
Frequency
Analysis
Learning
Objectives
Why Frequency
Analysis?
PDFs
and
PMFs
Method of
Moments
Examples
(1) Find the probability that an event of a specific size will not
occur within a specified time period. This would be the non-
exceedance probability. (FIND F) Local regulations may specify
that you not exceed a certain threshold of runoff (flood size)
within a 50-year time period, for example.
(2) Find the magnitude of an event corresponding to a specific
return period. For example, what is size (magnitude) of the
100-year flood? FIND X (MAGNITUDE) FOR A RECURRENCE
INTERVAL T, WHERE T = 1 / (1-F)
11. 18
Frequency Analysis I CVEEN 4410 Engineering Hydrology
“Recipe” for general (non-graphical) Frequency Analysis for data that fit a
normal distribution -- for example, finding non-exceedance probability of a
given event (find F), or find the magnitude of an event corresponding to a
specific return period. (see page 201 of text):
1. Assume random variable has a normal distribution with
population parameters µ and σ
2. Compute the sample moments and S
3. For the normal distribution, the parameters and sample moments
are related by µ = and σ = S;
4. Find either CDF = F(z) = 1 - 1/T from specified return period, or,
use: to find z;
5. Then, use z to find F (non-exceedance probability) using normal
distribution tables (Appendix D);
6. Or use T to find F and then to find z, from normal distribution
tables (Appendix D of text) to calculate magnitude of an event
using:
Frequency
Analysis
Learning
Objectives
Why Frequency
Analysis?
PDFs
and
PMFs
Method of
Moments
Examples
Review:
z = (x − x) / s
x = x + z i s
12. 18
Frequency Analysis I CVEEN 4410 Engineering Hydrology
Frequency
Analysis
Learning
Objectives
Why Frequency
Analysis?
PDFs
and
PMFs
Method of
Moments
Examples
Three in-class exercises for next time:
(1) See Freq_Analy_1.xls spreadsheet on website -- we
will build a PMF diagram and a CDF plot using Excel
based on example 3-1 on page 175 of your text;
(2) For Siletz River discharge data: What is the 100 year flood
magnitude? What is the probability that a flood will be less
than or equal to 30,000 cfs?
(3) Assuming a normal distribution with a mean and
standard deviation of 2400 cfs and 1200 cfs, respectively,
find the exceedance probability (for 1 year) and return
period for a flood magnitude of 3600 cfs .
13. 13
Frequency Analysis II CVEEN 4410 Engineering Hydrology
In-Class Exercise #1: The normal
distribution is fit to the data for
the Siletz River.
• What is the 100 year flood
magnitude?
• What is the probability that a
flood will be less than or equal
to 30,000 cfs?
Frequency
Analysis
Learning
Objectives
Why Frequency
Analysis?
PDFs
and
PMFs
Method of
Moments
Examples
This is example 3-1 on page 202 of your
text; please work through it at home, and
we’ll review this example in class.
14. 14
Frequency Analysis II CVEEN 4410 Engineering Hydrology
For some frequency analysis problems, the approach
is pretty easy; it’s just a matter of finding the
frequency factor, the z factor from the normal CDF
table (handout), and computing desired parameters.
Following on the heels of the 1st example that we
just did, let’s do another non-graphical frequency
analysis:
In-Class Exercise 2 - Assuming a normal distribution
with a mean and standard deviation of 2400 cfs and
1200 cfs, respectively, find the exceedance
probability (for 1 year) and return period for a flood
magnitude of 3600 cfs. In other words, what is the
probability that a flood will NOT exceed 3600 cfs in
a given year? What is the recurrence interval (return
period) for a flood of 3600 cfs?
Frequency
Analysis
Learning
Objectives
Why Frequency
Analysis?
PDFs
and
PMFs
Method of
Moments
Examples
15. 15
Frequency Analysis II CVEEN 4410 Engineering Hydrology
Example 2: Assuming a
normal distribution with
a mean and standard
deviation of 2400 cfs
and 1200 cfs,
respectively, find the
exceedance probability
(for 1 year) and return
period for a flood
magnitude of 3600 cfs .
Hint: use the model
Recall:
• exceedance probability = the
probability that an event having a
specified depth and duration will be
exceeded in one time period, which
is most often assumed to be 1 year.
Unless stated otherwise, assume
that the exceedance probability time
period is 1 year.
K =
x − x
Sx
or
x = x + KSx
Frequency
Analysis
Learning
Objectives
Why Frequency
Analysis?
PDFs
and
PMFs
Method of
Moments
Examples
16. 16
Frequency Analysis II CVEEN 4410 Engineering Hydrology
Example 2: Assuming a
normal distribution with
a mean and standard
deviation of 2400 cfs
and 1200 cfs,
respectively, find the
exceedance probability
(for 1 year) and return
period for a flood
magnitude of 3600 cfs .
Hint: use the model
K =
x − x
Sx
or
x = x + KSx
Additional notes:
• Recall that K reflects the
probability of the occurrence of X,
and depends on the underlying
population. Here, we are assuming
that population possesses a normal
distribution, and that the probability
associated with K is for the
occurrence of X in one year.
• For this problem, note that z in the
handout (Appendix D) = K
Frequency
Analysis
Learning
Objectives
Why Frequency
Analysis?
PDFs
and
PMFs
Method of
Moments
Examples
17. 17
Frequency Analysis II CVEEN 4410 Engineering Hydrology
Example 2: Assuming a
normal distribution with
a mean and standard
deviation of 2400 cfs
and 1200 cfs,
respectively, find the
exceedance probability
(for 1 year) and return
period for a flood
magnitude of 3600 cfs .
Hint: use the model
K =
x − x
Sx
or
x = x + KSx
K =
x − x
S
K =
3600cfs − 2400cfs
1200cfs
= 1
Since we are assuming the normal
distribution we can obtain the frequency
characteristics from the standard norms
Appendix D:
K = z = 1.00
P(X ≤ 3600) = 0.8413
Frequency
Analysis
Learning
Objectives
Why Frequency
Analysis?
PDFs
and
PMFs
Method of
Moments
Examples
18. 18
Frequency Analysis II CVEEN 4410 Engineering Hydrology
Example 2: Assuming a
normal distribution with
a mean and standard
deviation of 2400 cfs
and 1200 cfs,
respectively, find the
exceedance probability
(for 1 year) and return
period for a flood
magnitude of 3600 cfs .
Hint: use the model
K =
x − x
Sx
or
x = x + KSx
P(X ≤ 3600) = 0.8413
Frequency
Analysis
Learning
Objectives
Why Frequency
Analysis?
PDFs
and
PMFs
Method of
Moments
Examples
19. 19
Frequency Analysis II CVEEN 4410 Engineering Hydrology
Example 2: Assuming a
normal distribution with
a mean and standard
deviation of 2400 cfs
and 1200 cfs,
respectively, find the
exceedance probability
(for 1 year) and return
period for a flood
magnitude of 3600 cfs .
K =
x − x
S
K =
3600cfs − 2400cfs
1200cfs
= 1
Since we are assuming the normal
distribution we can obtain the frequency
characteristics from the standard norms
Appendix D:
K = z = 1.00
P(X ≤ 3600) = 0.8413
Exceedance Probability P (X > 3600) = 1 – 0.8413 = 0.1587
Frequency
Analysis
Learning
Objectives
Why Frequency
Analysis?
PDFs
and
PMFs
Method of
Moments
Examples
Return Period ⇒ T =
1
exceedance probability
= 6.3 years