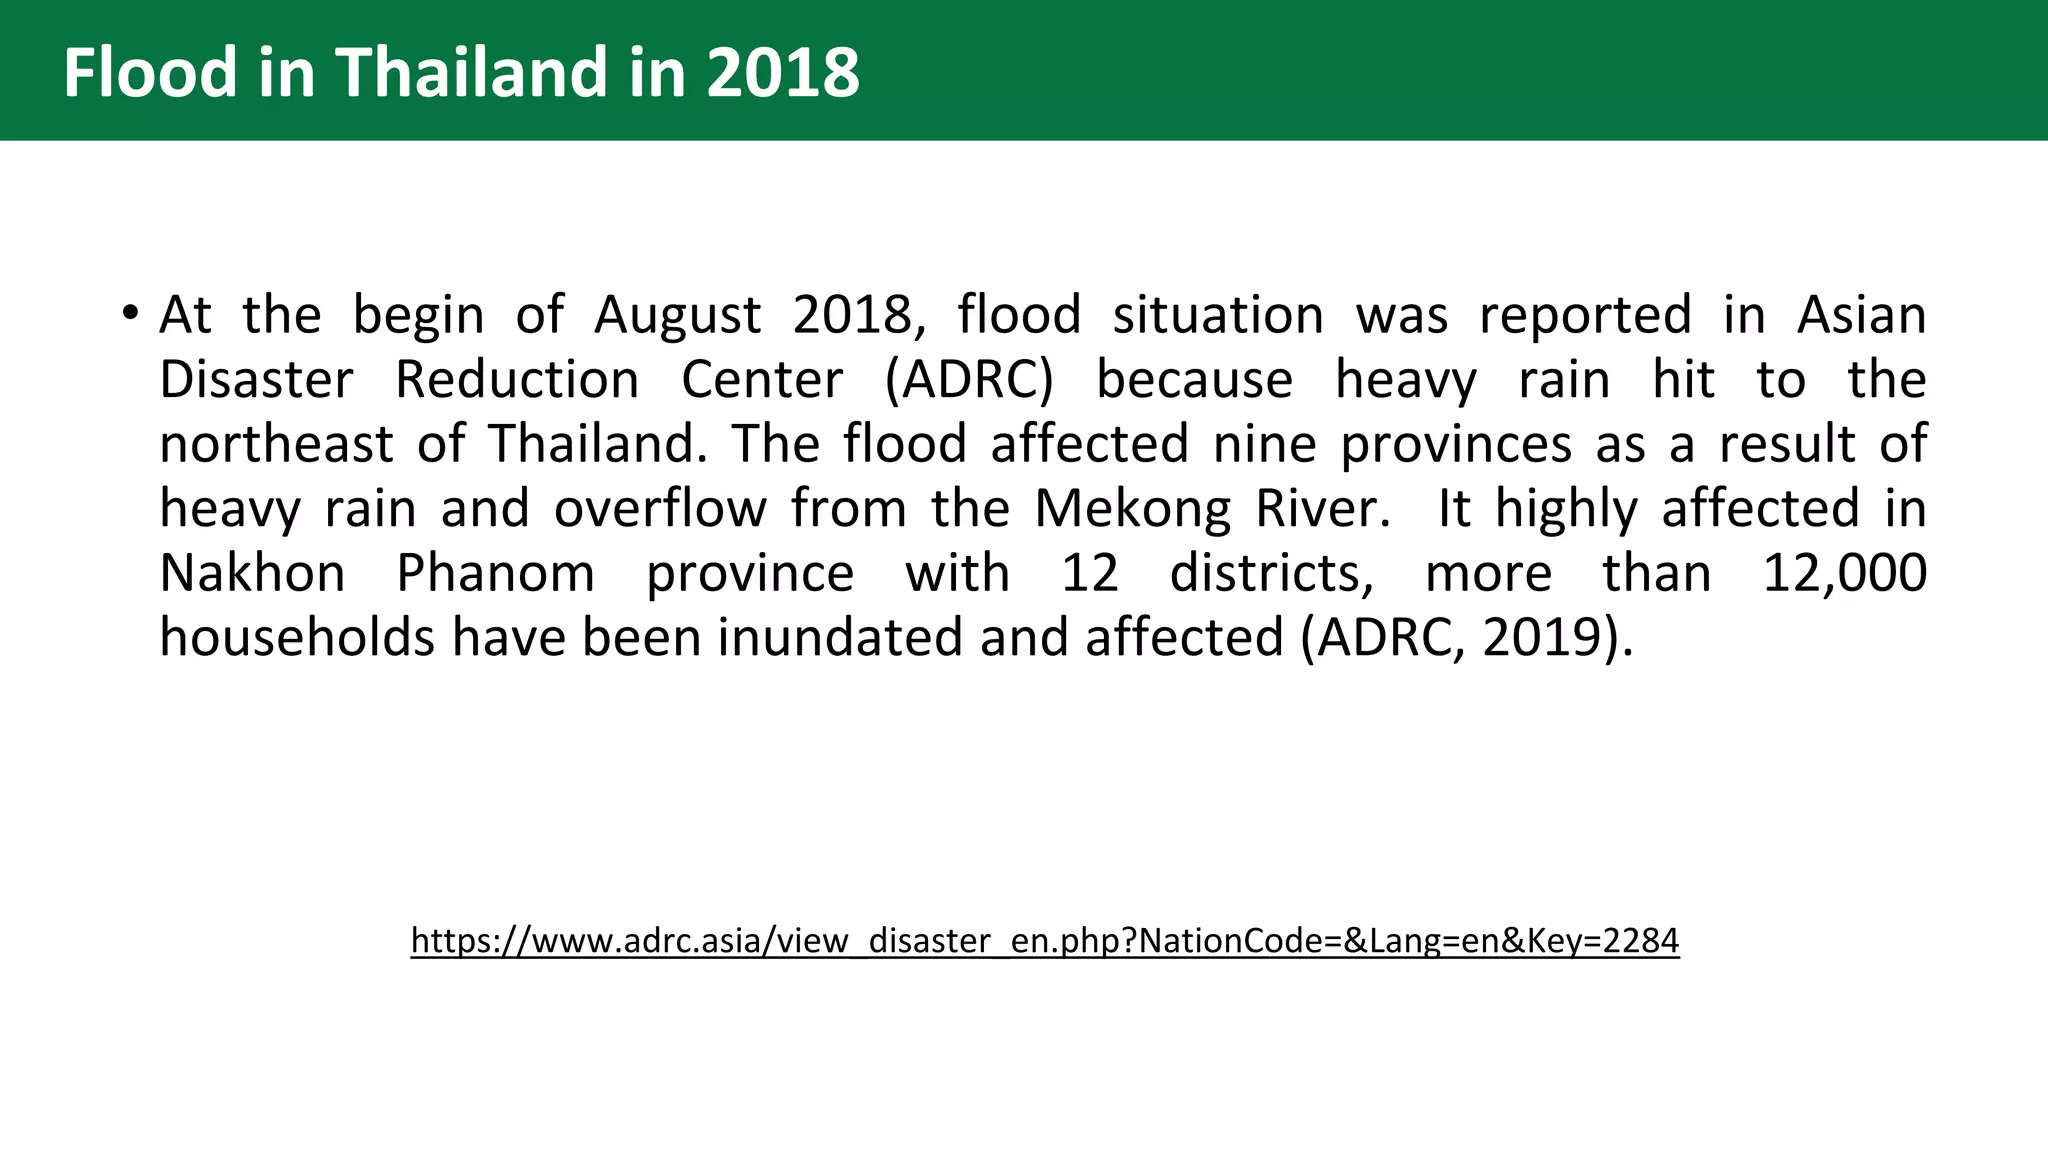
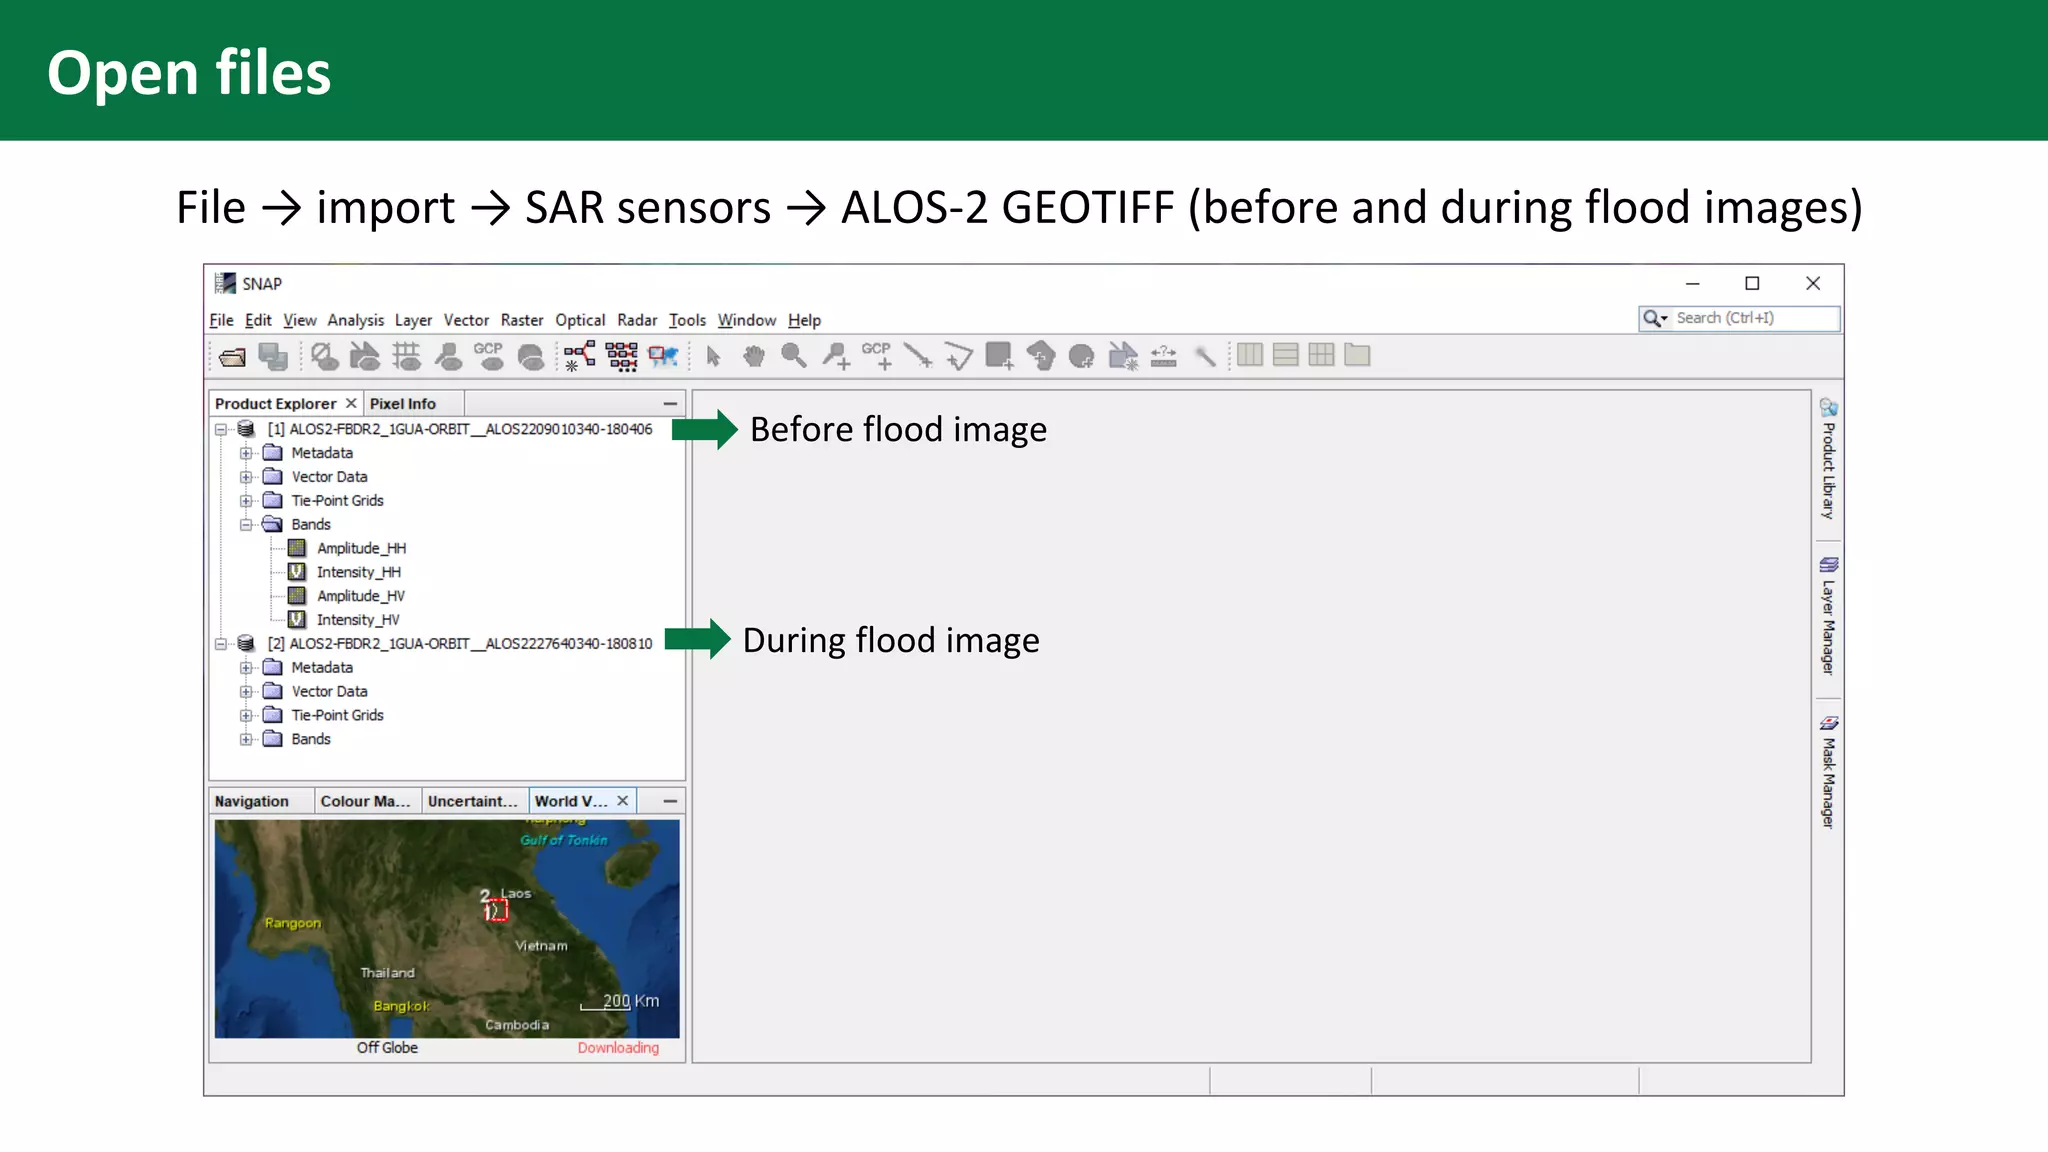
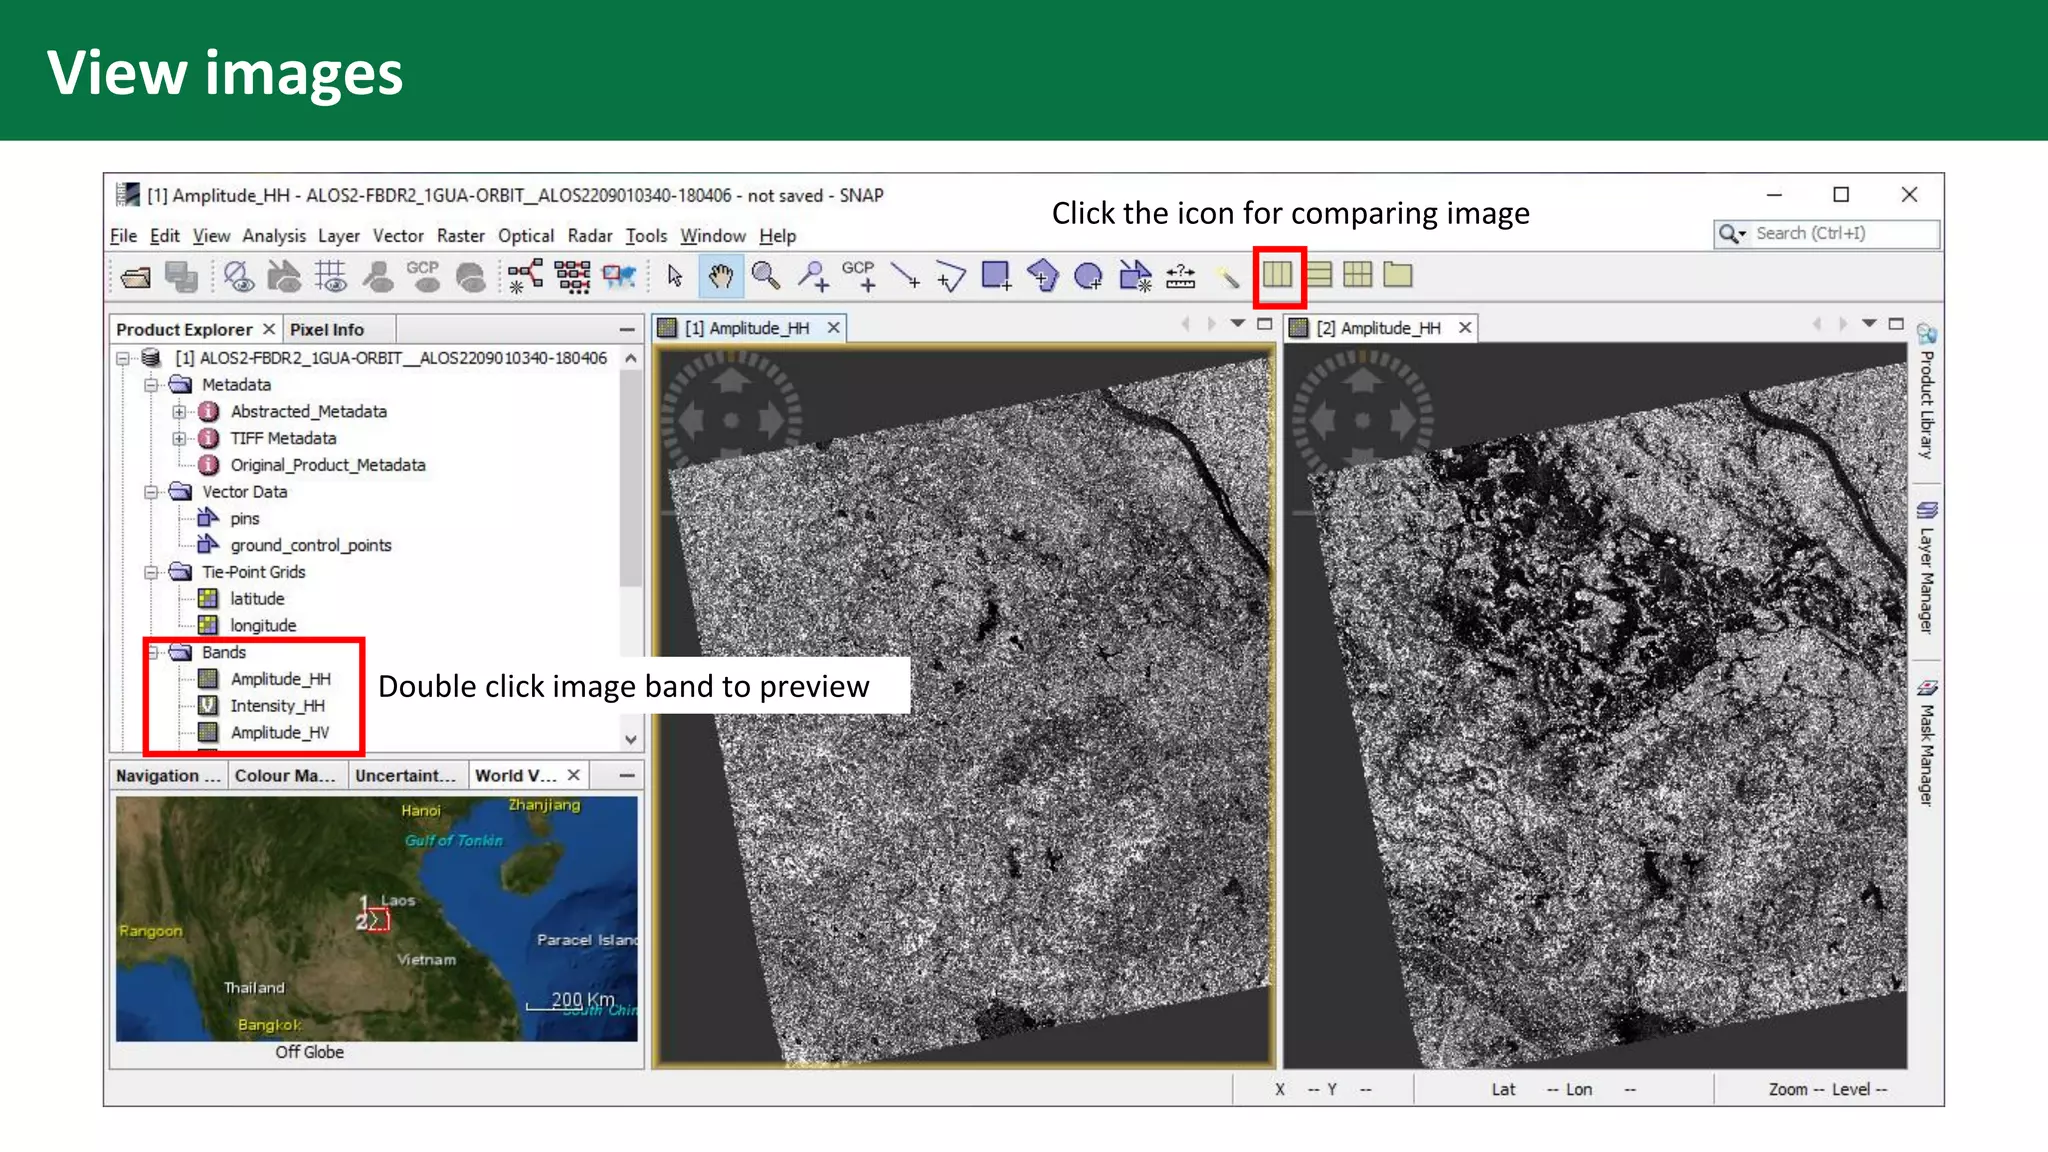
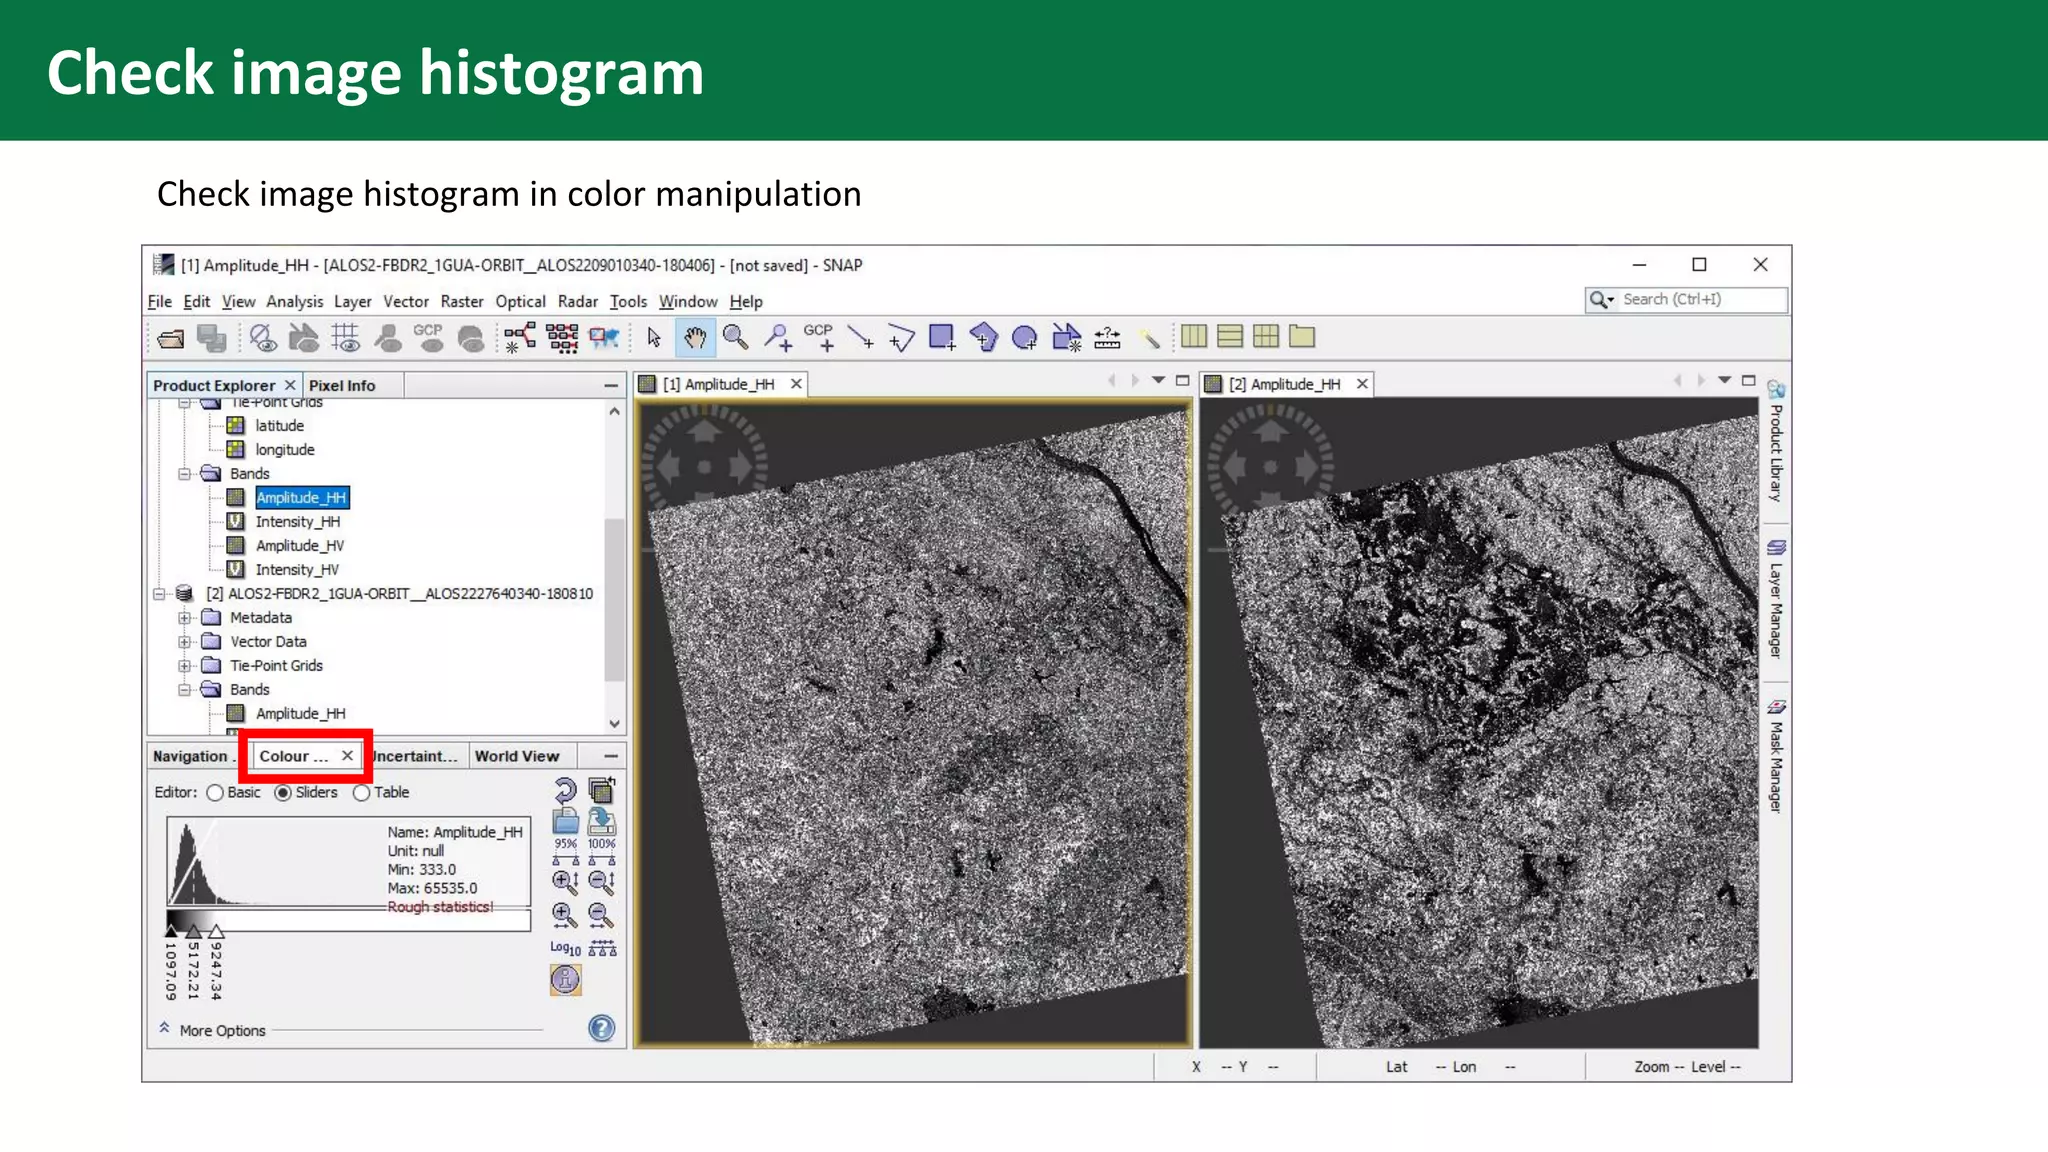
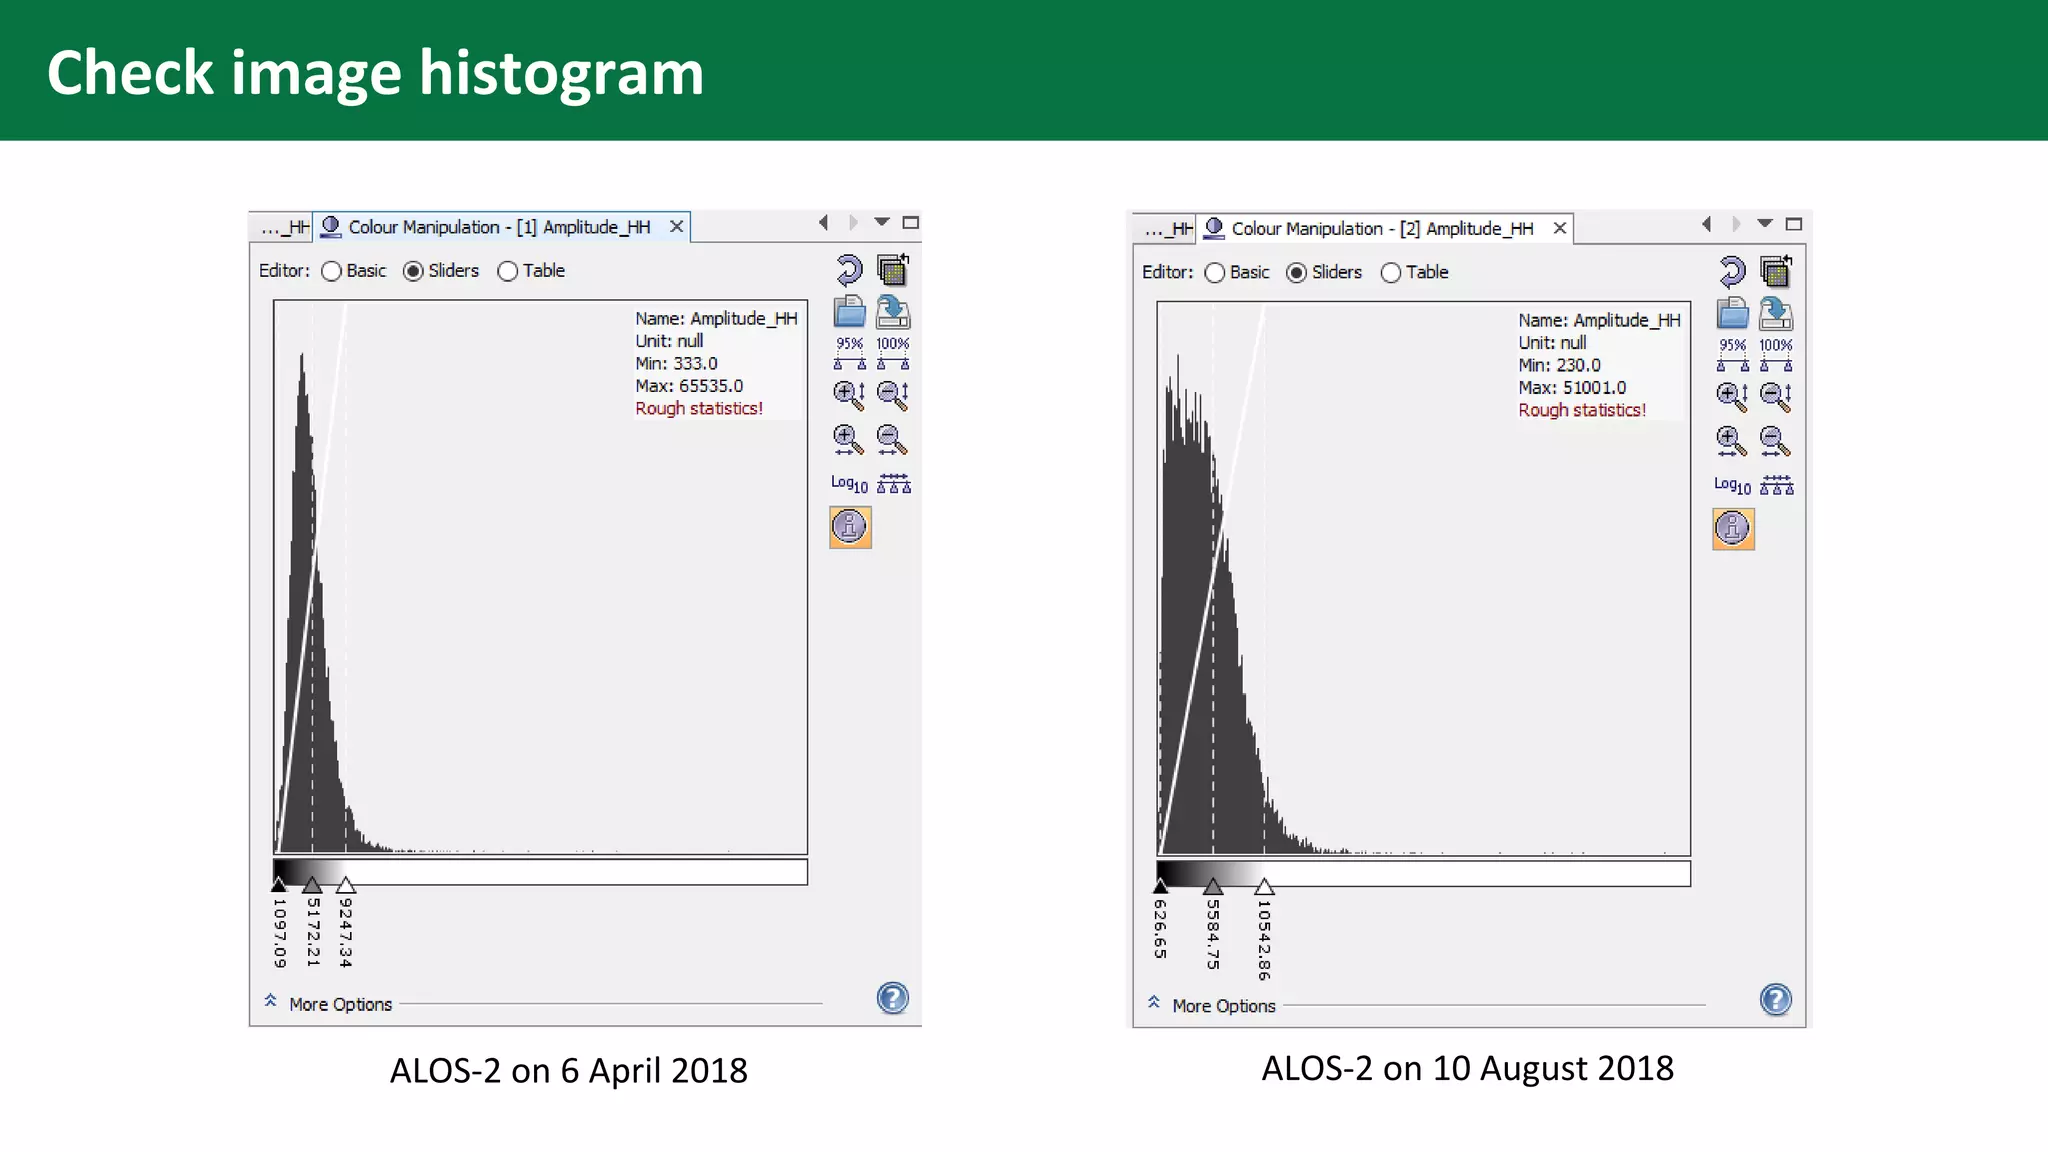
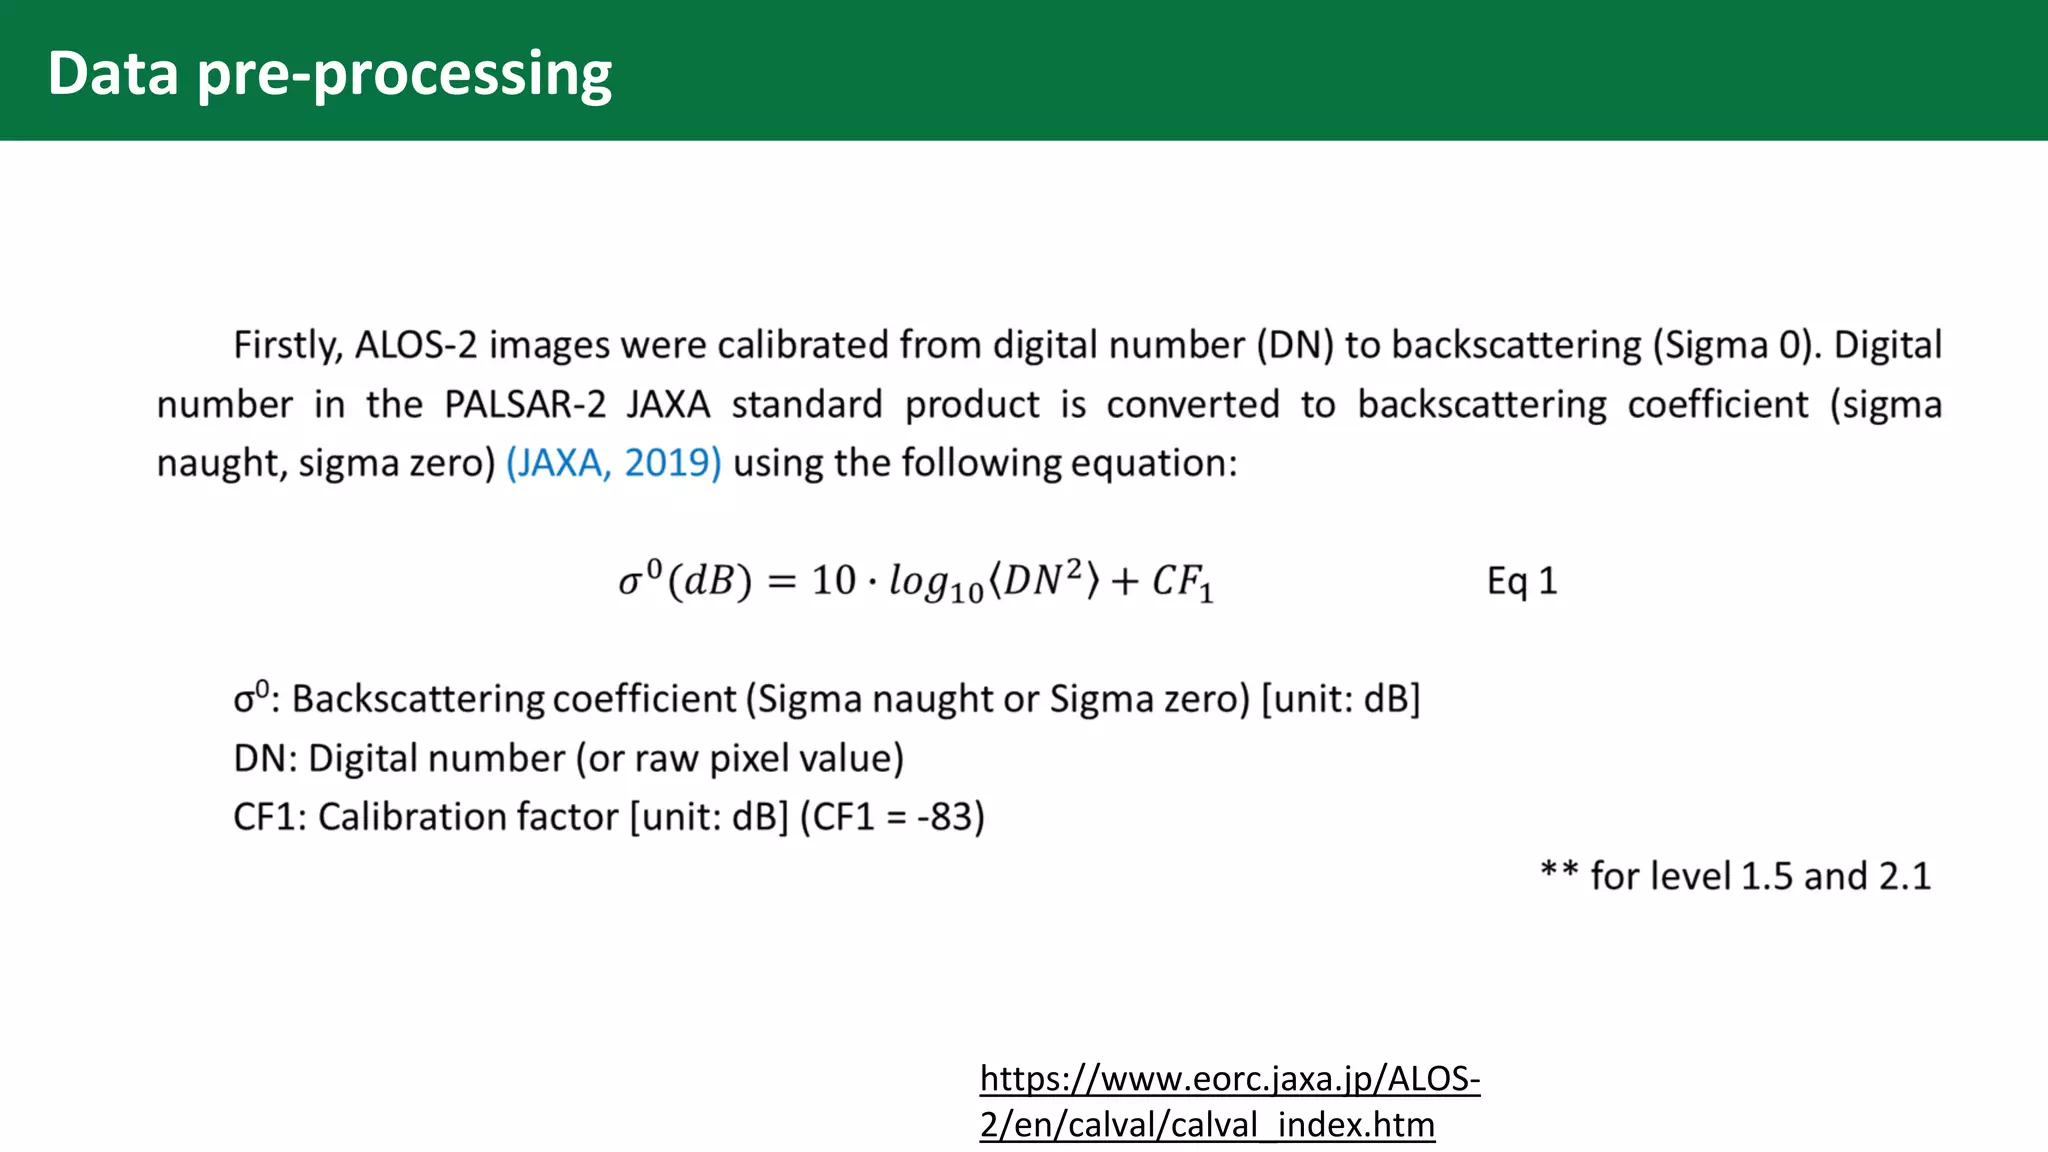
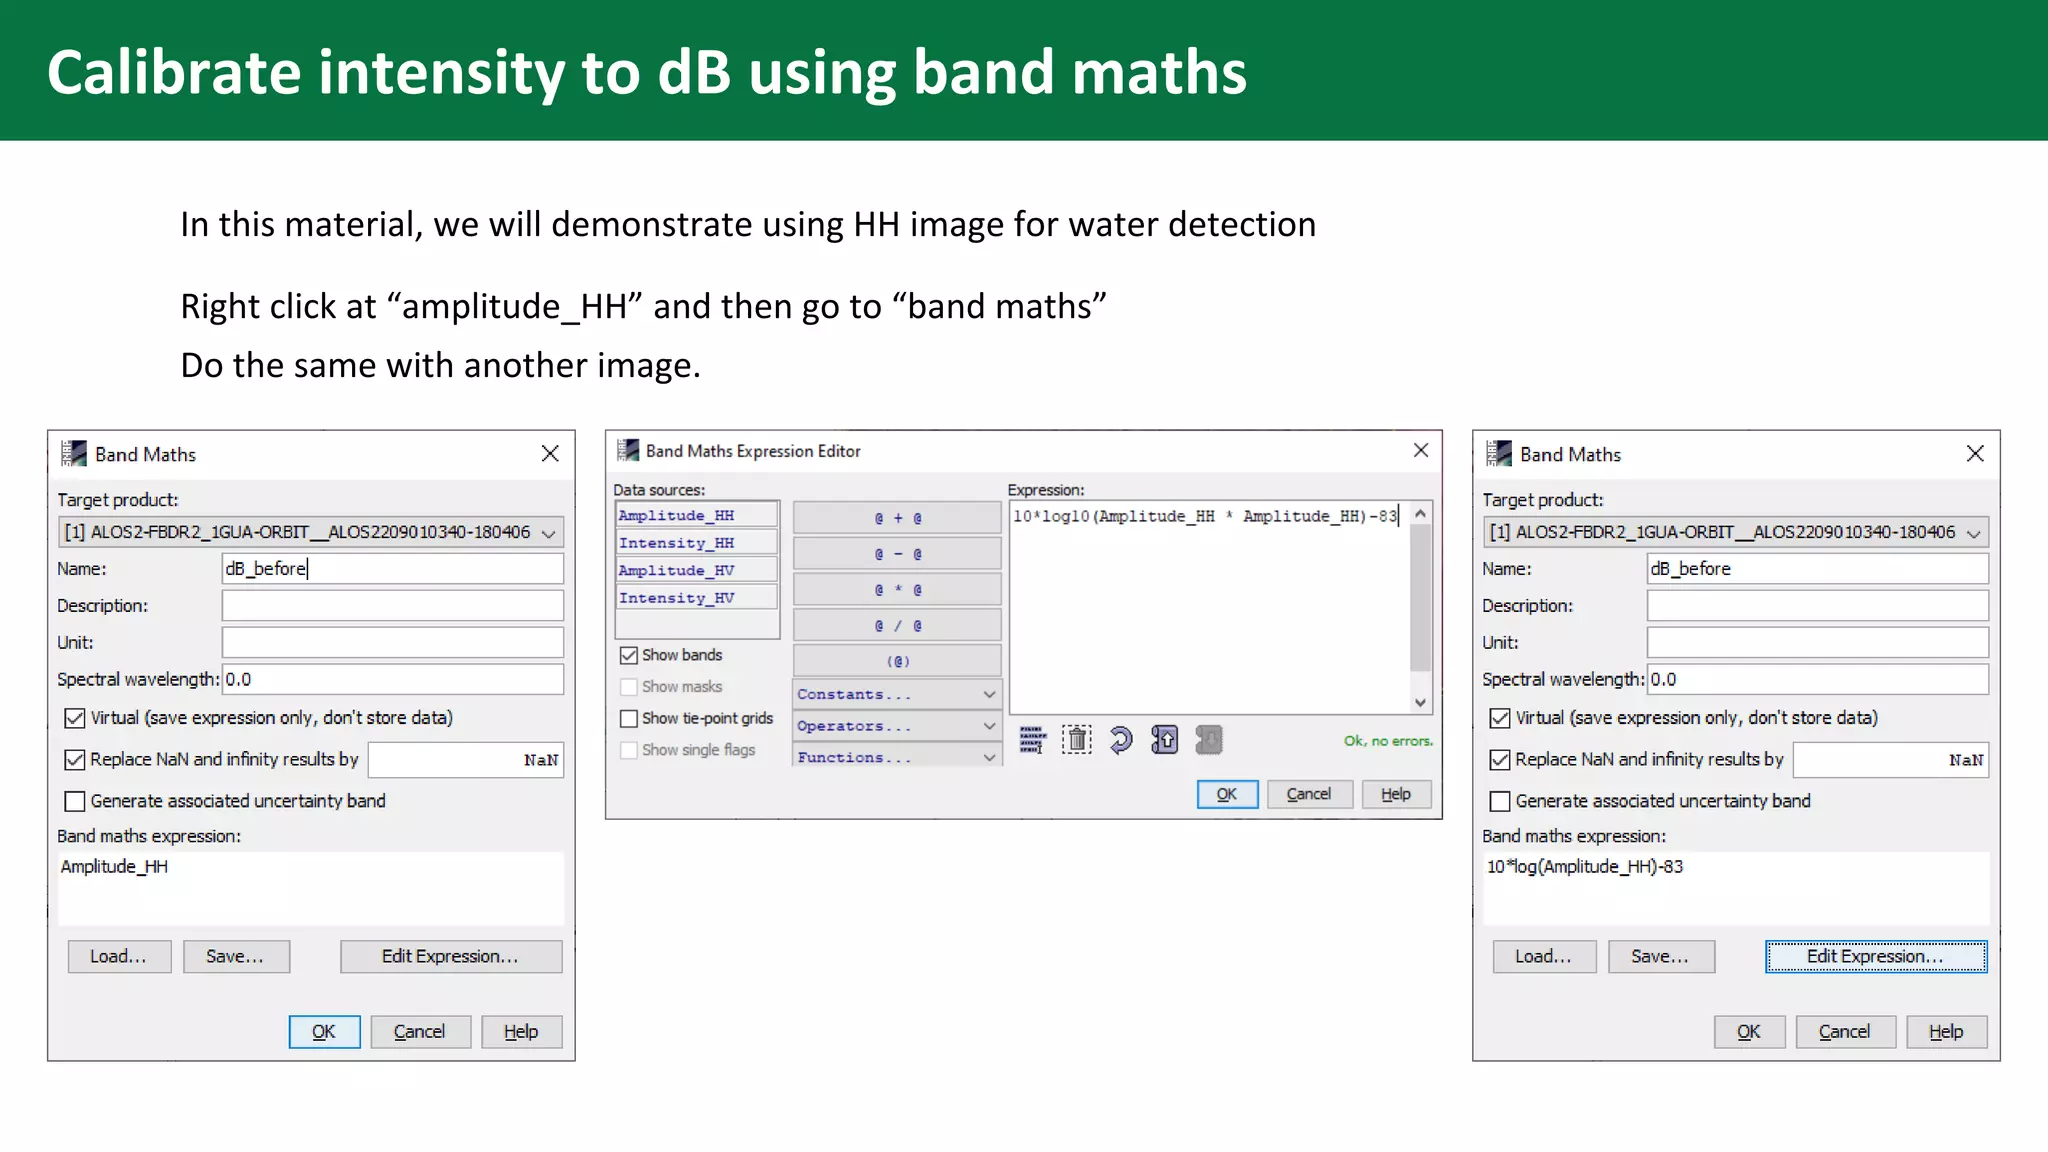
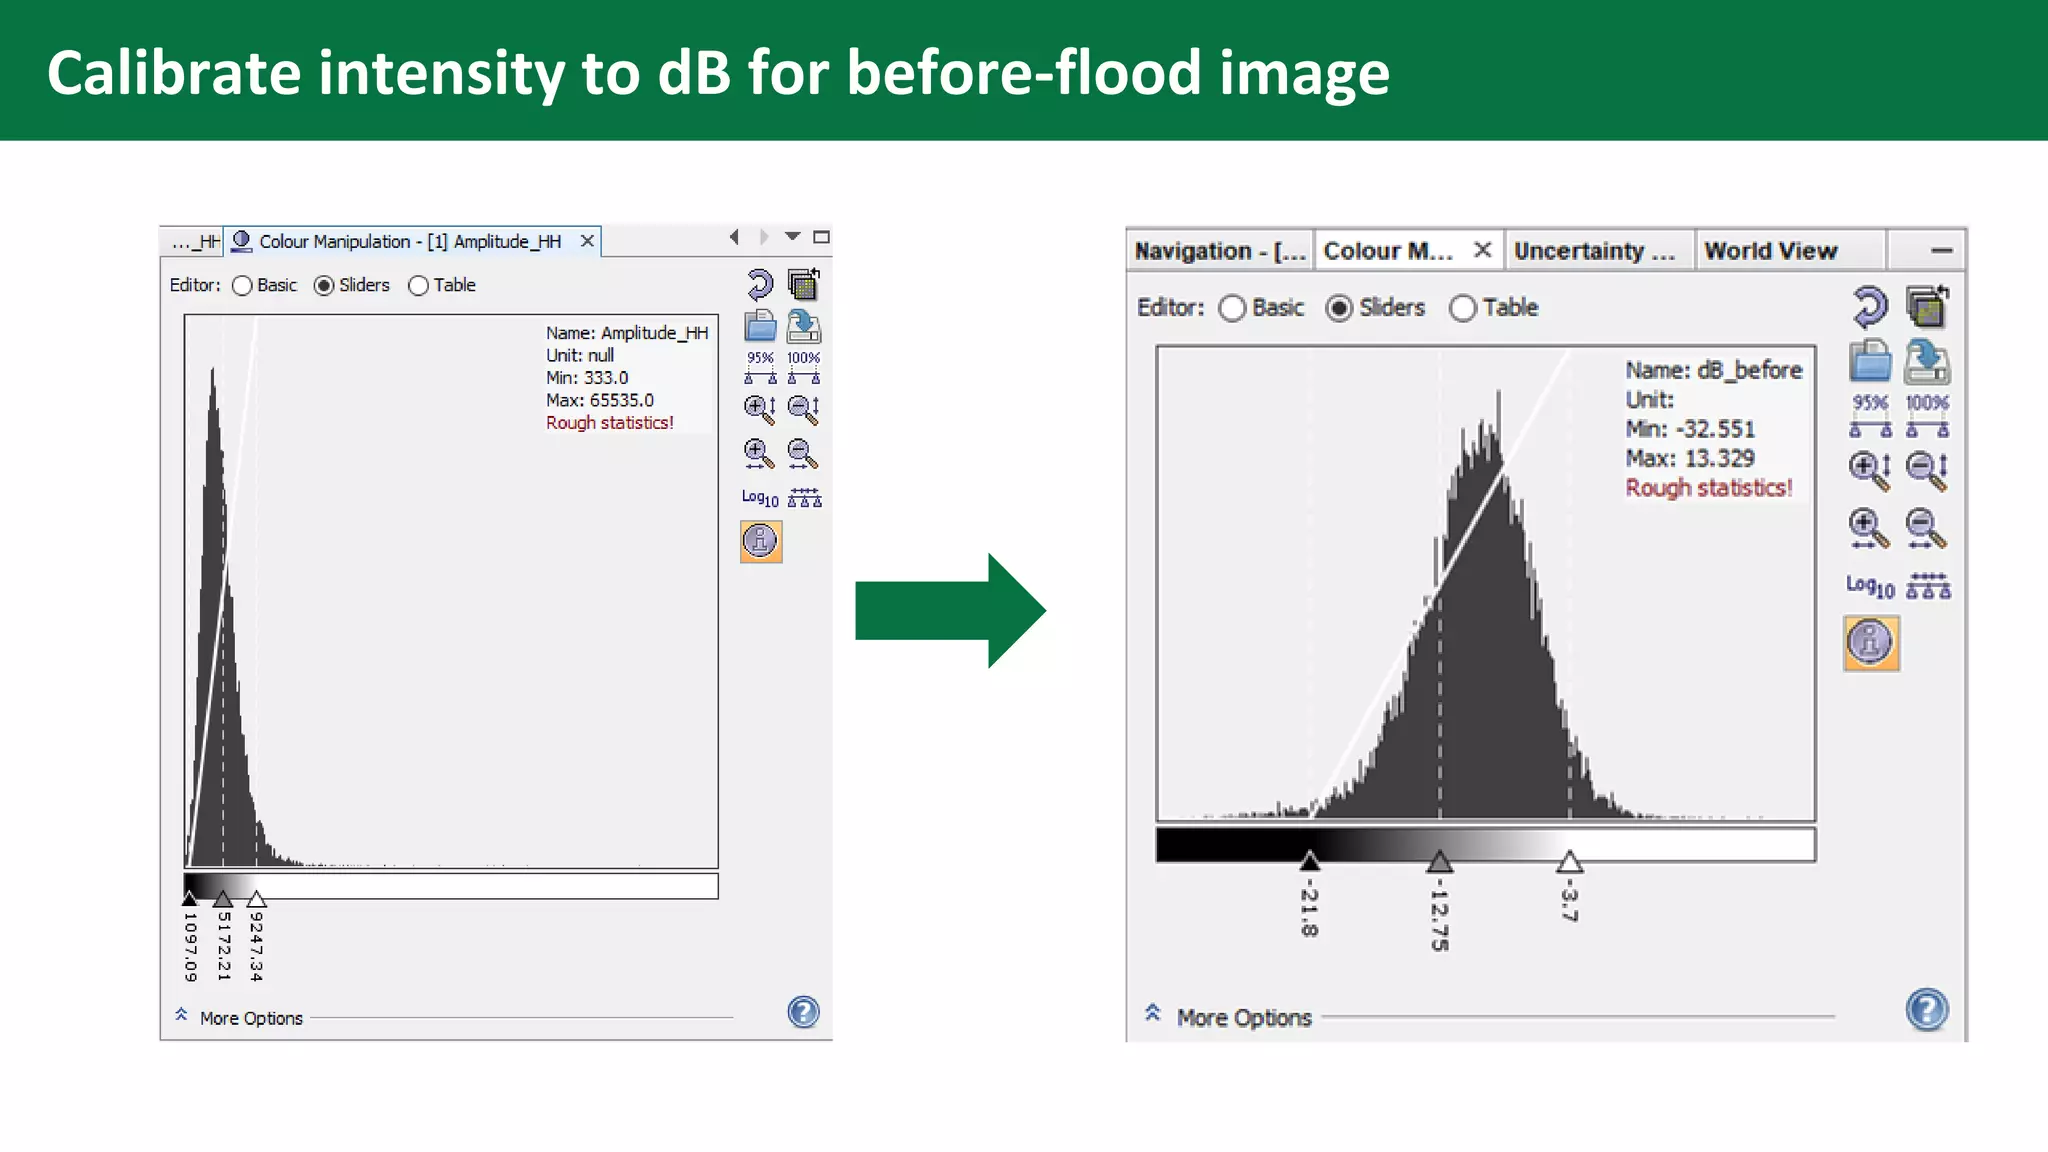
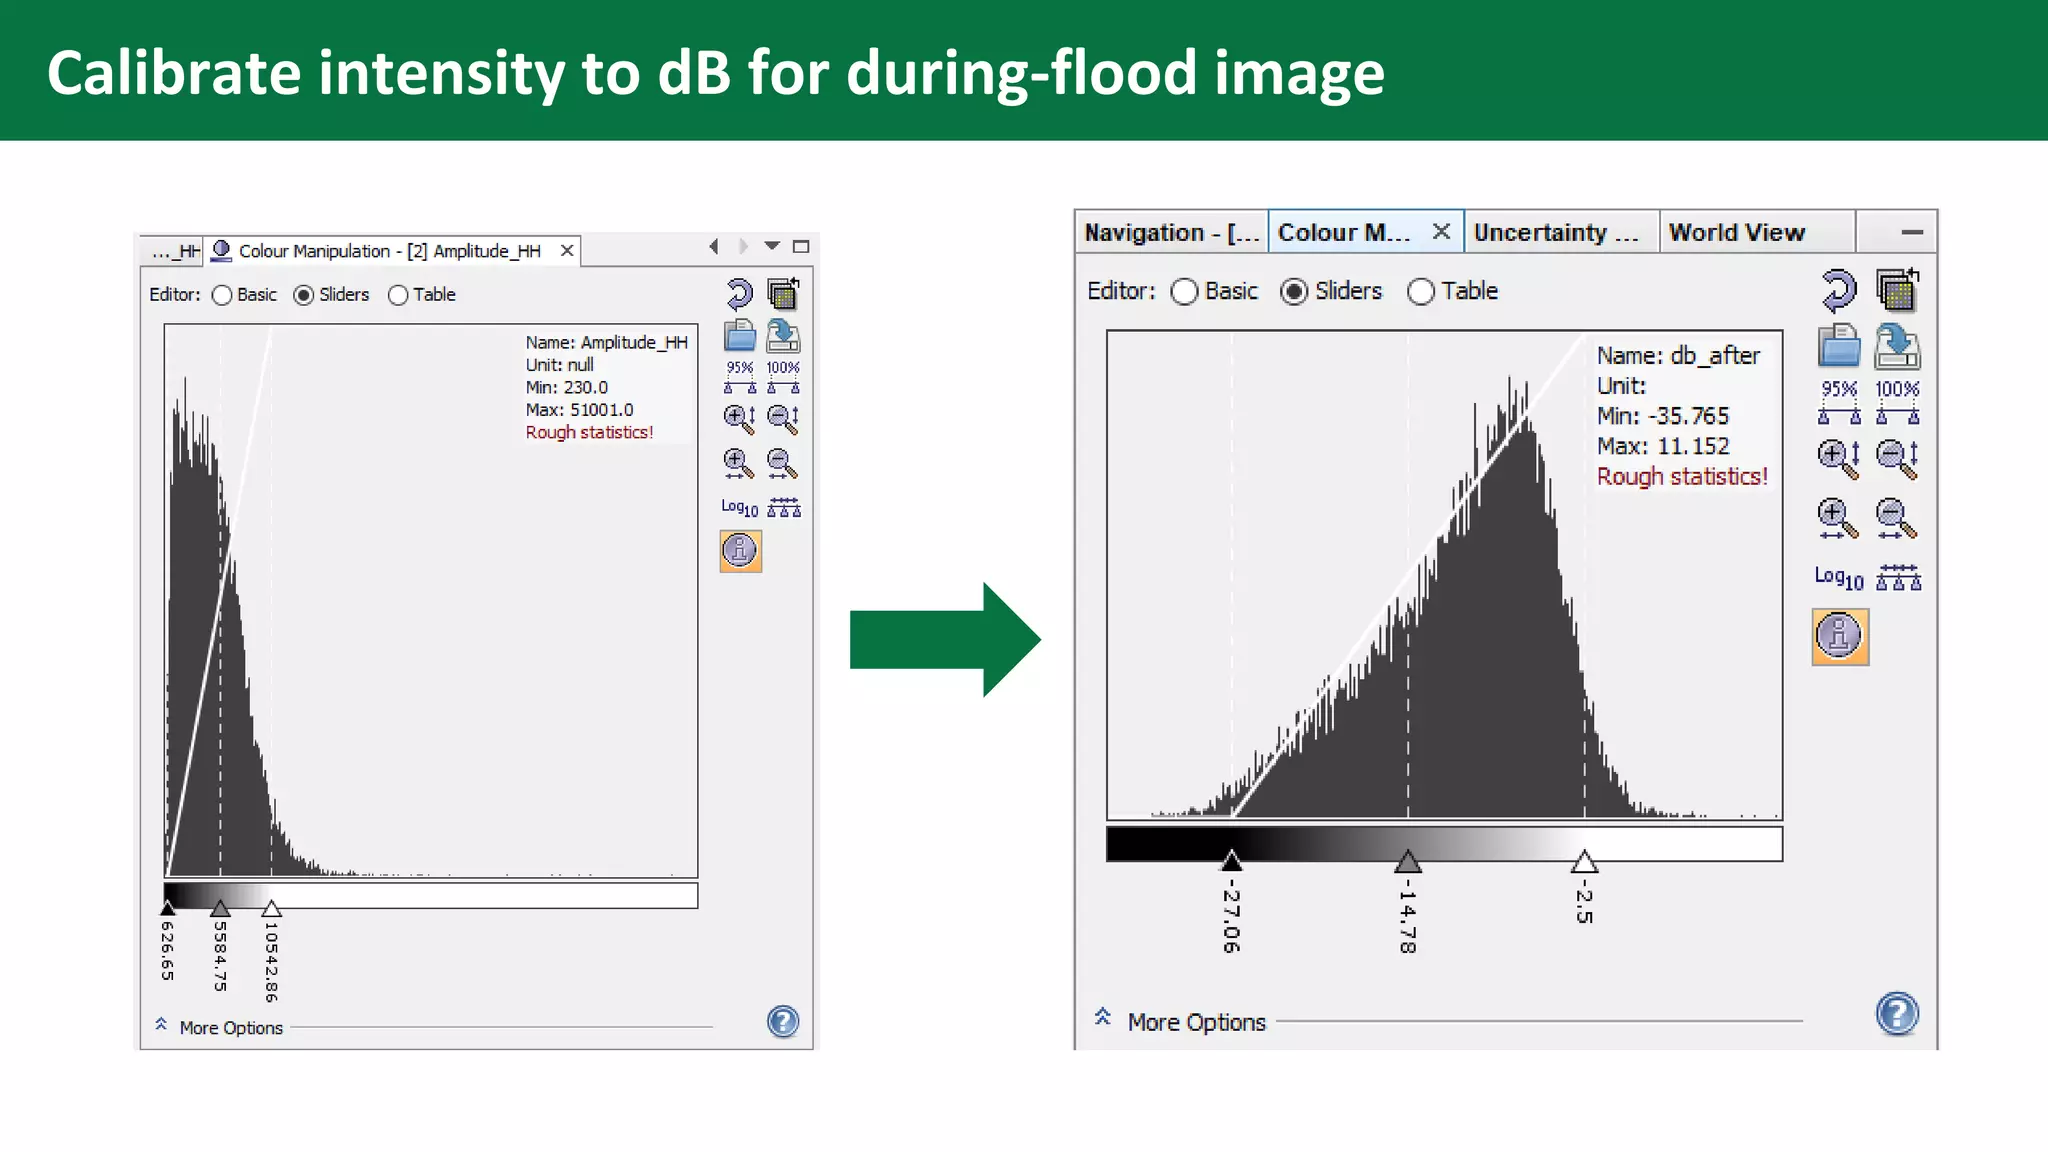
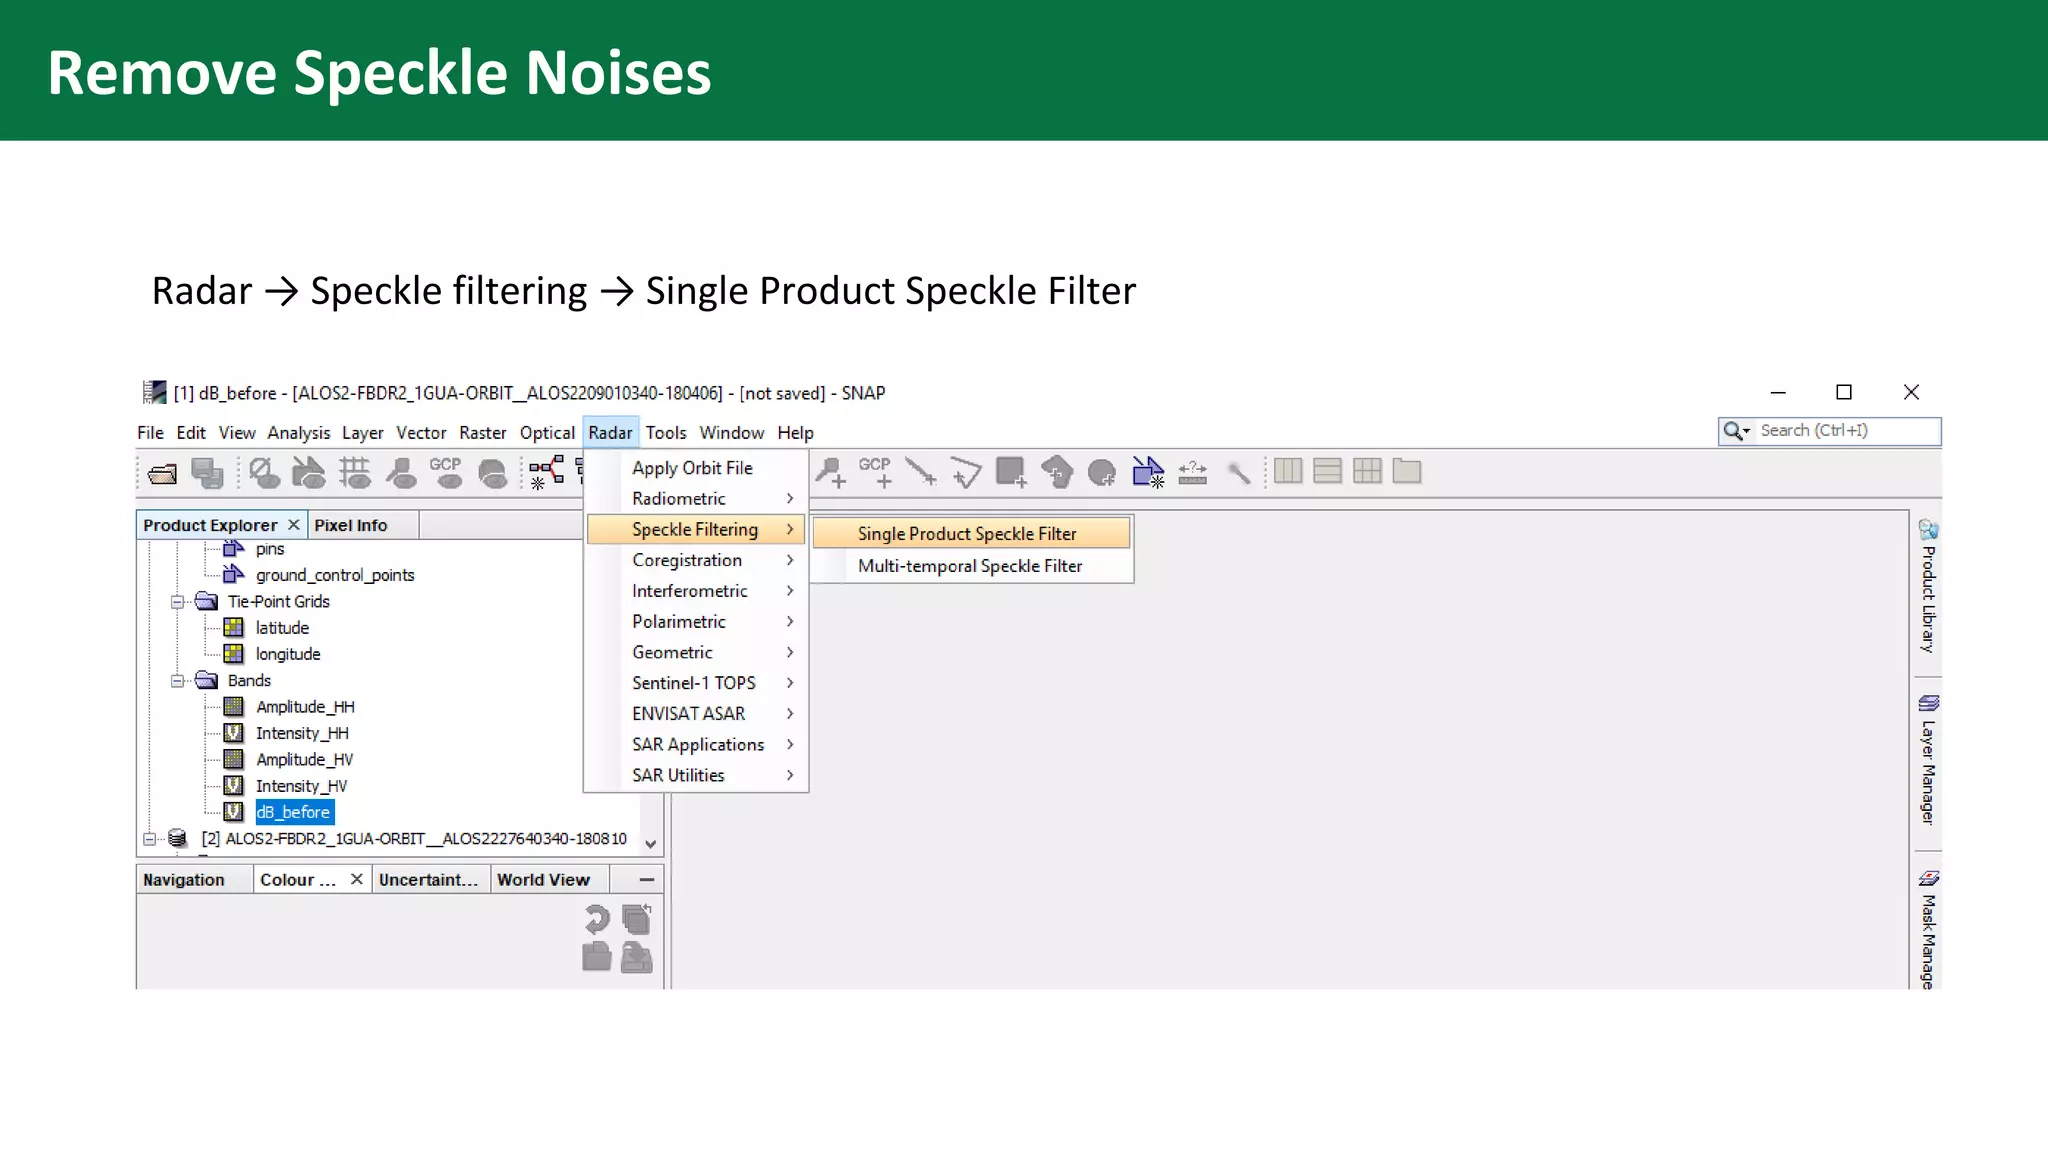
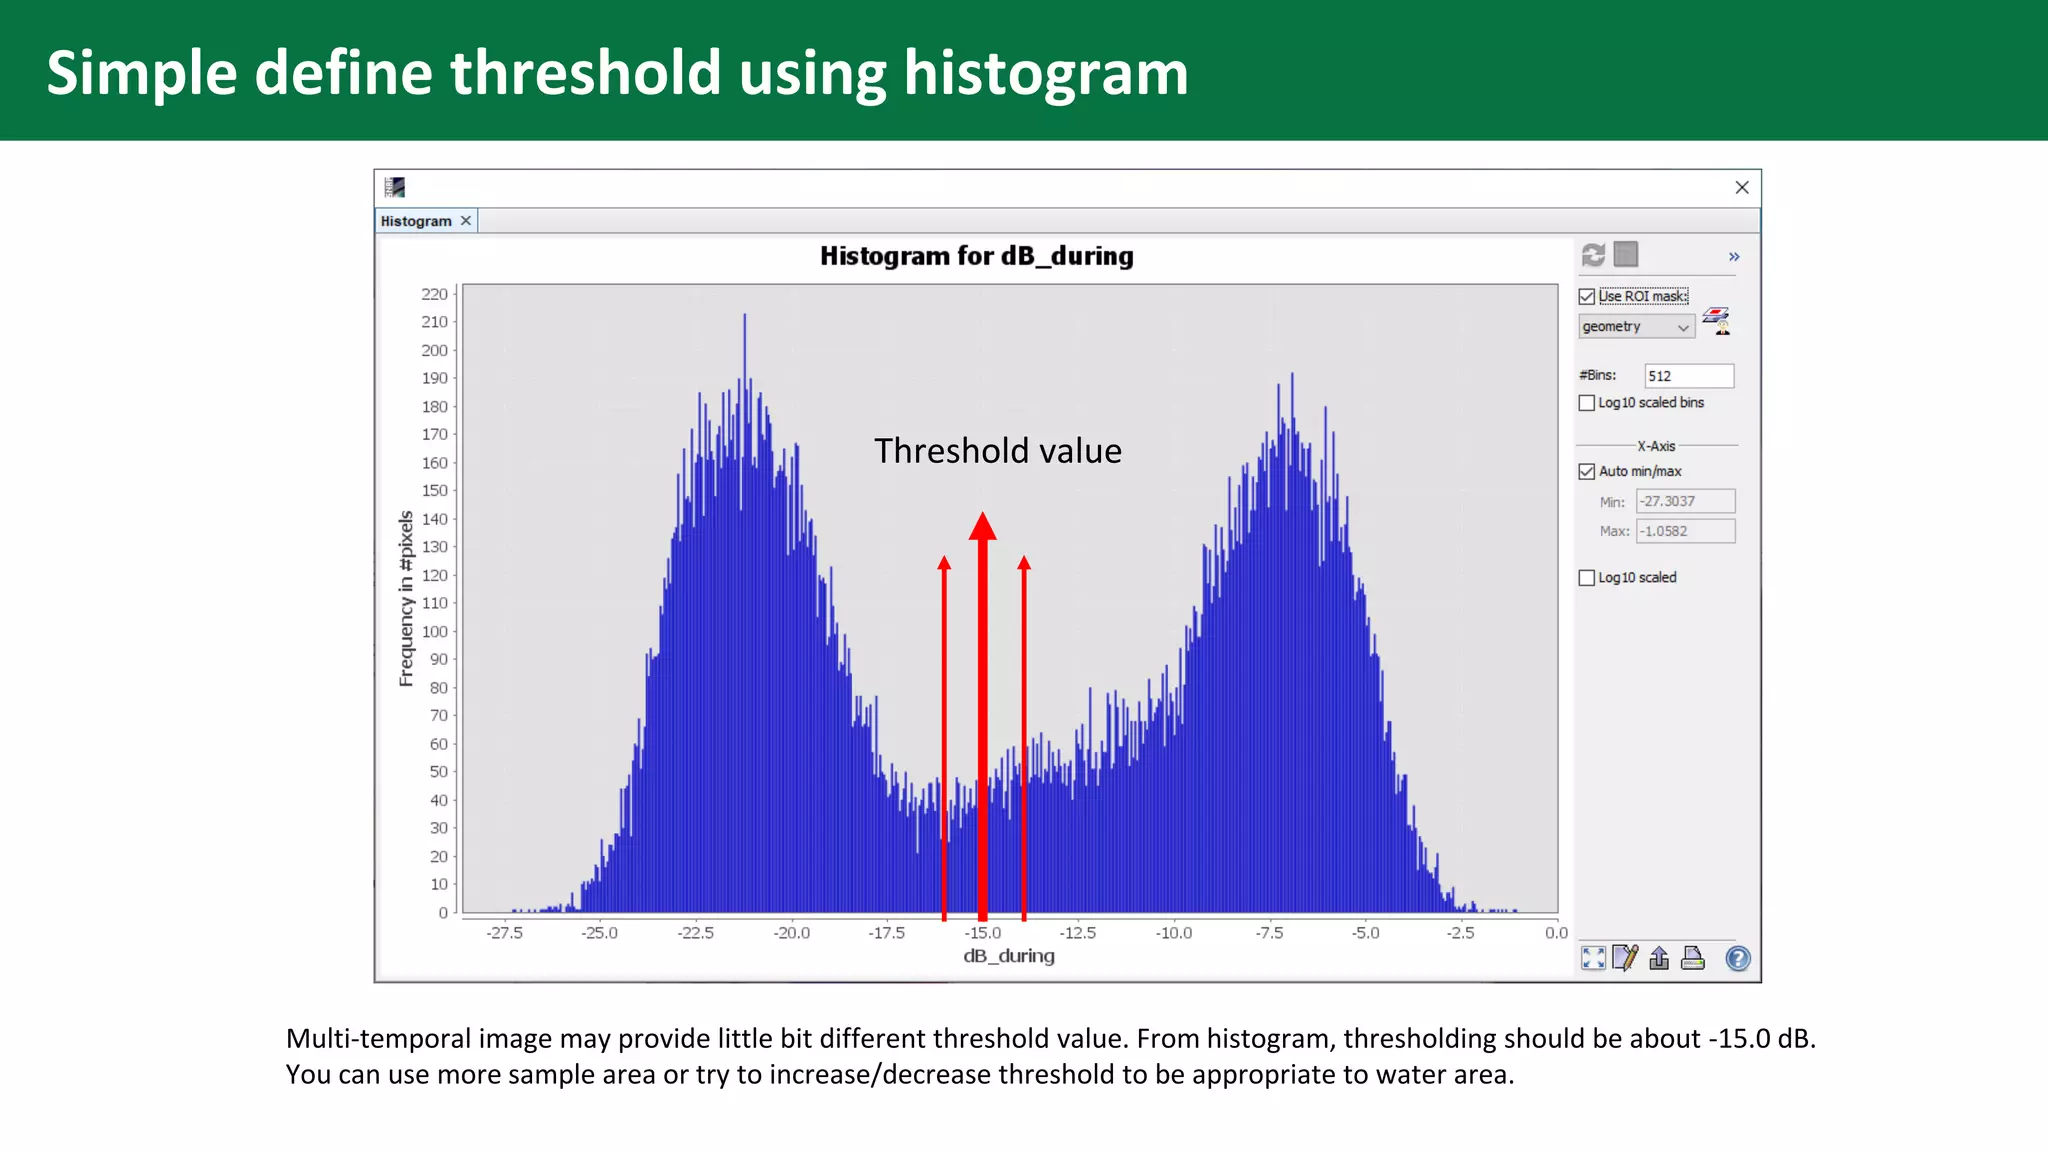
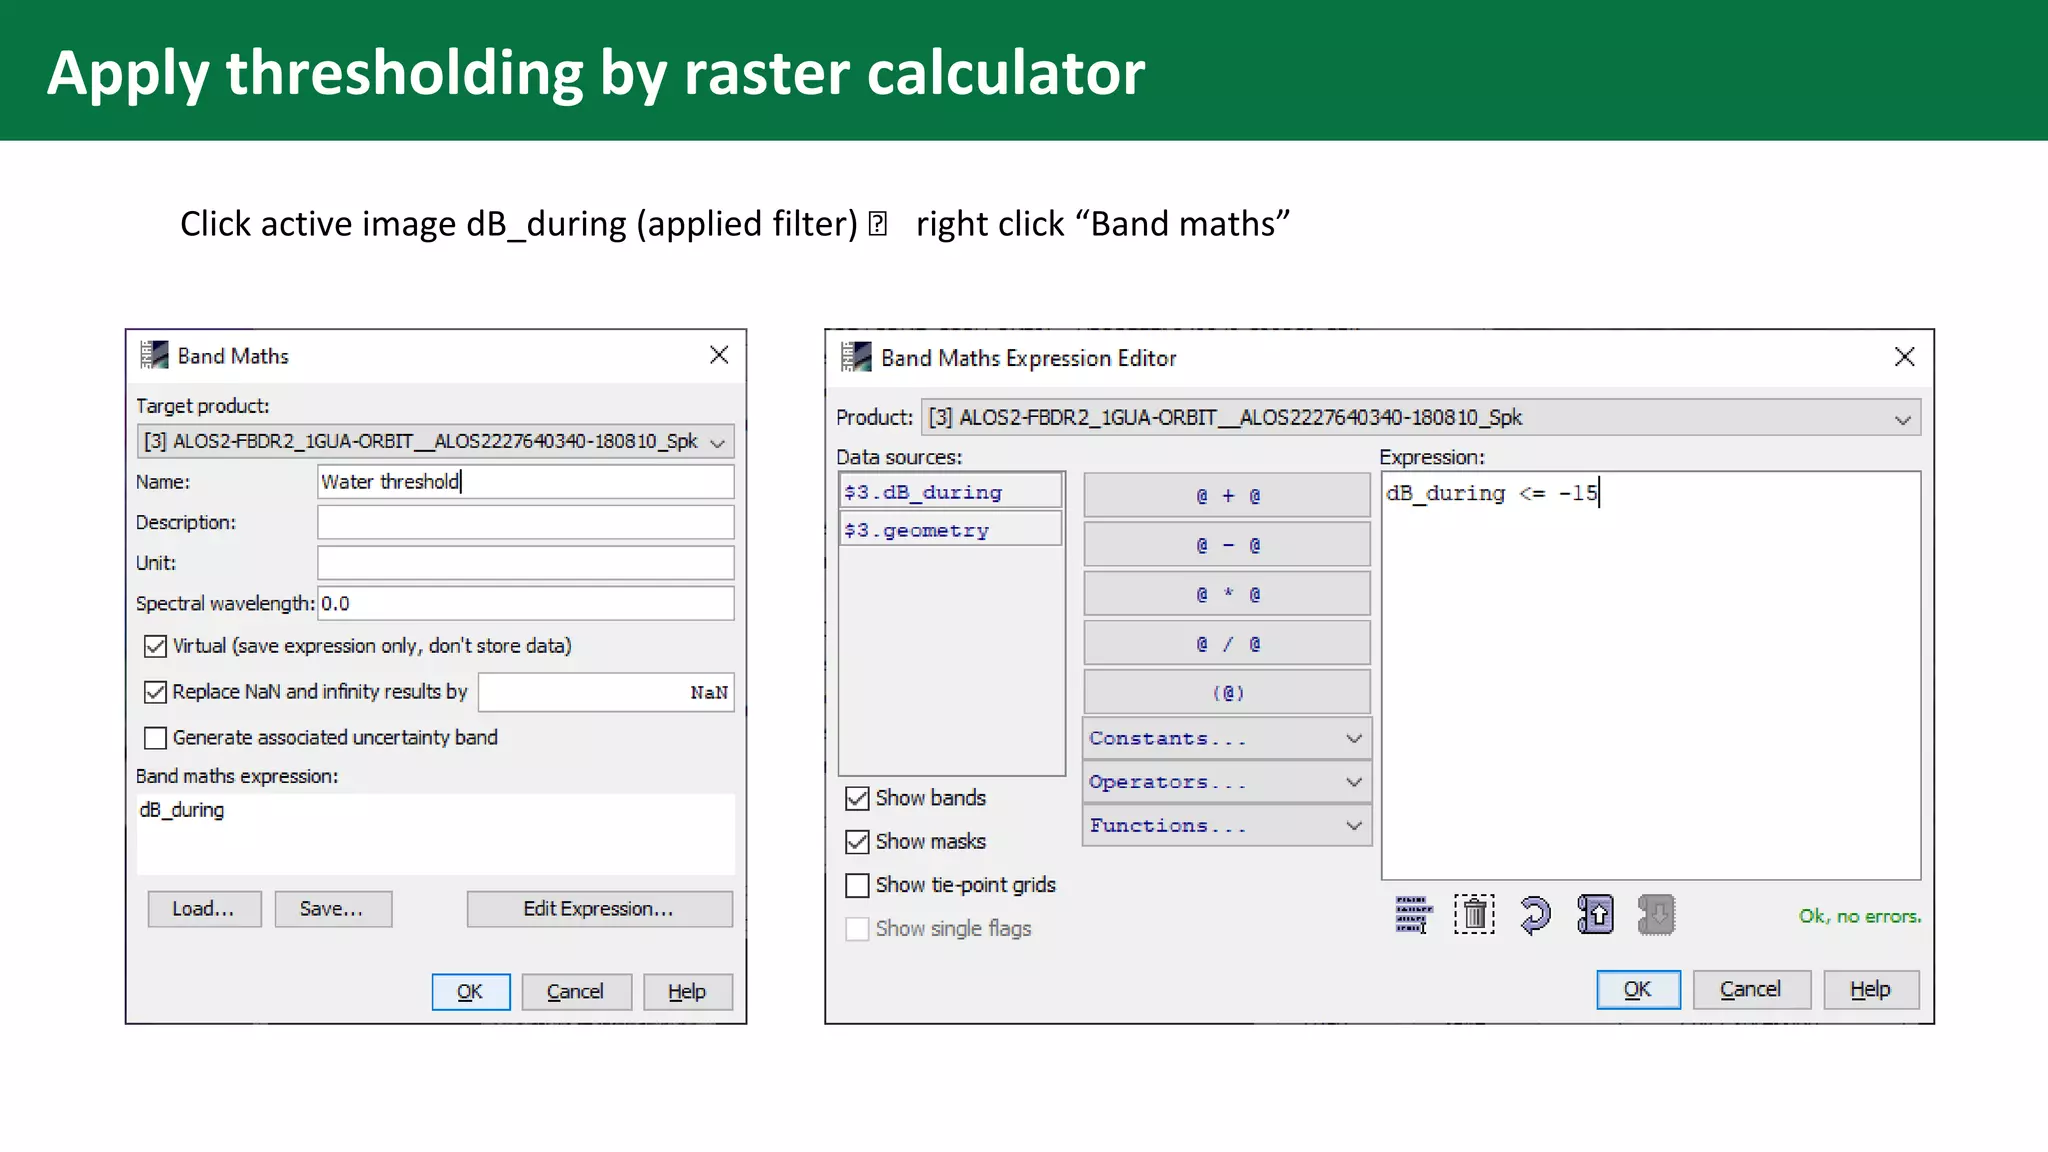
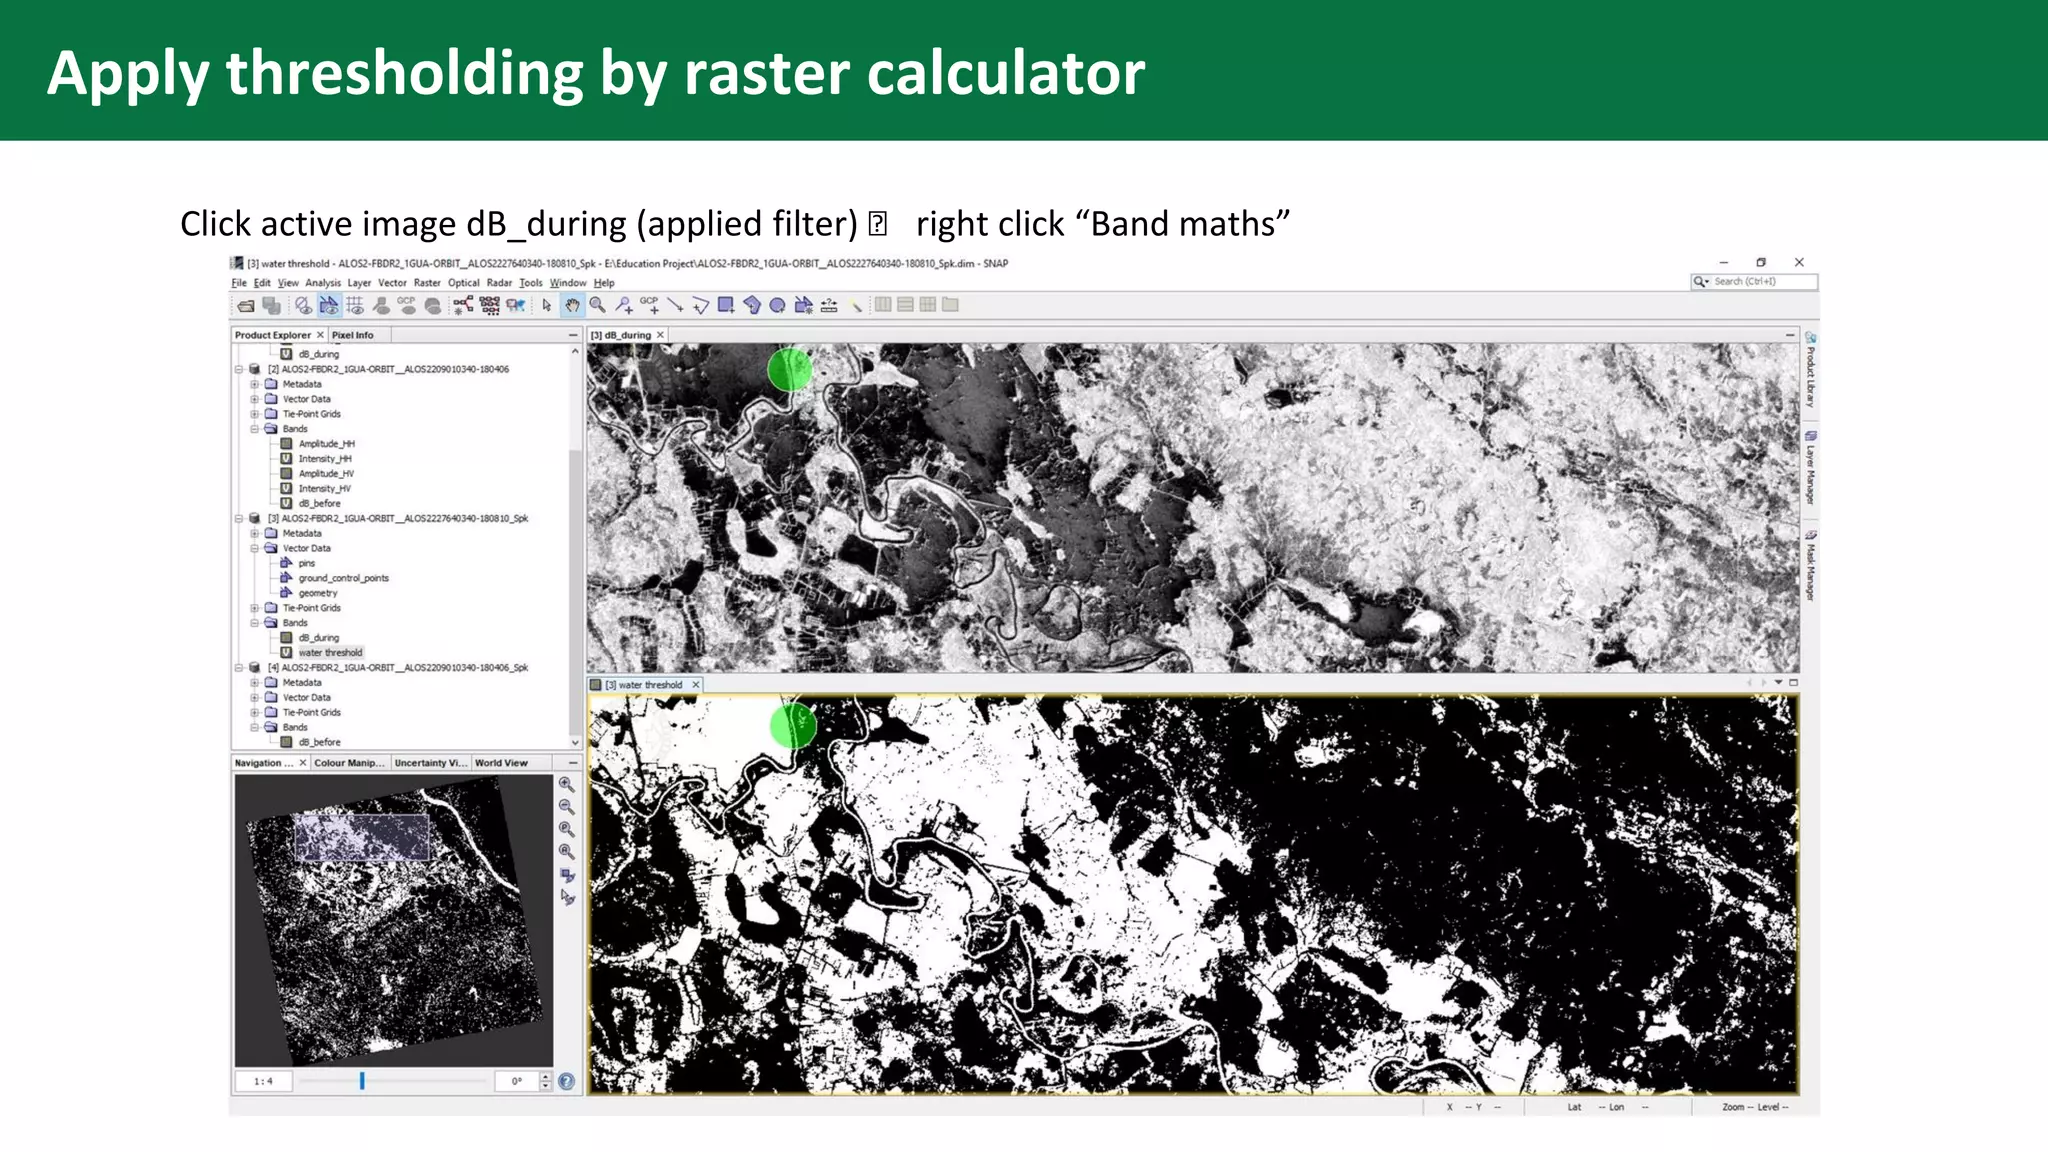
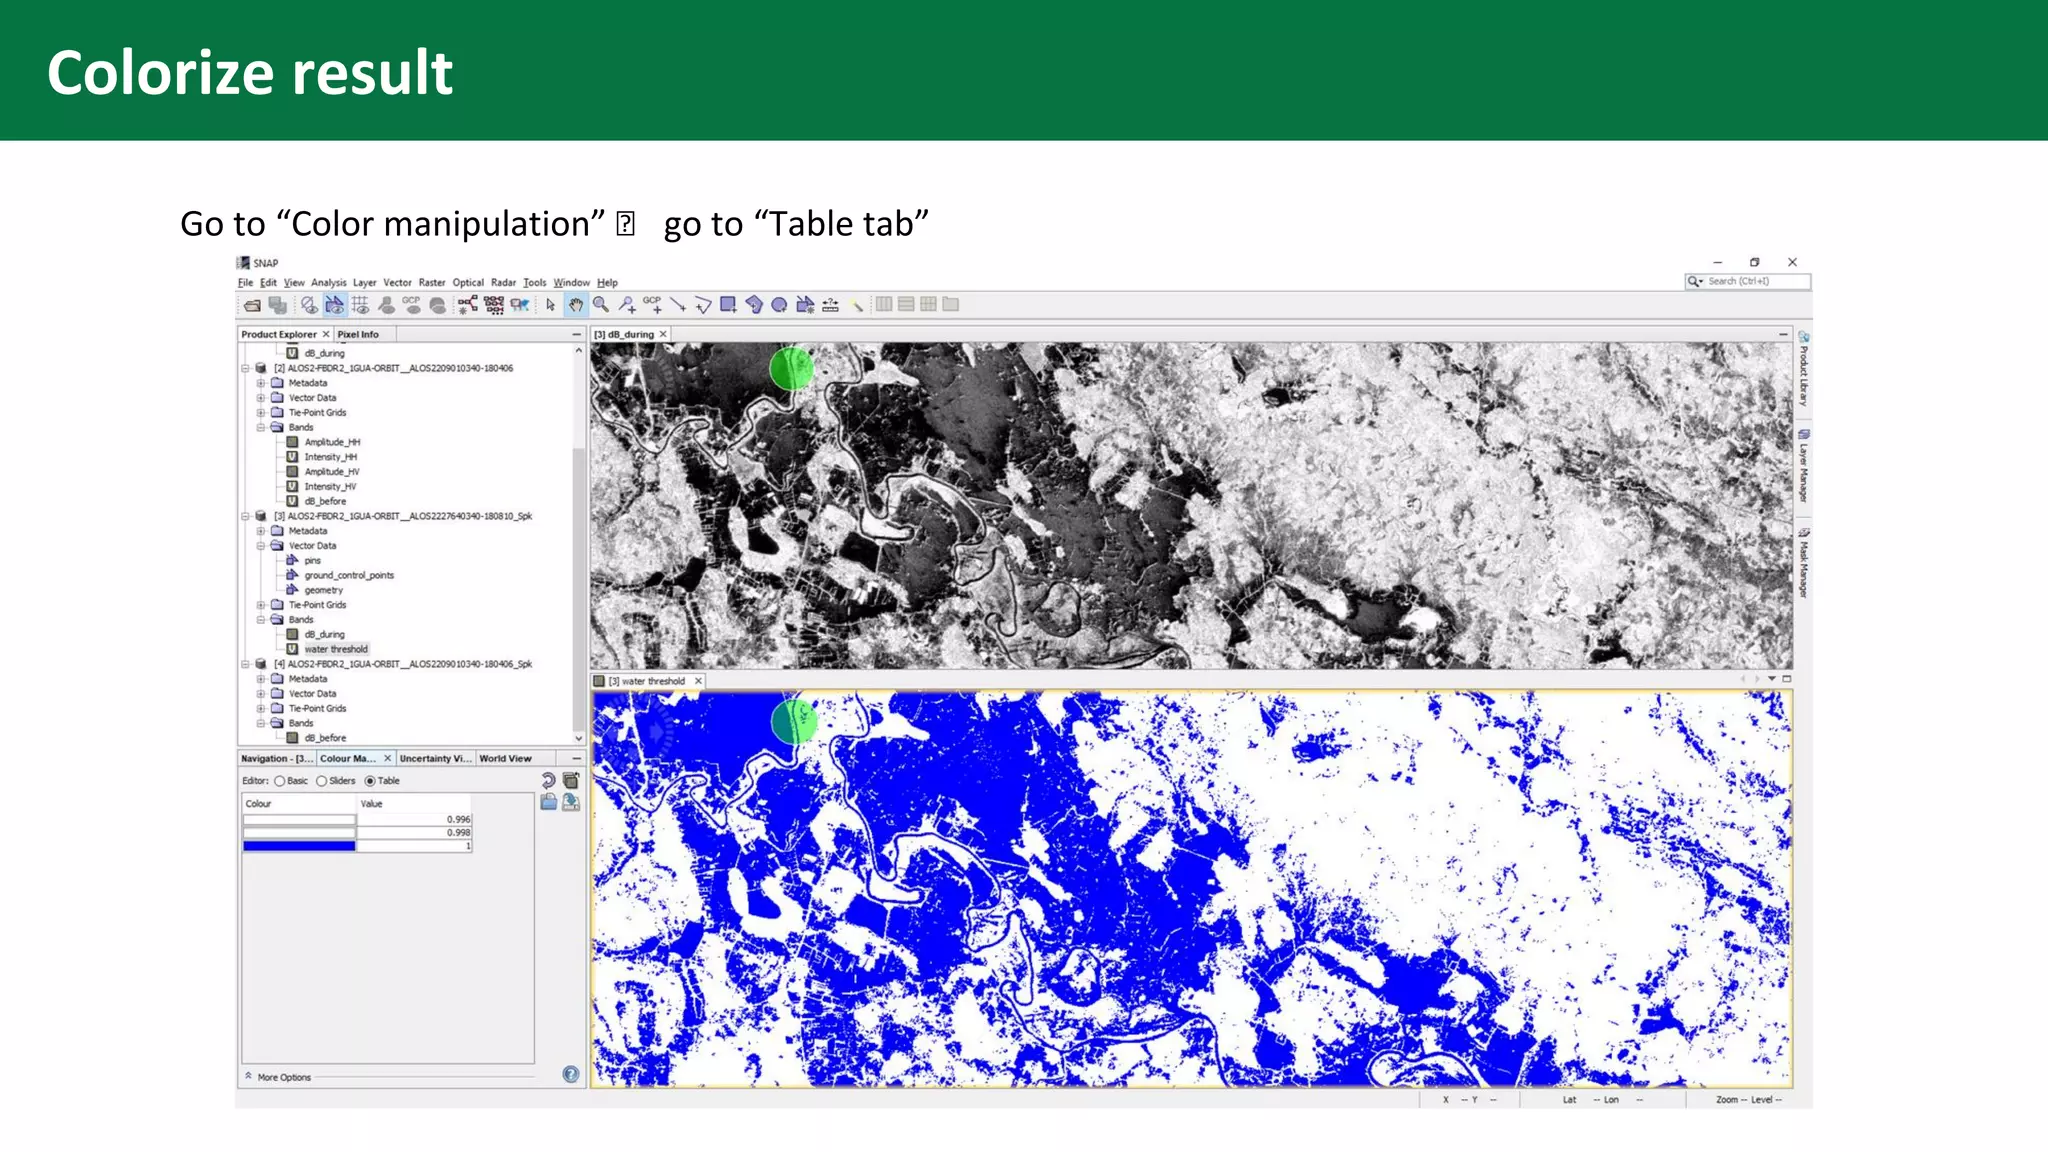
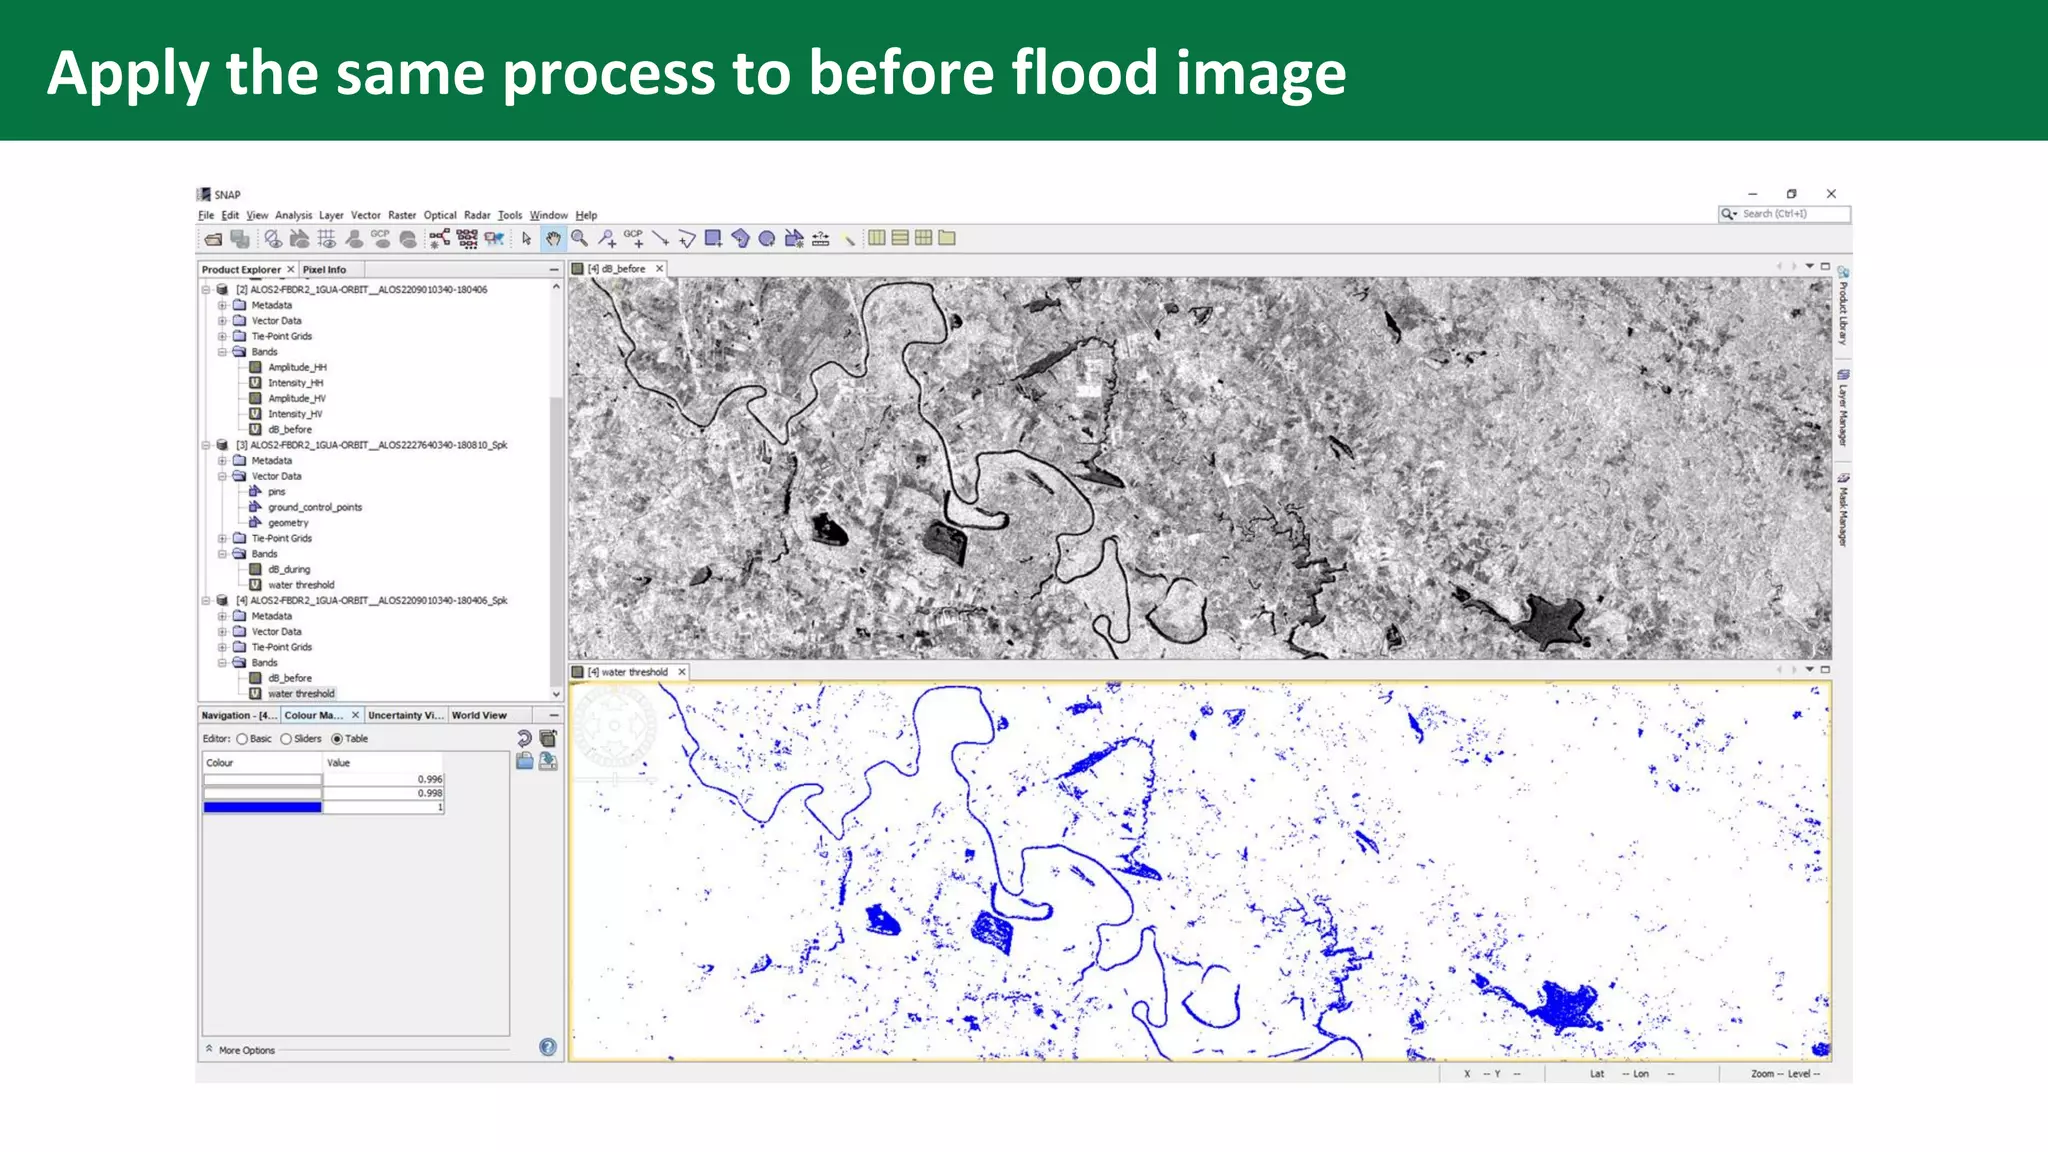
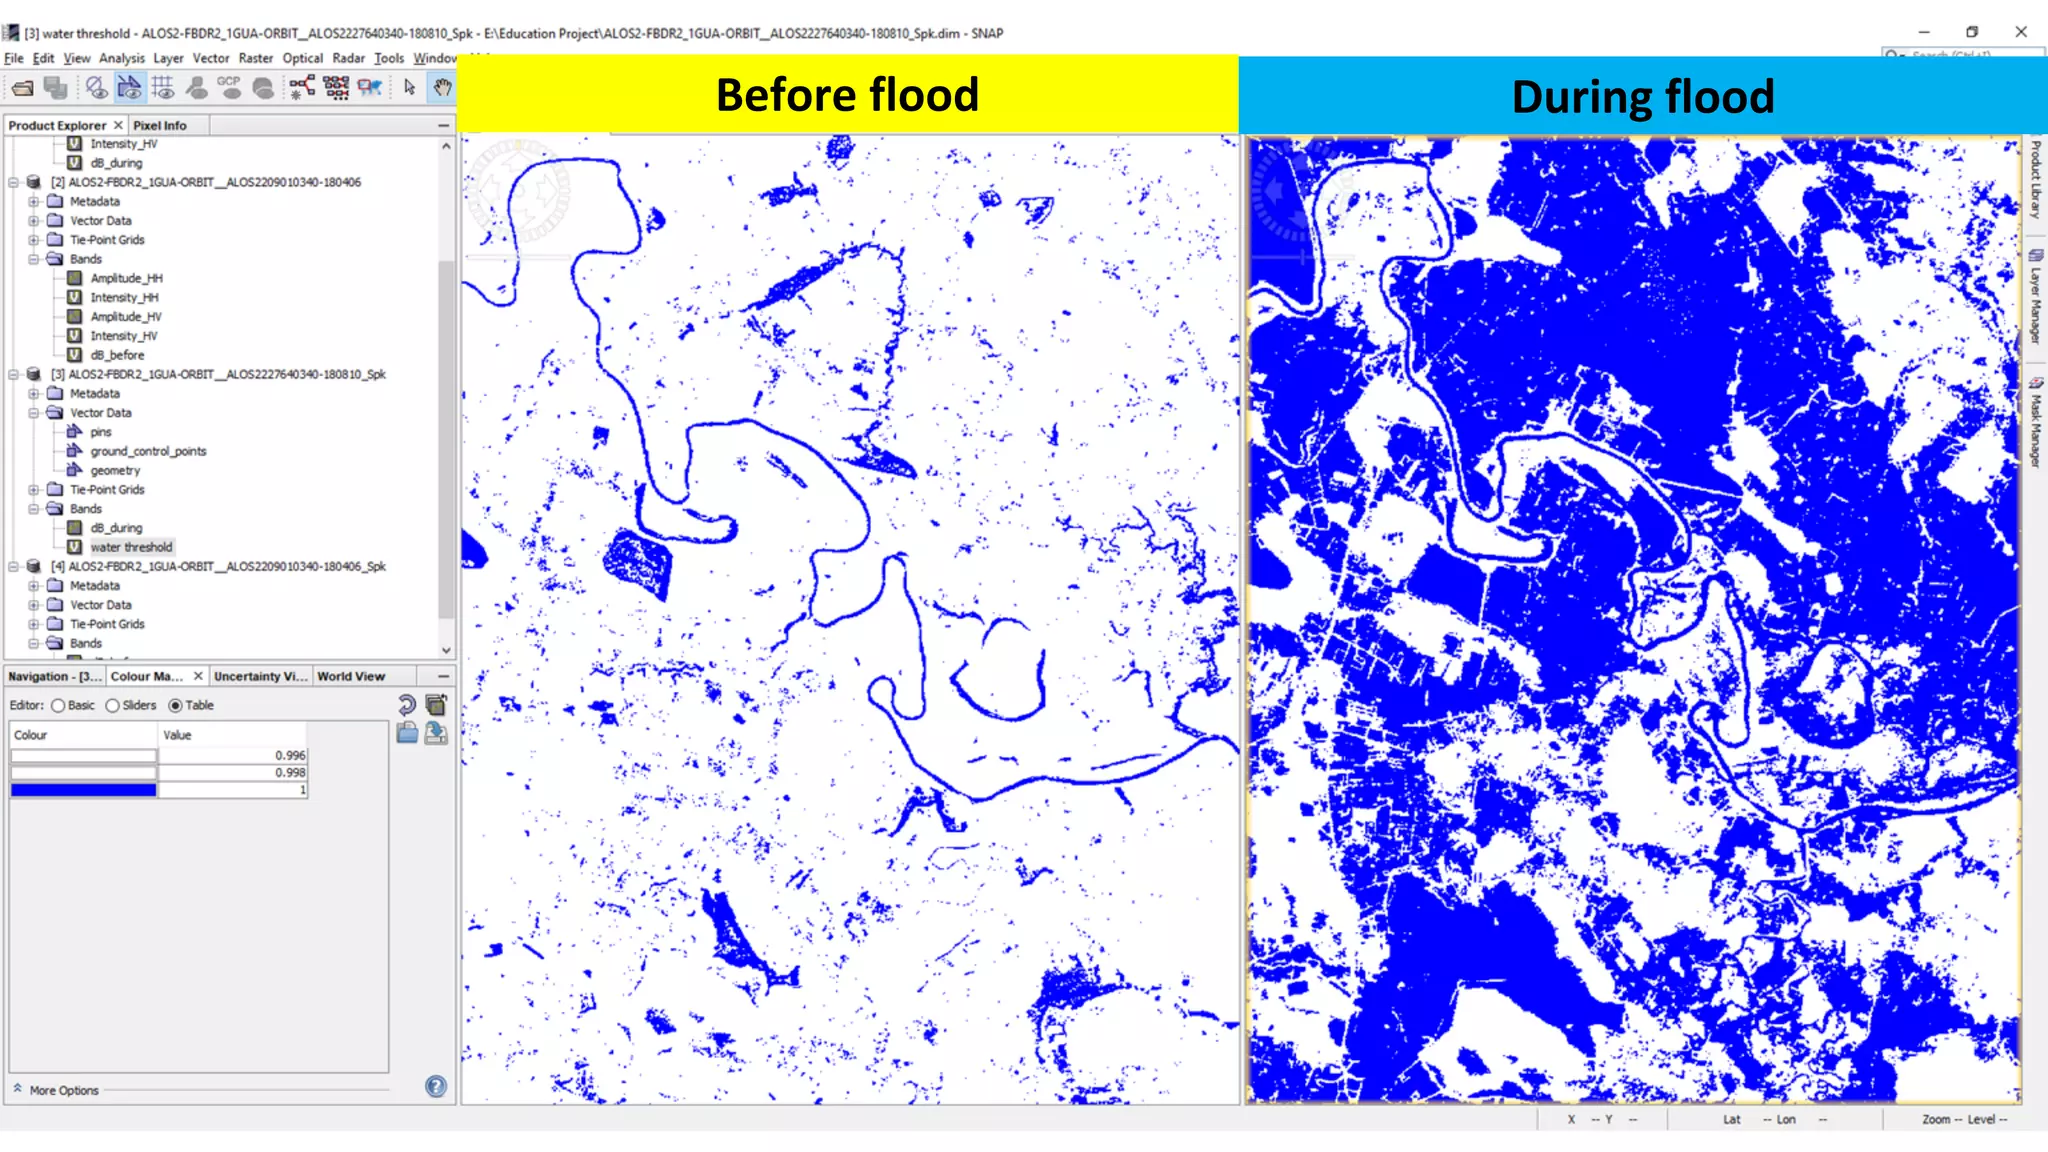
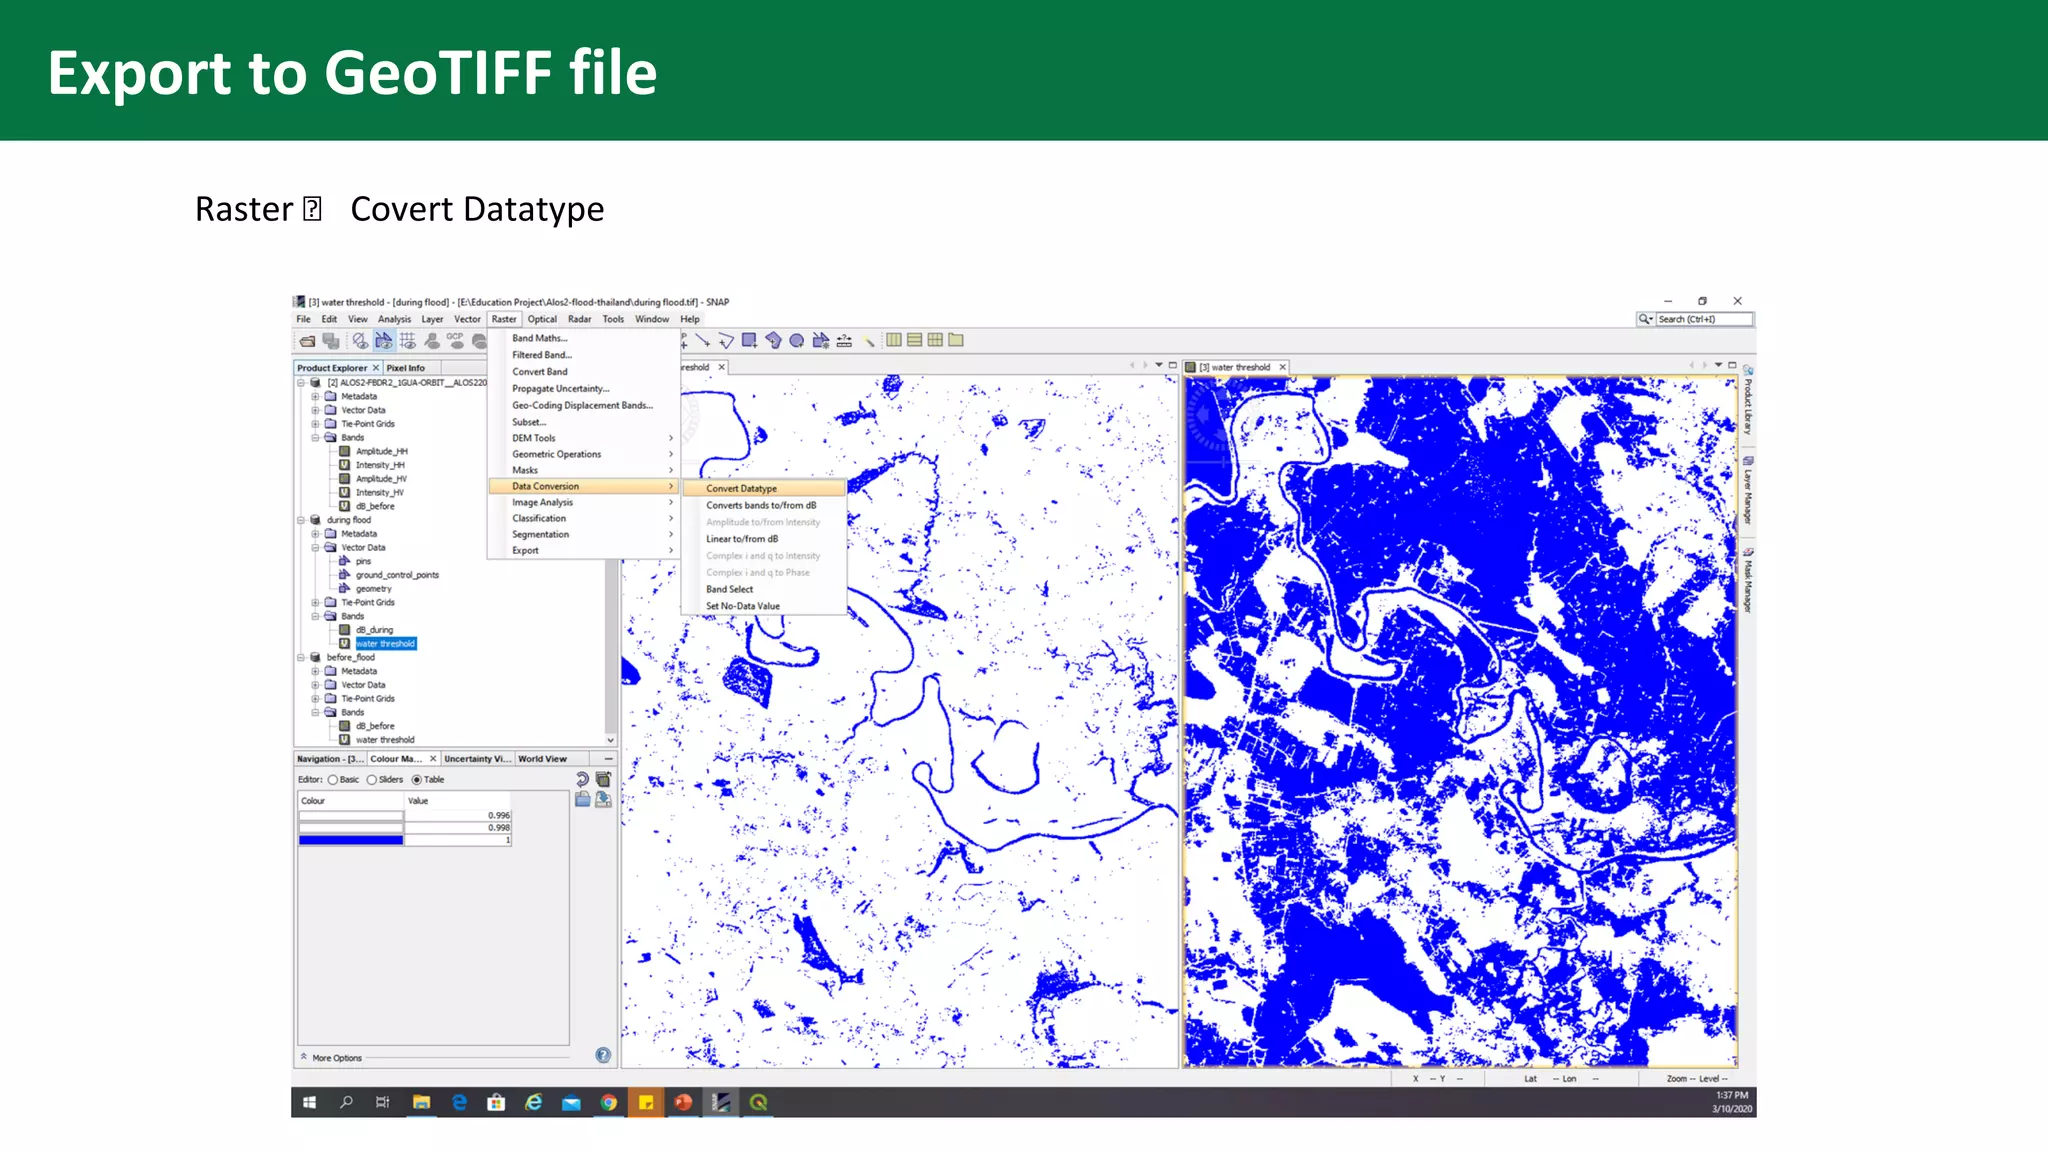
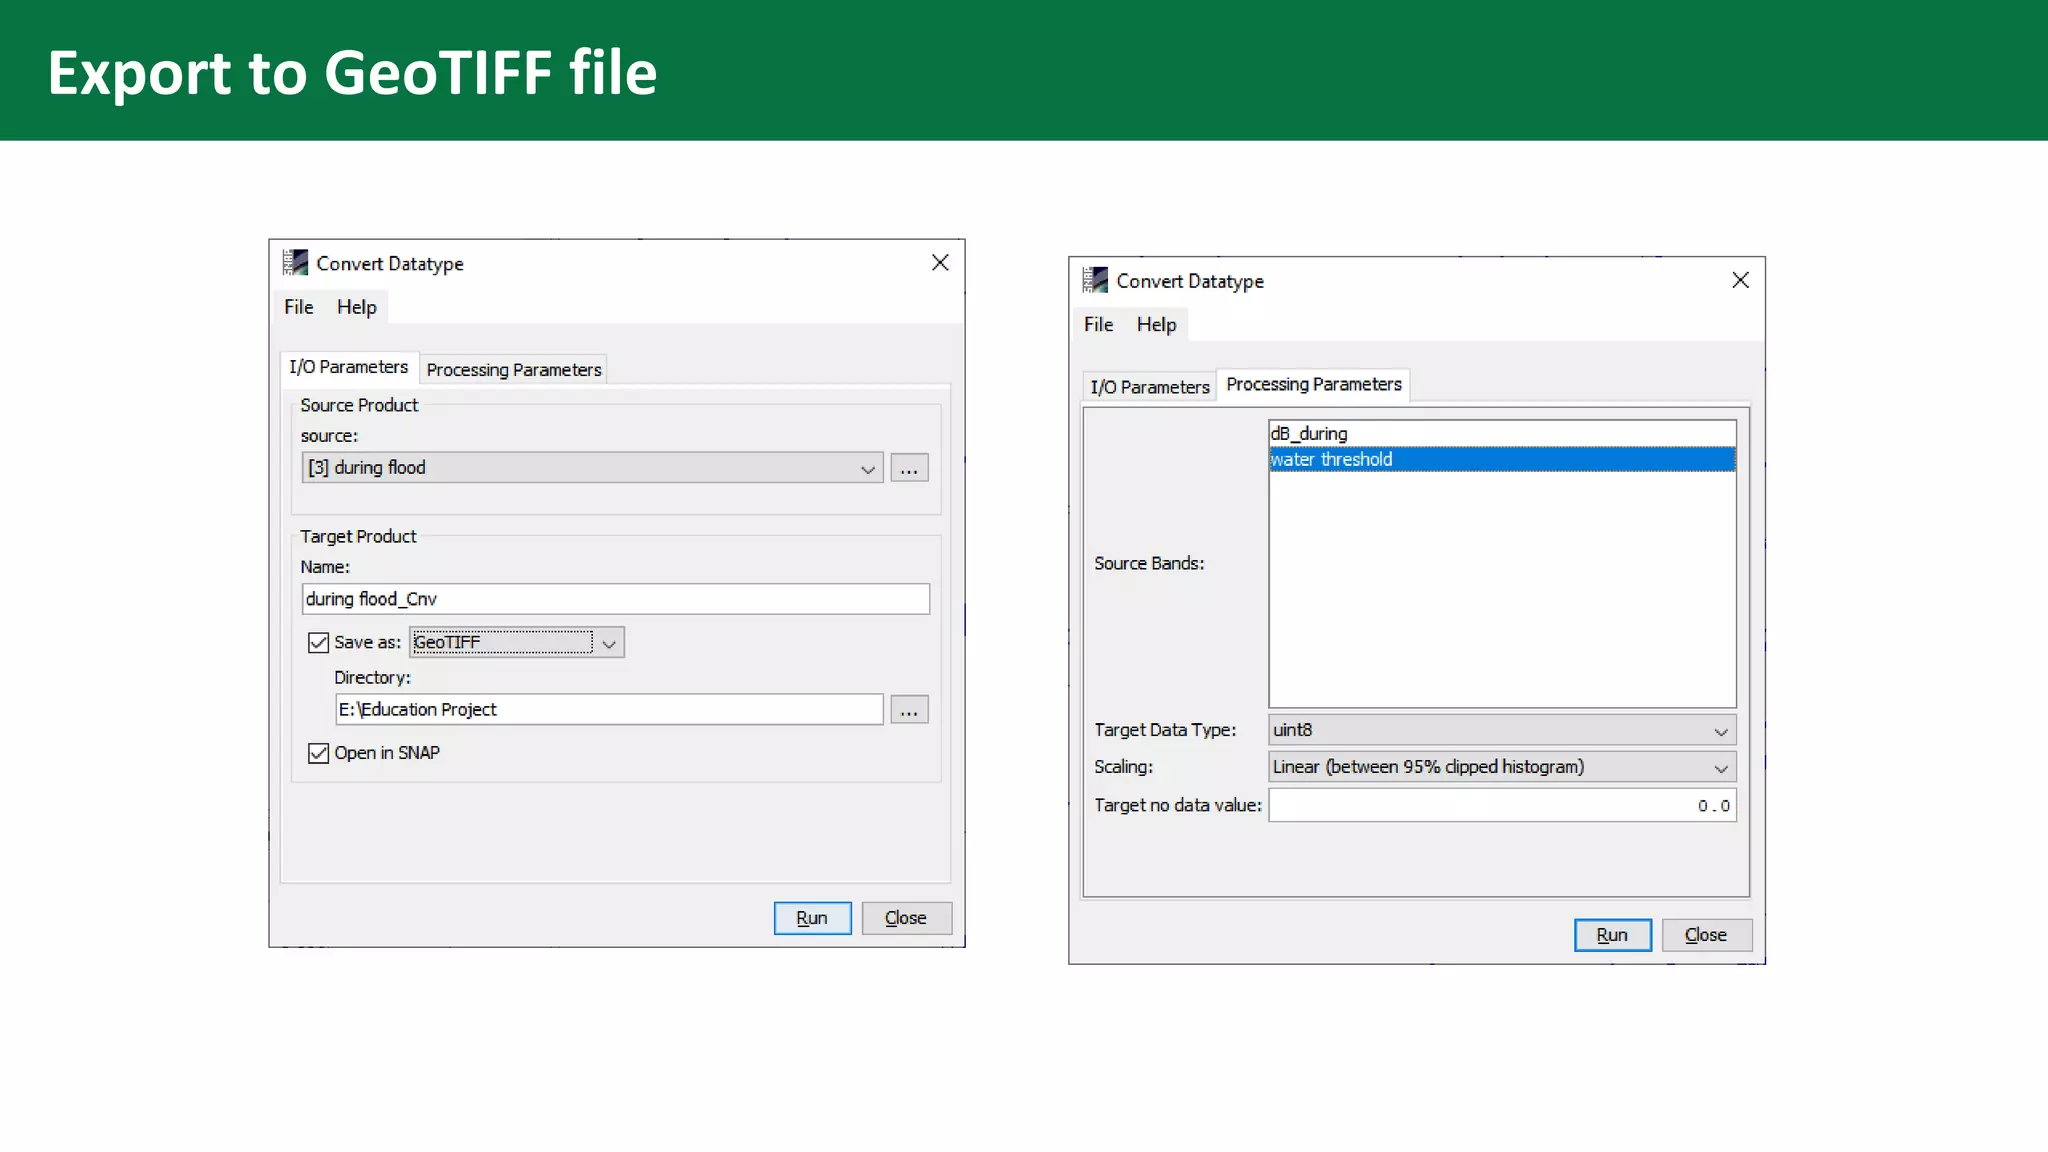
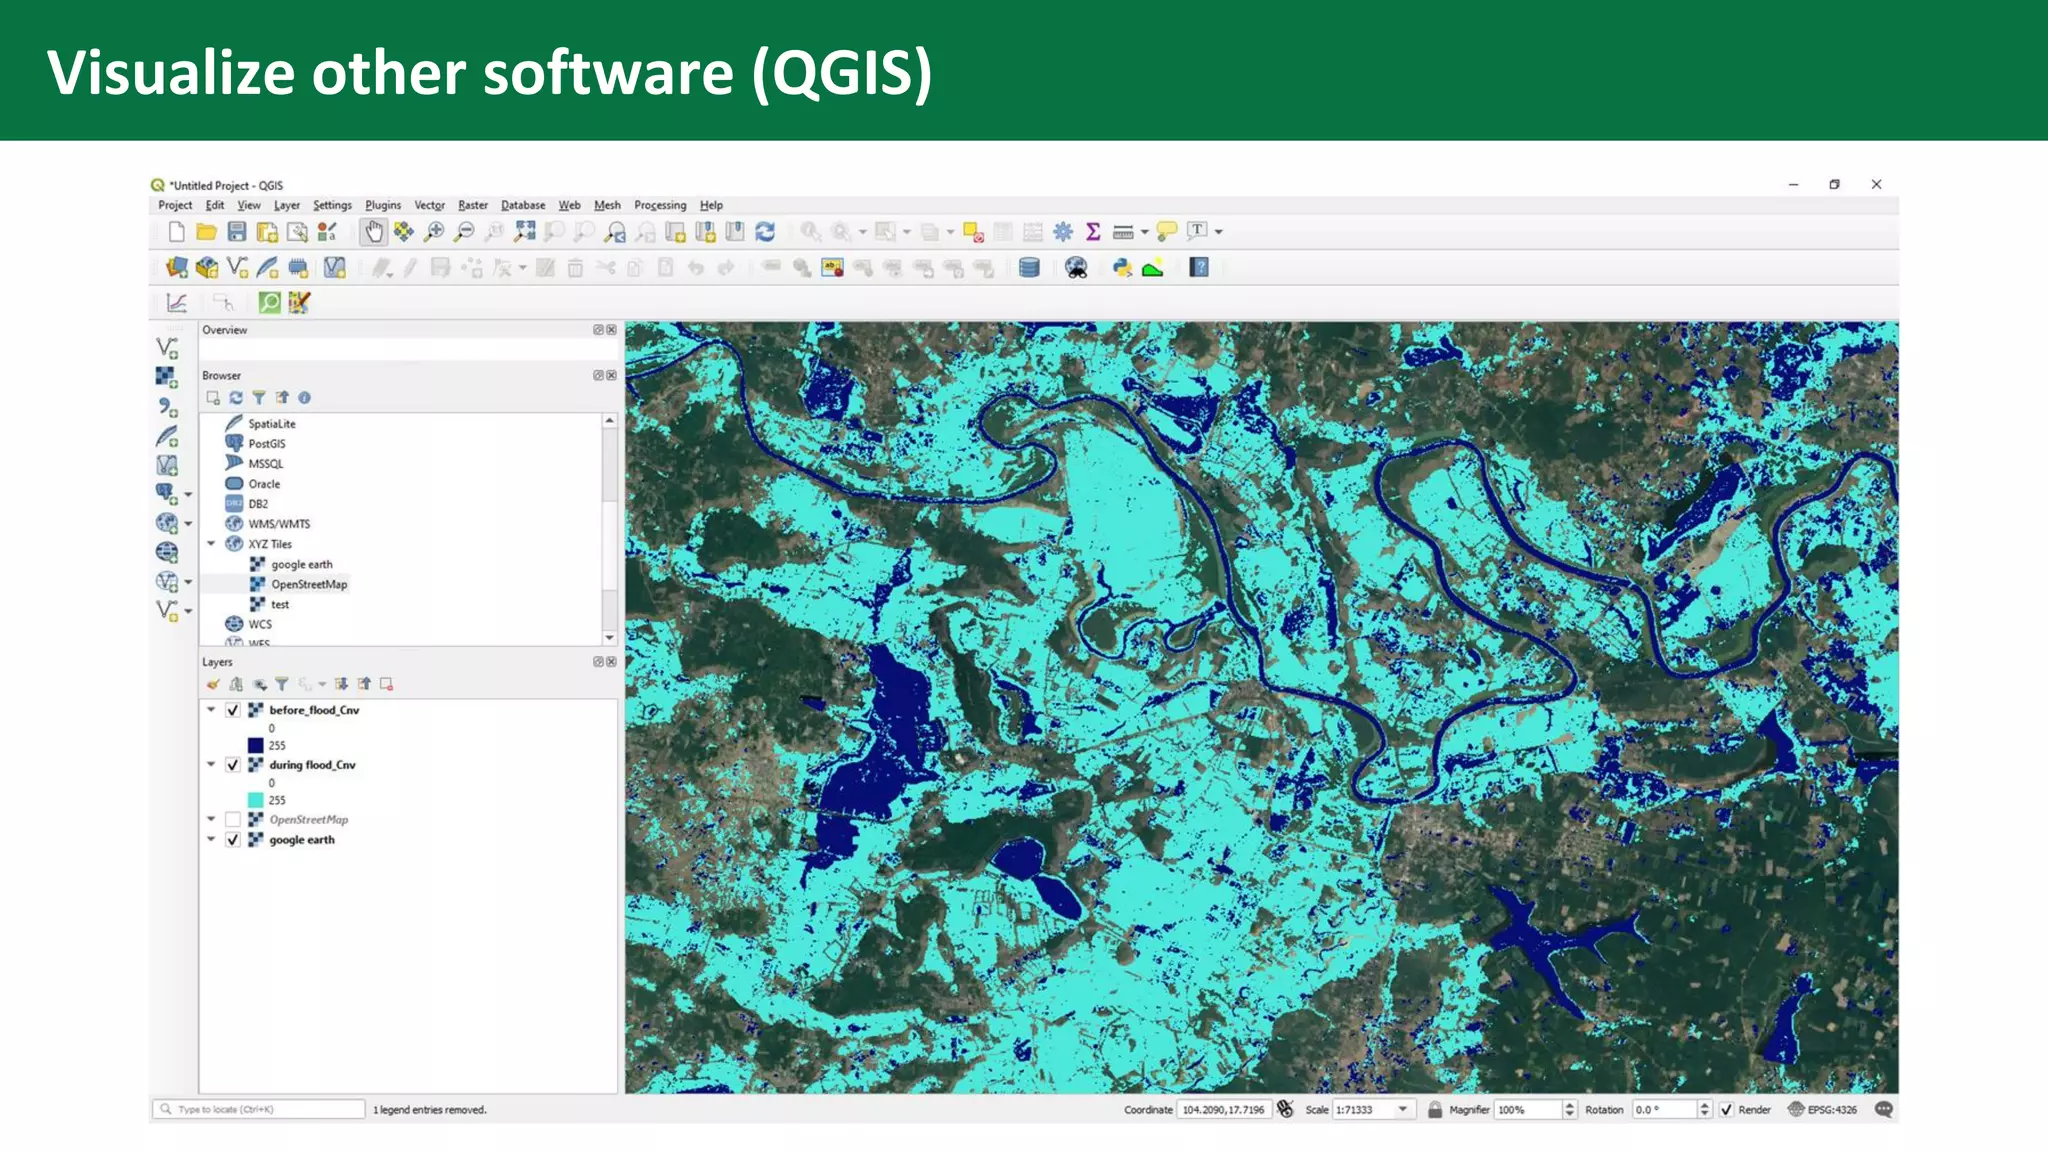
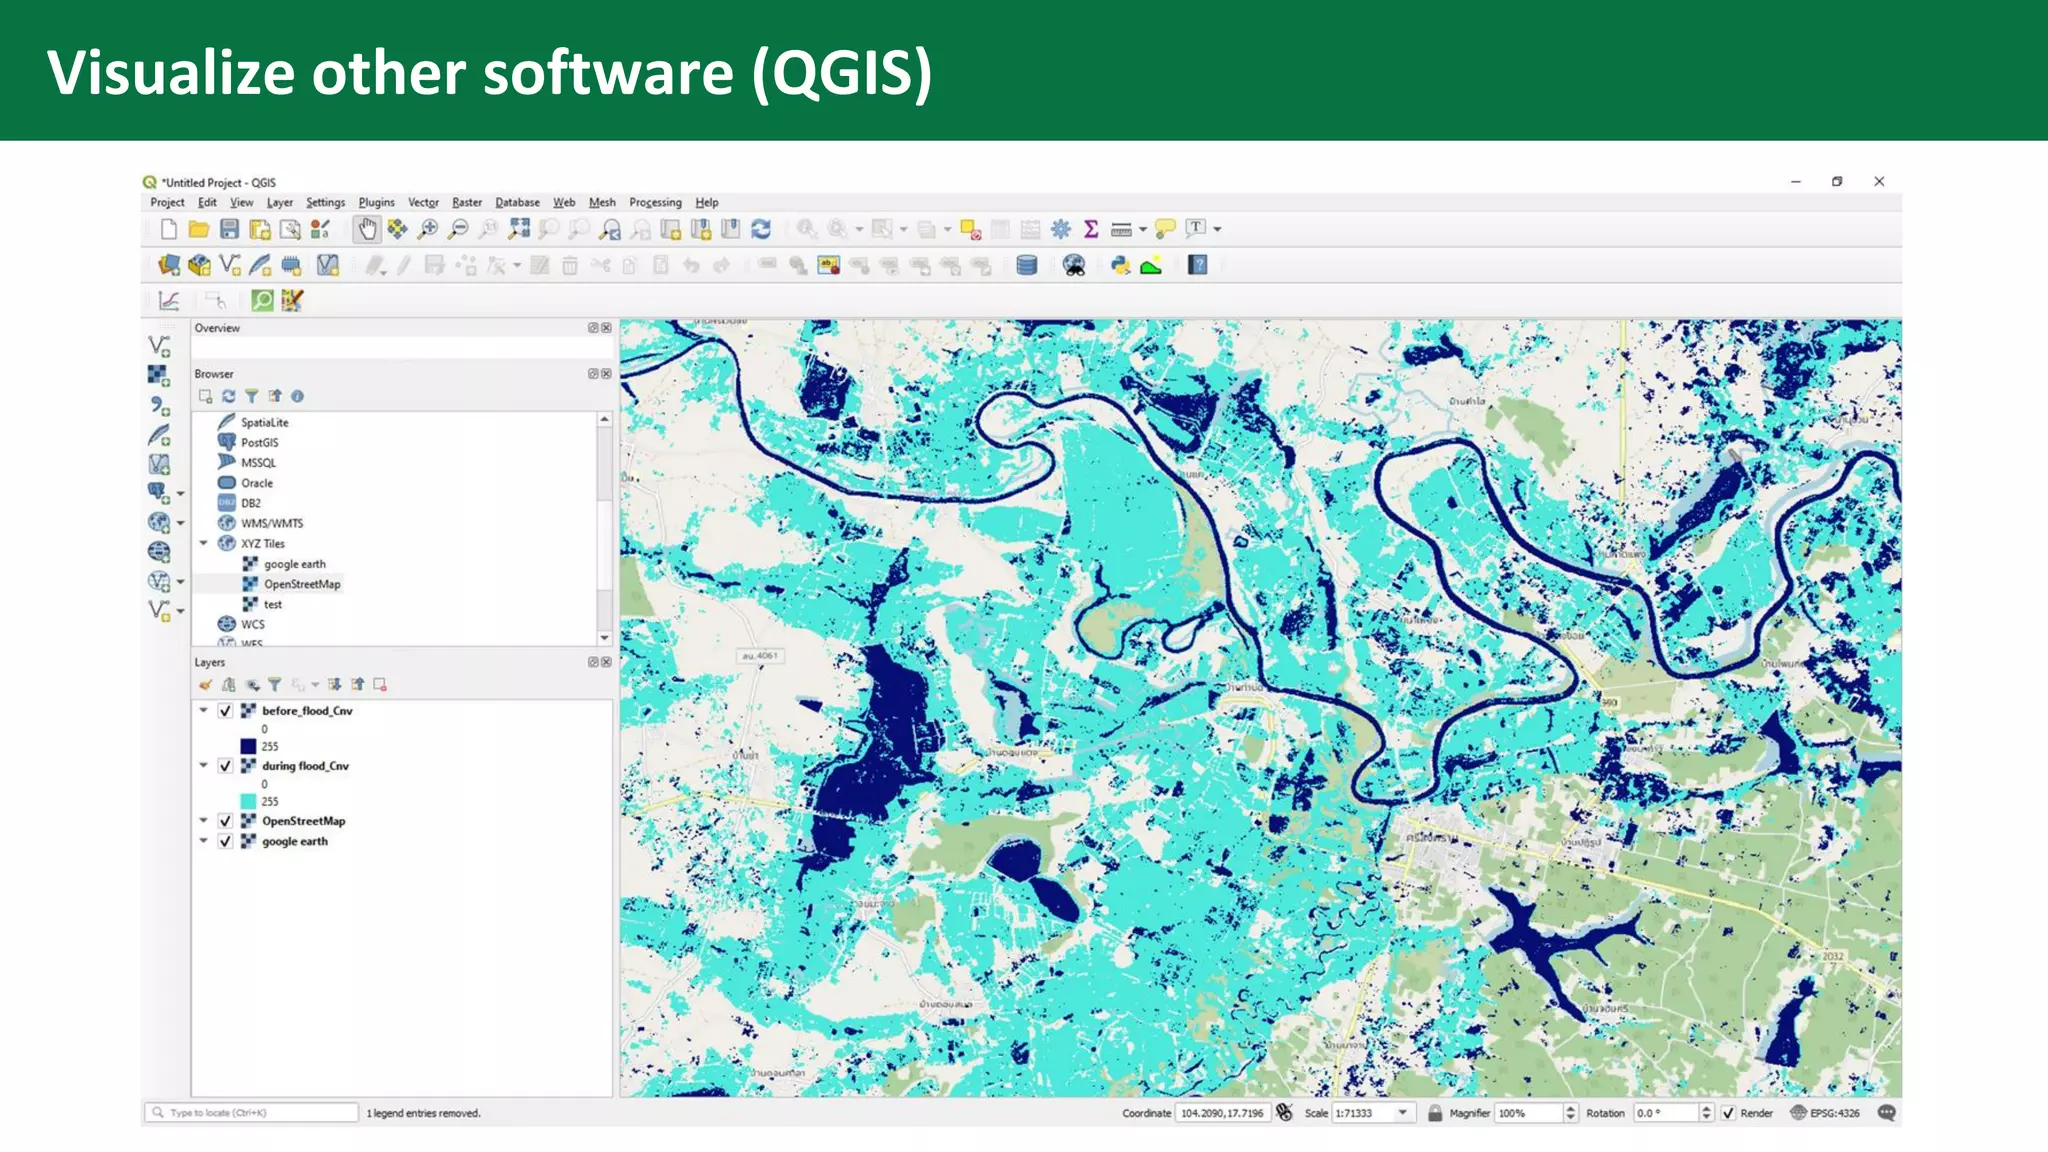
This content presents how to detect water or flood areas using ALOS-2 images before and during floods. First, it shows how to calibrate intensity to dB, find threshold value and apply to images.
9/8 THUR 10:45 | Statewide Regional Evacuation Study Program 4APA Florida
Marshall Flynn
With an updated Evacuation Study for each of the 11 regions, Florida has one of the only statewide evacuation studies in the Nation. This session will educate participants on its fundamentals,
including HOW and WHY it was created and its implementation across a variety of planning disciplines. Explanations of the major components of the Evacuation Study, including its complex
evacuation transportation models, statewide coordination, behavioral surveys, and associated behavioral assumptions and advanced GIS modeling tools. Planners will gain a better understanding of the purpose, data and methodology of the Studies and how to implement its findings in their planning documents.
This manual includes very basic features of Remote Sensing like LAYER STACK, BASIC FUNCTION, MULTISPECTRAL BAND COMBINATION& IMAGE ENHANCEMENT, IMAGE PRE-PROCESSING, BASIC IMAGE CORRECTION, NDVI, SUPERVISED AND UNSUPERVISED CLASSIFICATION, MOSAIC, MAP PRODUCTION
Knowledge brokering and knowledge products on the TCCIP platformJulia Barrott
This presentation by Joyce Chang and Wilson Lin showcases the latest knowledge brokering developments on the Taiwan Climate Change Projection Information and Adaptation Knowledge Platform (TCCIP).
This presentation was developed for the fourth virtual knowledge exchange of the KE4CAP project: https://www.weadapt.org/knowledge-base/climate-change-adaptation-knowledge-platforms/vke4-enhancing-knowledge-exchange
Application of OpenStreetMap in Disaster Risk ManagementNopphawanTamkuan
This content presents the four procedures were investigated in detail with an emphasis on simplicity for application to disaster management (download from OSM website, download using QGIS plugin, download a file converted to a universal file format (shapefile) and adding rendered map in the background). The use of these data for resilient urban planning are demonstrated including setting a hazard layer (flood Model), setting an exposure layer (population) and exposure analysis using InaSAFE plugin.
This content presents a guide to access satellite (Landsat-8) and microsatellite (Diwata), and how to use gdal and AROSIC (Python-based open-source software) for co-registration.
This content describes Call Detail Records (CDR) data format, data acquisition method, visualize in Mobmap and the applications for disaster management.
Disaster Damage Assessment and Recovery Monitoring Using Night-Time Light on GEENopphawanTamkuan
This content shows the possibility and useful cases of night-time light data to assess disaster damages and recovery in post-disaster situations such as Hokkaido earthquake, dam eruption in Laos and Kerala flood in India. Moreover, how to browse and profiling night-time light on GEE are demonstrated here.
This content presents for basic of Synthetic Aperture Radar (SAR) including its geometry, how the image is created, essential parameters, interpretation, SAR sensor specification, and advantages and disadvantages.
Differential SAR Interferometry Using Sentinel-1 Data for Kumamoto EarthquakeNopphawanTamkuan
This content presents step by step of Differential SAR Interferometry or DInSAR analysis in SNAP. The case study is Kumamoto Earthquake using Sentinel-1.
Earthquake Damage Detection Using SAR Interferometric CoherenceNopphawanTamkuan
This content presents how to apply interferometric analysis for damage detection. The case study is the Kumamoto earthquake in 2016. ALOS-2 images are used to calculate interferometric coherence, and estimate coherence change of images between before- and during earthquake to estimate possible degree of damage areas.
How to better understand SAR, interpret SAR products and realize the limitationsNopphawanTamkuan
This content shows how to better understand SAR (how to interpret SAR images and read SAR interferogram ). Moreover, capacities and limitations of SAR are discussed for each disaster emergency mapping (Flood, Landslide and Earthquake).
Differential SAR Interferometry Using ALOS-2 Data for Nepal EarthquakeNopphawanTamkuan
This content presents Differential SAR Interferometry or DInSAR analysis with GMTSAR (on Linux based OS, download DEM, prepare directories for processing). The case study is Nepal earthquake in 2015 using ALOS-2.
This content shows geospatial data sources for Japan and global data, coordinate reference system, and create a map of population density (Vector analysis: dissolve vector, join table, calculate area and population density.
Raster Analysis (Color Composite and Remote Sensing Indices)NopphawanTamkuan
This content shows how to download data from USGS explorer, color composition for Landsat-8 and Sentinel-2, extract specific area, and remote sensing indices (NDVI and NDWI) using raster calculator.
This content presents how to classify satellite image by QGIS Semi-automatic classification plugin. It includes pre-processing, create a region of interest (AOI), and applying classification methods.
This content provides basic python before starting geospatial analysis. It starts from data type, variable, basic coding, condition statement, loop, while, and how to read file.
The Art Pastor's Guide to Sabbath | Steve ThomasonSteve Thomason
What is the purpose of the Sabbath Law in the Torah. It is interesting to compare how the context of the law shifts from Exodus to Deuteronomy. Who gets to rest, and why?
Students, digital devices and success - Andreas Schleicher - 27 May 2024..pptxEduSkills OECD
Andreas Schleicher presents at the OECD webinar ‘Digital devices in schools: detrimental distraction or secret to success?’ on 27 May 2024. The presentation was based on findings from PISA 2022 results and the webinar helped launch the PISA in Focus ‘Managing screen time: How to protect and equip students against distraction’ https://www.oecd-ilibrary.org/education/managing-screen-time_7c225af4-en and the OECD Education Policy Perspective ‘Students, digital devices and success’ can be found here - https://oe.cd/il/5yV
This is a presentation by Dada Robert in a Your Skill Boost masterclass organised by the Excellence Foundation for South Sudan (EFSS) on Saturday, the 25th and Sunday, the 26th of May 2024.
He discussed the concept of quality improvement, emphasizing its applicability to various aspects of life, including personal, project, and program improvements. He defined quality as doing the right thing at the right time in the right way to achieve the best possible results and discussed the concept of the "gap" between what we know and what we do, and how this gap represents the areas we need to improve. He explained the scientific approach to quality improvement, which involves systematic performance analysis, testing and learning, and implementing change ideas. He also highlighted the importance of client focus and a team approach to quality improvement.
How to Split Bills in the Odoo 17 POS ModuleCeline George
Bills have a main role in point of sale procedure. It will help to track sales, handling payments and giving receipts to customers. Bill splitting also has an important role in POS. For example, If some friends come together for dinner and if they want to divide the bill then it is possible by POS bill splitting. This slide will show how to split bills in odoo 17 POS.
Instructions for Submissions thorugh G- Classroom.pptxJheel Barad
This presentation provides a briefing on how to upload submissions and documents in Google Classroom. It was prepared as part of an orientation for new Sainik School in-service teacher trainees. As a training officer, my goal is to ensure that you are comfortable and proficient with this essential tool for managing assignments and fostering student engagement.
Welcome to TechSoup New Member Orientation and Q&A (May 2024).pdfTechSoup
In this webinar you will learn how your organization can access TechSoup's wide variety of product discount and donation programs. From hardware to software, we'll give you a tour of the tools available to help your nonprofit with productivity, collaboration, financial management, donor tracking, security, and more.
The French Revolution, which began in 1789, was a period of radical social and political upheaval in France. It marked the decline of absolute monarchies, the rise of secular and democratic republics, and the eventual rise of Napoleon Bonaparte. This revolutionary period is crucial in understanding the transition from feudalism to modernity in Europe.
For more information, visit-www.vavaclasses.com
1. Center for Research and Application for Satellite Remote Sensing
Yamaguchi University
Flood Detection Using ALOS-2 Images
in SNAP
2. Flood in Thailand in 2018
• At the begin of August 2018, flood situation was reported in Asian
Disaster Reduction Center (ADRC) because heavy rain hit to the
northeast of Thailand. The flood affected nine provinces as a result of
heavy rain and overflow from the Mekong River. It highly affected in
Nakhon Phanom province with 12 districts, more than 12,000
households have been inundated and affected (ADRC, 2019).
https://www.adrc.asia/view_disaster_en.php?NationCode=&Lang=en&Key=2284
3. ALOS-2 Images
ALOS-2 on 6 April 2018
• ALOS2209010340-180406
ALOS-2 on 10 August 2018
• ALOS2227640340-180810
ALOS-2 images level 2.1
4. File → import → SAR sensors → ALOS-2 GEOTIFF (before and during flood images)
Open files
Before flood image
During flood image
9. Calibrate intensity to dB using band maths
In this material, we will demonstrate using HH image for water detection
Right click at “amplitude_HH” and then go to “band maths”
Do the same with another image.
13. Remove Speckle Noises
Set target name and its directory Select only dB_before in source bands. Then,
select filter for reducing speckle noise and
click run (do the same for dB_during)
14. Compare before and during flood images using multiple viewers
Before filtering
After filtering
Before flood During flood
15. Simple define threshold using histogram
Create geometry or sample area (select half water and half land) for defining threshold
16. Simple define threshold using histogram
Click image (dB_during) to active layer 🡪 go to tool bar “Analysis” 🡪 select “Histogram” 🡪 use ROI mask
🡪 refesh
17. Simple define threshold using histogram
Multi-temporal image may provide little bit different threshold value. From histogram, thresholding should be about -15.0 dB.
You can use more sample area or try to increase/decrease threshold to be appropriate to water area.
Threshold value
18. Apply thresholding by raster calculator
Click active image dB_during (applied filter) 🡪 right click “Band maths”
19. Apply thresholding by raster calculator
Click active image dB_during (applied filter) 🡪 right click “Band maths”