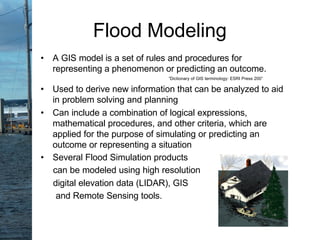
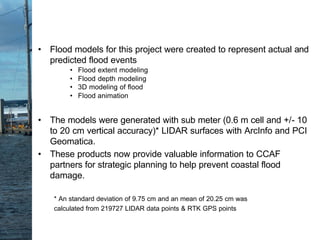
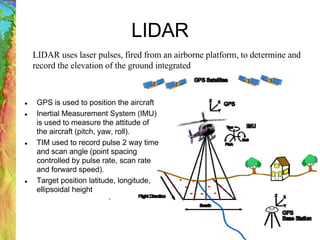
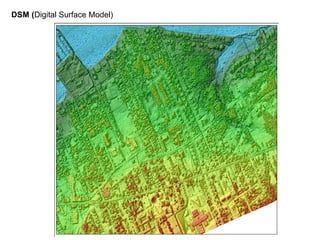
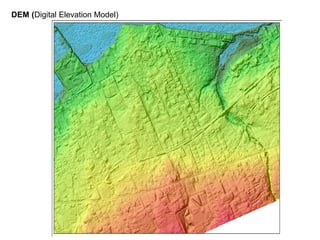
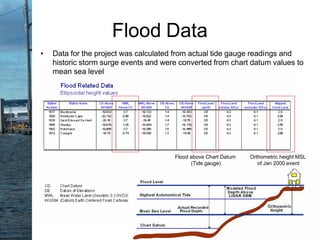
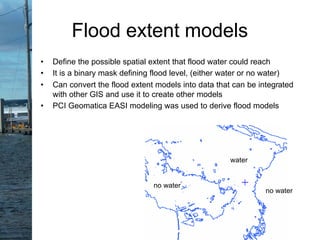
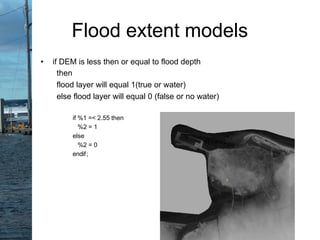
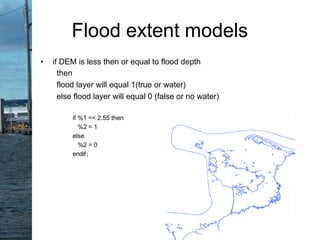
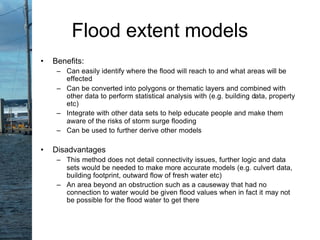
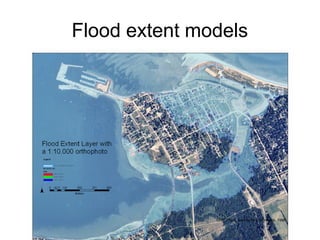
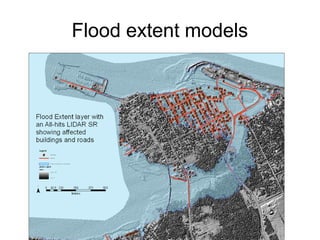
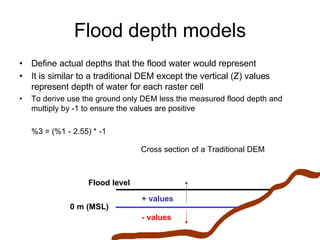
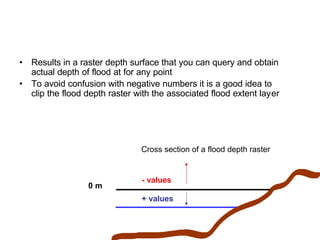
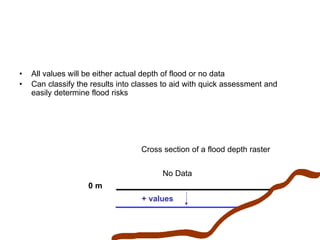
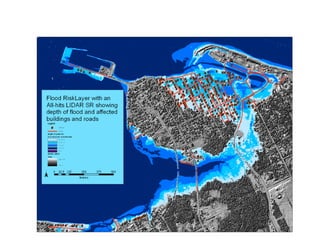
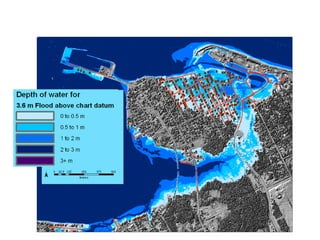
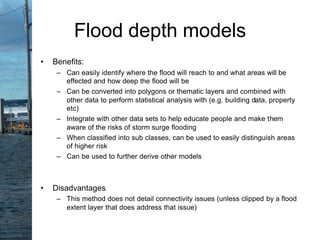
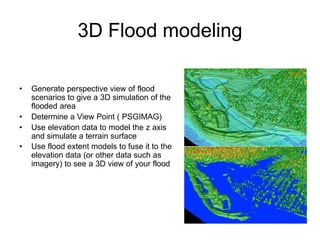
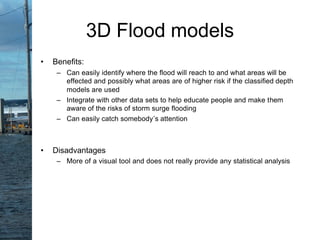
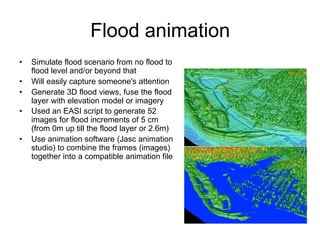
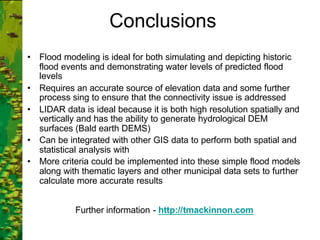
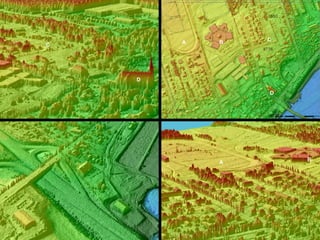
Flood ModelingFlood Modeling
withwith
High ResolutionHigh Resolution
LIDARLIDAR
Edward MacKinnon - http://tmackinnon.com
PCI Geomatics
• This presentation covers flood modeling with EASI modeling;
which was a major aspect of my extensive graduate work in
LIDAR research that lead to the completion of the Applied
Geomatics Research program at COGS / AGRG last year.
Further papers, presentations, images, animation, examples and
more on this project can be obtained from my website
http://tmackinnon.com or by contacting me directly.
• More information on the current status of the CCAF project that
my project was a major part of see http://atlantic-
web1.ns.ec.gc.ca/slr/default.asp?lang=En&n=61BB75EF-1 or
http://agrg.cogs.ns.ca/
• Storm surge are caused by changes
in sea-level produced by strong
winds and low atmospheric
pressures that cause coastal waters
to flood inland
• Are extremely powerful when they
coincide during peaks of high tides
and can cause extensive coastal
flooding.
• Maritimes are really susceptible to
these events and a January 2000,
storm surge event was the largest
on record for area and caused
extensive damage to the area
Storm Surges
Image, Dalhousie Storm Surge Forecast System
• The flooding of Jan. 2000 saw water levels rise to 3.62 m (CD) instead
of the expected 1.72 m (CD)
• On Jan 17, 2004 another significant event occurred, not as dramatic but
still caused extensive damage to some areas
• These events are not one time events, they continue to occur and SLR
is expected to increase the problem
Image: D. Forbes, 2002
2.7 Metres (Jan. 2004)
Photo: ATV News, 2000
Photo: B. Belliveau - The Weather Network, 2000
• Extensive flooding
caused havoc in many
coastal communities
• Water also flooded across
roads making access to the
area for rescue vehicles
near impossible
Photo: Weather Channel, 2000 Photo: M. Campbell, 2000
Photo: R. Leblanc, 2000Photo: R. Leblanc, 2000
• Ice piled up high causing damage to homes and infrastructure
Flood Level
Flood Modeling
• A GIS model is a set of rules and procedures for
representing a phenomenon or predicting an outcome.
”Dictionary of GIS terminology: ESRI Press 200”
• Used to derive new information that can be analyzed to aid
in problem solving and planning
• Can include a combination of logical expressions,
mathematical procedures, and other criteria, which are
applied for the purpose of simulating or predicting an
outcome or representing a situation
• Several Flood Simulation products
can be modeled using high resolution
digital elevation data (LIDAR), GIS
and Remote Sensing tools.
• Flood models for this project were created to represent actual and
predicted flood events
• Flood extent modeling
• Flood depth modeling
• 3D modeling of flood
• Flood animation
• The models were generated with sub meter (0.6 m cell and +/- 10
to 20 cm vertical accuracy)* LIDAR surfaces with ArcInfo and PCI
Geomatica.
• These products now provide valuable information to CCAF
partners for strategic planning to help prevent coastal flood
damage.
* An standard deviation of 9.75 cm and an mean of 20.25 cm was
calculated from 219727 LIDAR data points & RTK GPS points
LIDAR
l GPS is used to position the aircraft
l Inertial Measurement System (IMU)
is used to measure the attitude of
the aircraft (pitch, yaw, roll).
l TIM used to record pulse 2 way time
and scan angle (point spacing
controlled by pulse rate, scan rate
and forward speed).
l Target position latitude, longitude,
ellipsoidal height
LIDAR uses laser pulses, fired from an airborne platform, to determine and
record the elevation of the ground integrated
DSM (Digital Surface Model)
DEM (Digital Elevation Model)
Flood Data
Flood above Chart Datum
(Tide gauge)
Orthometric height MSL
of Jan 2000 event
• Data for the project was calculated from actual tide gauge readings and
historic storm surge events and were converted from chart datum values to
mean sea level
water
no water
no water
Flood extent models
• Define the possible spatial extent that flood water could reach
• It is a binary mask defining flood level, (either water or no water)
• Can convert the flood extent models into data that can be integrated
with other GIS and use it to create other models
• PCI Geomatica EASI modeling was used to derive flood models
• if DEM is less then or equal to flood depth
then
flood layer will equal 1(true or water)
else flood layer will equal 0 (false or no water)
if %1 =< 2.55 then
%2 = 1
else
%2 = 0
endif;
Flood extent models
• if DEM is less then or equal to flood depth
then
flood layer will equal 1(true or water)
else flood layer will equal 0 (false or no water)
if %1 =< 2.55 then
%2 = 1
else
%2 = 0
endif;
Flood extent models
• Benefits:
– Can easily identify where the flood will reach to and what areas will be
effected
– Can be converted into polygons or thematic layers and combined with
other data to perform statistical analysis with (e.g. building data, property
etc)
– Integrate with other data sets to help educate people and make them
aware of the risks of storm surge flooding
– Can be used to further derive other models
• Disadvantages
– This method does not detail connectivity issues, further logic and data
sets would be needed to make more accurate models (e.g. culvert data,
building footprint, outward flow of fresh water etc)
– An area beyond an obstruction such as a causeway that had no
connection to water would be given flood values when in fact it may not
be possible for the flood water to get there
Flood extent models
Ortho Photo: Service New Brunswick, 1999
Flood extent models
Flood extent models
Flood depth models
• Define actual depths that the flood water would represent
• It is similar to a traditional DEM except the vertical (Z) values
represent depth of water for each raster cell
• To derive use the ground only DEM less the measured flood depth and
multiply by -1 to ensure the values are positive
%3 = (%1 - 2.55) * -1
0 m (MSL)
Flood level
- values
+ values
Cross section of a Traditional DEM
• Results in a raster depth surface that you can query and obtain
actual depth of flood at for any point
• To avoid confusion with negative numbers it is a good idea to
clip the flood depth raster with the associated flood extent layer
0 m
+ values
- values
Cross section of a flood depth raster
0 m
+ values
- values
Cross section of a flood depth raster
No Data
• All values will be either actual depth of flood or no data
• Can classify the results into classes to aid with quick assessment and
easily determine flood risks
• Benefits:
– Can easily identify where the flood will reach to and what areas will be
effected and how deep the flood will be
– Can be converted into polygons or thematic layers and combined with
other data to perform statistical analysis with (e.g. building data, property
etc)
– Integrate with other data sets to help educate people and make them
aware of the risks of storm surge flooding
– When classified into sub classes, can be used to easily distinguish areas
of higher risk
– Can be used to further derive other models
• Disadvantages
– This method does not detail connectivity issues (unless clipped by a flood
extent layer that does address that issue)
Flood depth models
3D Flood modeling
• Generate perspective view of flood
scenarios to give a 3D simulation of the
flooded area
• Determine a View Point ( PSGIMAG)
• Use elevation data to model the z axis
and simulate a terrain surface
• Use flood extent models to fuse it to the
elevation data (or other data such as
imagery) to see a 3D view of your flood
• Benefits:
– Can easily identify where the flood will reach to and what areas will be
effected and possibly what areas are of higher risk if the classified depth
models are used
– Integrate with other data sets to help educate people and make them
aware of the risks of storm surge flooding
– Can easily catch somebody’s attention
• Disadvantages
– More of a visual tool and does not really provide any statistical analysis
3D Flood models
Flood animation
• Simulate flood scenario from no flood to
flood level and/or beyond that
• Will easily capture someone's attention
• Generate 3D flood views, fuse the flood
layer with elevation model or imagery
• Used an EASI script to generate 52
images for flood increments of 5 cm
(from 0m up till the flood layer or 2.6m)
• Use animation software (Jasc animation
studio) to combine the frames (images)
together into a compatible animation file
Conclusions
• Flood modeling is ideal for both simulating and depicting historic
flood events and demonstrating water levels of predicted flood
levels
• Requires an accurate source of elevation data and some further
process sing to ensure that the connectivity issue is addressed
• LIDAR data is ideal because it is both high resolution spatially and
vertically and has the ability to generate hydrological DEM
surfaces (Bald earth DEMS)
• Can be integrated with other GIS data to perform both spatial and
statistical analysis with
• More criteria could be implemented into these simple flood models
along with thematic layers and other municipal data sets to further
calculate more accurate results
Further information - http://tmackinnon.com
D
D
B
B
C
C
A
A

Mac Kinnon Cig2005 Presentation

  • 1.
    Flood ModelingFlood Modeling withwith HighResolutionHigh Resolution LIDARLIDAR Edward MacKinnon - http://tmackinnon.com PCI Geomatics
  • 2.
    • This presentationcovers flood modeling with EASI modeling; which was a major aspect of my extensive graduate work in LIDAR research that lead to the completion of the Applied Geomatics Research program at COGS / AGRG last year. Further papers, presentations, images, animation, examples and more on this project can be obtained from my website http://tmackinnon.com or by contacting me directly. • More information on the current status of the CCAF project that my project was a major part of see http://atlantic- web1.ns.ec.gc.ca/slr/default.asp?lang=En&n=61BB75EF-1 or http://agrg.cogs.ns.ca/
  • 3.
    • Storm surgeare caused by changes in sea-level produced by strong winds and low atmospheric pressures that cause coastal waters to flood inland • Are extremely powerful when they coincide during peaks of high tides and can cause extensive coastal flooding. • Maritimes are really susceptible to these events and a January 2000, storm surge event was the largest on record for area and caused extensive damage to the area Storm Surges Image, Dalhousie Storm Surge Forecast System
  • 4.
    • The floodingof Jan. 2000 saw water levels rise to 3.62 m (CD) instead of the expected 1.72 m (CD) • On Jan 17, 2004 another significant event occurred, not as dramatic but still caused extensive damage to some areas • These events are not one time events, they continue to occur and SLR is expected to increase the problem Image: D. Forbes, 2002 2.7 Metres (Jan. 2004)
  • 5.
    Photo: ATV News,2000 Photo: B. Belliveau - The Weather Network, 2000 • Extensive flooding caused havoc in many coastal communities • Water also flooded across roads making access to the area for rescue vehicles near impossible
  • 6.
    Photo: Weather Channel,2000 Photo: M. Campbell, 2000 Photo: R. Leblanc, 2000Photo: R. Leblanc, 2000 • Ice piled up high causing damage to homes and infrastructure Flood Level
  • 7.
    Flood Modeling • AGIS model is a set of rules and procedures for representing a phenomenon or predicting an outcome. ”Dictionary of GIS terminology: ESRI Press 200” • Used to derive new information that can be analyzed to aid in problem solving and planning • Can include a combination of logical expressions, mathematical procedures, and other criteria, which are applied for the purpose of simulating or predicting an outcome or representing a situation • Several Flood Simulation products can be modeled using high resolution digital elevation data (LIDAR), GIS and Remote Sensing tools.
  • 8.
    • Flood modelsfor this project were created to represent actual and predicted flood events • Flood extent modeling • Flood depth modeling • 3D modeling of flood • Flood animation • The models were generated with sub meter (0.6 m cell and +/- 10 to 20 cm vertical accuracy)* LIDAR surfaces with ArcInfo and PCI Geomatica. • These products now provide valuable information to CCAF partners for strategic planning to help prevent coastal flood damage. * An standard deviation of 9.75 cm and an mean of 20.25 cm was calculated from 219727 LIDAR data points & RTK GPS points
  • 9.
    LIDAR l GPS isused to position the aircraft l Inertial Measurement System (IMU) is used to measure the attitude of the aircraft (pitch, yaw, roll). l TIM used to record pulse 2 way time and scan angle (point spacing controlled by pulse rate, scan rate and forward speed). l Target position latitude, longitude, ellipsoidal height LIDAR uses laser pulses, fired from an airborne platform, to determine and record the elevation of the ground integrated
  • 10.
  • 11.
  • 12.
    Flood Data Flood aboveChart Datum (Tide gauge) Orthometric height MSL of Jan 2000 event • Data for the project was calculated from actual tide gauge readings and historic storm surge events and were converted from chart datum values to mean sea level
  • 13.
    water no water no water Floodextent models • Define the possible spatial extent that flood water could reach • It is a binary mask defining flood level, (either water or no water) • Can convert the flood extent models into data that can be integrated with other GIS and use it to create other models • PCI Geomatica EASI modeling was used to derive flood models
  • 14.
    • if DEMis less then or equal to flood depth then flood layer will equal 1(true or water) else flood layer will equal 0 (false or no water) if %1 =< 2.55 then %2 = 1 else %2 = 0 endif; Flood extent models
  • 15.
    • if DEMis less then or equal to flood depth then flood layer will equal 1(true or water) else flood layer will equal 0 (false or no water) if %1 =< 2.55 then %2 = 1 else %2 = 0 endif; Flood extent models
  • 16.
    • Benefits: – Caneasily identify where the flood will reach to and what areas will be effected – Can be converted into polygons or thematic layers and combined with other data to perform statistical analysis with (e.g. building data, property etc) – Integrate with other data sets to help educate people and make them aware of the risks of storm surge flooding – Can be used to further derive other models • Disadvantages – This method does not detail connectivity issues, further logic and data sets would be needed to make more accurate models (e.g. culvert data, building footprint, outward flow of fresh water etc) – An area beyond an obstruction such as a causeway that had no connection to water would be given flood values when in fact it may not be possible for the flood water to get there Flood extent models
  • 17.
    Ortho Photo: ServiceNew Brunswick, 1999 Flood extent models
  • 18.
  • 19.
    Flood depth models •Define actual depths that the flood water would represent • It is similar to a traditional DEM except the vertical (Z) values represent depth of water for each raster cell • To derive use the ground only DEM less the measured flood depth and multiply by -1 to ensure the values are positive %3 = (%1 - 2.55) * -1 0 m (MSL) Flood level - values + values Cross section of a Traditional DEM
  • 20.
    • Results ina raster depth surface that you can query and obtain actual depth of flood at for any point • To avoid confusion with negative numbers it is a good idea to clip the flood depth raster with the associated flood extent layer 0 m + values - values Cross section of a flood depth raster
  • 21.
    0 m + values -values Cross section of a flood depth raster No Data • All values will be either actual depth of flood or no data • Can classify the results into classes to aid with quick assessment and easily determine flood risks
  • 24.
    • Benefits: – Caneasily identify where the flood will reach to and what areas will be effected and how deep the flood will be – Can be converted into polygons or thematic layers and combined with other data to perform statistical analysis with (e.g. building data, property etc) – Integrate with other data sets to help educate people and make them aware of the risks of storm surge flooding – When classified into sub classes, can be used to easily distinguish areas of higher risk – Can be used to further derive other models • Disadvantages – This method does not detail connectivity issues (unless clipped by a flood extent layer that does address that issue) Flood depth models
  • 25.
    3D Flood modeling •Generate perspective view of flood scenarios to give a 3D simulation of the flooded area • Determine a View Point ( PSGIMAG) • Use elevation data to model the z axis and simulate a terrain surface • Use flood extent models to fuse it to the elevation data (or other data such as imagery) to see a 3D view of your flood
  • 26.
    • Benefits: – Caneasily identify where the flood will reach to and what areas will be effected and possibly what areas are of higher risk if the classified depth models are used – Integrate with other data sets to help educate people and make them aware of the risks of storm surge flooding – Can easily catch somebody’s attention • Disadvantages – More of a visual tool and does not really provide any statistical analysis 3D Flood models
  • 27.
    Flood animation • Simulateflood scenario from no flood to flood level and/or beyond that • Will easily capture someone's attention • Generate 3D flood views, fuse the flood layer with elevation model or imagery • Used an EASI script to generate 52 images for flood increments of 5 cm (from 0m up till the flood layer or 2.6m) • Use animation software (Jasc animation studio) to combine the frames (images) together into a compatible animation file
  • 28.
    Conclusions • Flood modelingis ideal for both simulating and depicting historic flood events and demonstrating water levels of predicted flood levels • Requires an accurate source of elevation data and some further process sing to ensure that the connectivity issue is addressed • LIDAR data is ideal because it is both high resolution spatially and vertically and has the ability to generate hydrological DEM surfaces (Bald earth DEMS) • Can be integrated with other GIS data to perform both spatial and statistical analysis with • More criteria could be implemented into these simple flood models along with thematic layers and other municipal data sets to further calculate more accurate results Further information - http://tmackinnon.com
  • 29.