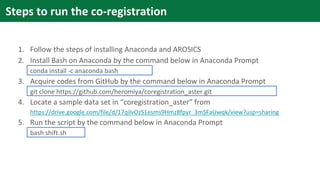
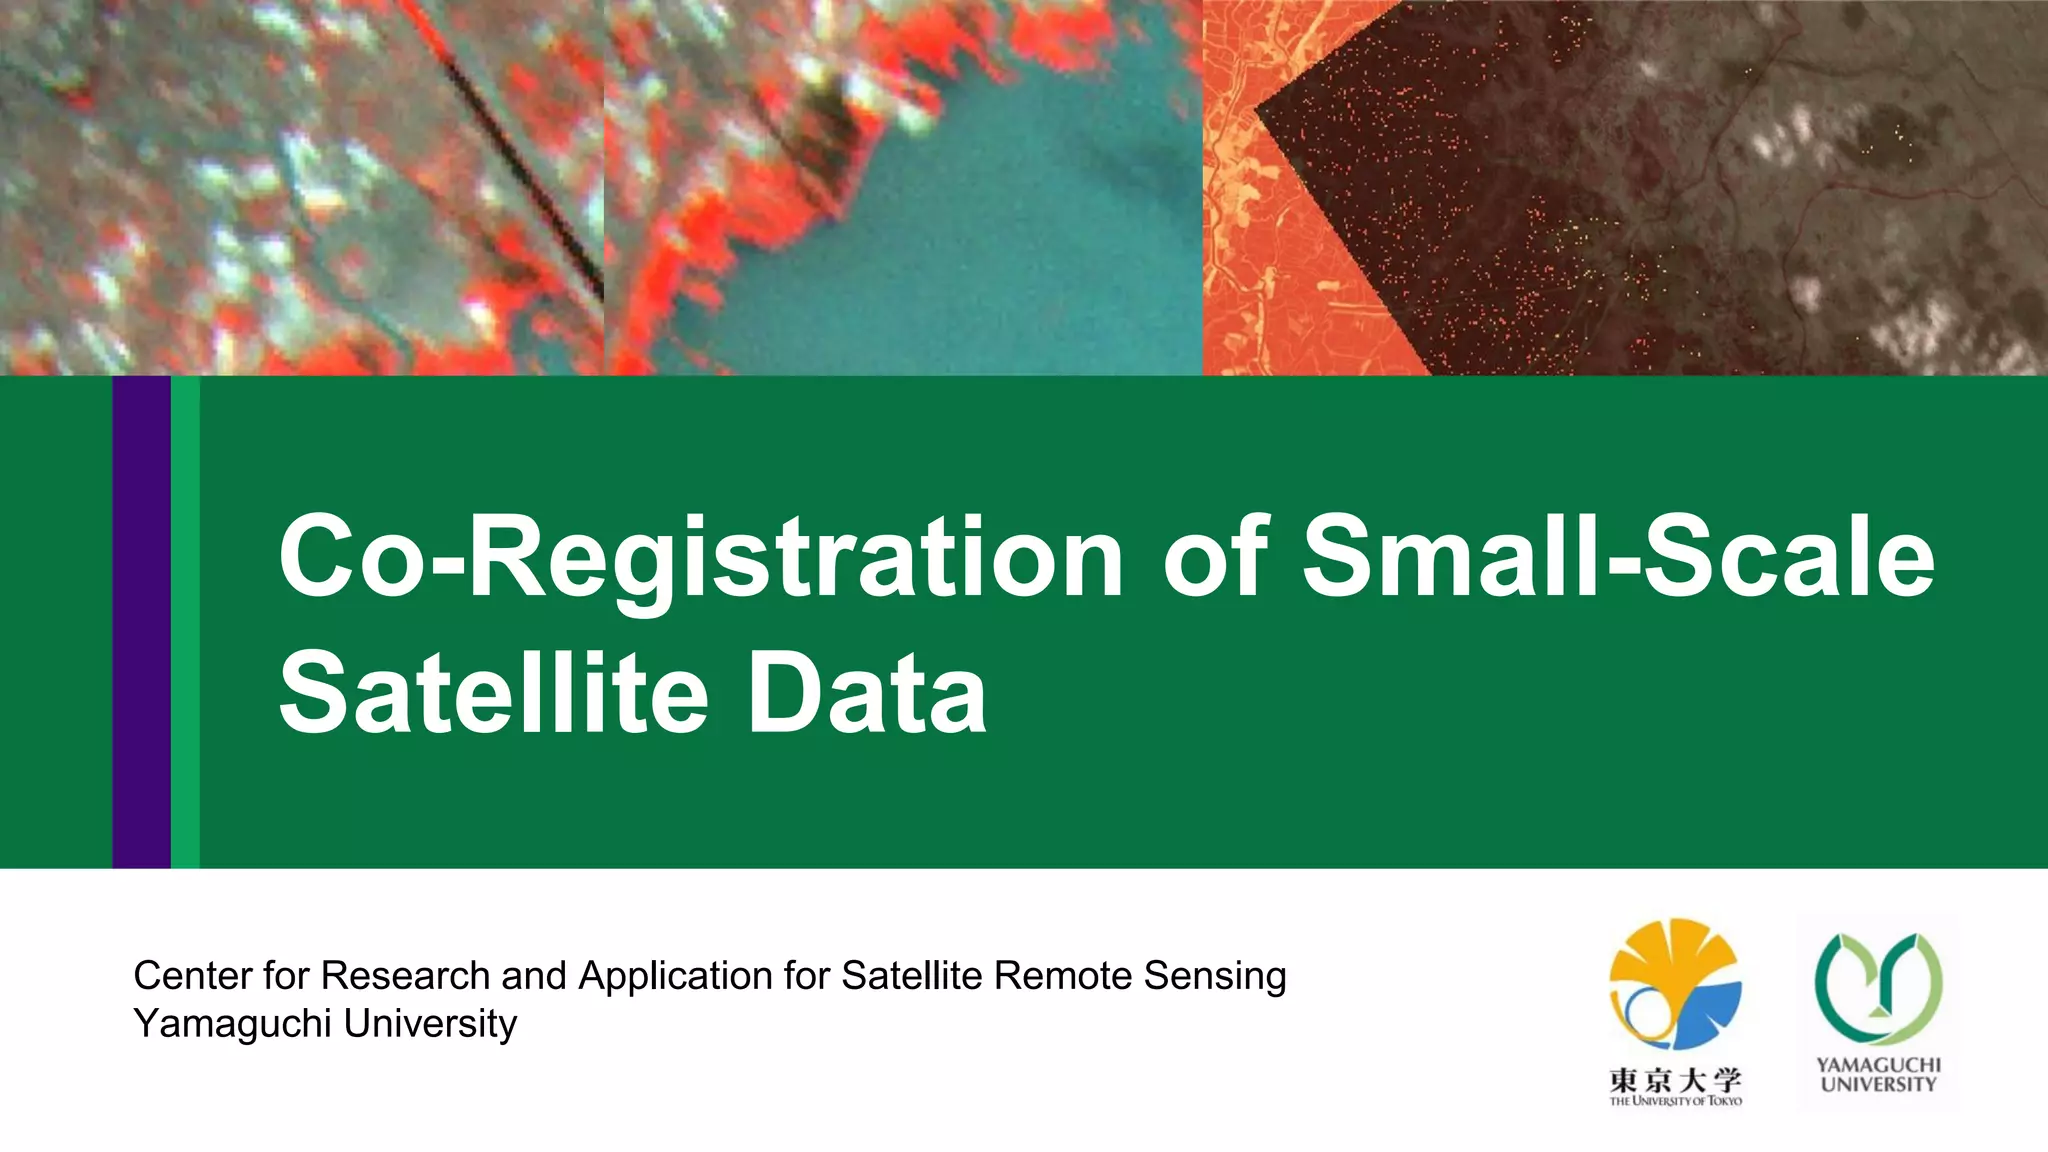
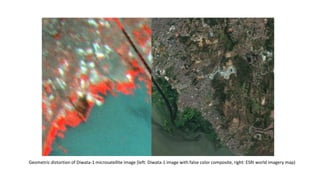
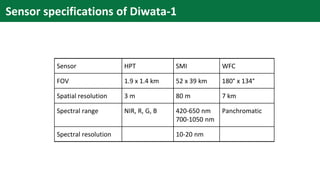
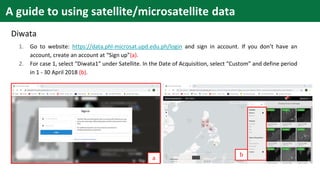
The document discusses small-scale satellites, highlighting their benefits in remote sensing, such as low cost and frequent image capture, along with their limitations. It outlines the co-registration process for satellite data, particularly for the Diwata and Hodoyoshi-1 satellites, while providing guidelines for data access, usage, and analysis. Additionally, it includes technical details on satellite specifications and instructions for software installation to facilitate image processing.

![conda create --name arosics
conda activate arosics
conda install -c conda-forge python numpy gdal scikit-image matplotlib
pyproj "shapely<=1.6.4" geopandas pandas cmocean
conda install -c conda-forge pyfftw
pip install arosics
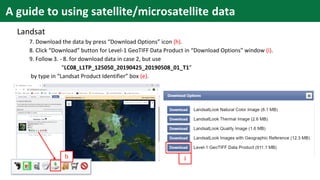
python [installation path of Anaconda]envsarosicsScriptsarosics_cli.py
Installation of AROSICS and prerequisites
• Open Anaconda prompt
A guide to using satellite/microsatellite data](https://image.slidesharecdn.com/ut03-220506075533-0fb5a1ea/85/Co-Registration-of-Small-Scale-Satellite-Data-14-320.jpg)
![Layer stacking the Diwata data
Example:
● Stack output: The result name “XXXX.tif”
● NIR of Diwata:
[Path of Diwata NIR]D1_SMI_2018-04-19T073107096_N840.tif
● Red band of Diwata:
[Path of Diwata Red band]D1_SMI_2018-04-19T073107046_V670.tif
gdal_merge.py -o [stack output] -separate [NIR of Diwata] [Red band of
Diwata
A guide to using satellite/microsatellite data](https://image.slidesharecdn.com/ut03-220506075533-0fb5a1ea/85/Co-Registration-of-Small-Scale-Satellite-Data-15-320.jpg)
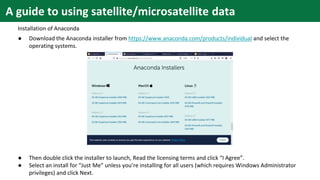
![Example:
● Reference Landsat:
[Path of Landsat
image]LC08_L1TP_116050_20180306_20180319_01_T1_B5.TIF
● Target Diwata image to be shifted:
[Path of Diwata image to be shifted]XXXX.tif
Coregistration by AROSICS
python [installation path of Anaconda]envsarosicsScriptsarosics_
cli.py local -nodata 0 0 -ws 1024 1024 -max_shift 300 -max_points 2000
-bs 1 -min_reliability 20 [reference Landsat] [target Diwata image to
be shifted] 1
A guide to using satellite/microsatellite data](https://image.slidesharecdn.com/ut03-220506075533-0fb5a1ea/85/Co-Registration-of-Small-Scale-Satellite-Data-16-320.jpg)
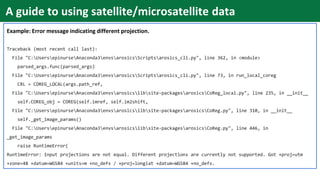
![NOTE: In case of [error message indicating different projection], it should be transform coordinate reference
system of the data by the command below.
gdalwarp -t_srs [Target CRS] -r cubic [input Diwata] [output transformed]
Example:
● Target CRS for Landsat data, such as EPSG:32648
● Input diwata:
[Path of input Diwata]D1_SMI_2018-04-19T073107096_N840_L1C.tif
● Output transformed:
[Path to collect output transformed]D1_SMI_2018-04-
19T073107096_N840_L1C.transformed.tif
A guide to using satellite/microsatellite data](https://image.slidesharecdn.com/ut03-220506075533-0fb5a1ea/85/Co-Registration-of-Small-Scale-Satellite-Data-17-320.jpg)