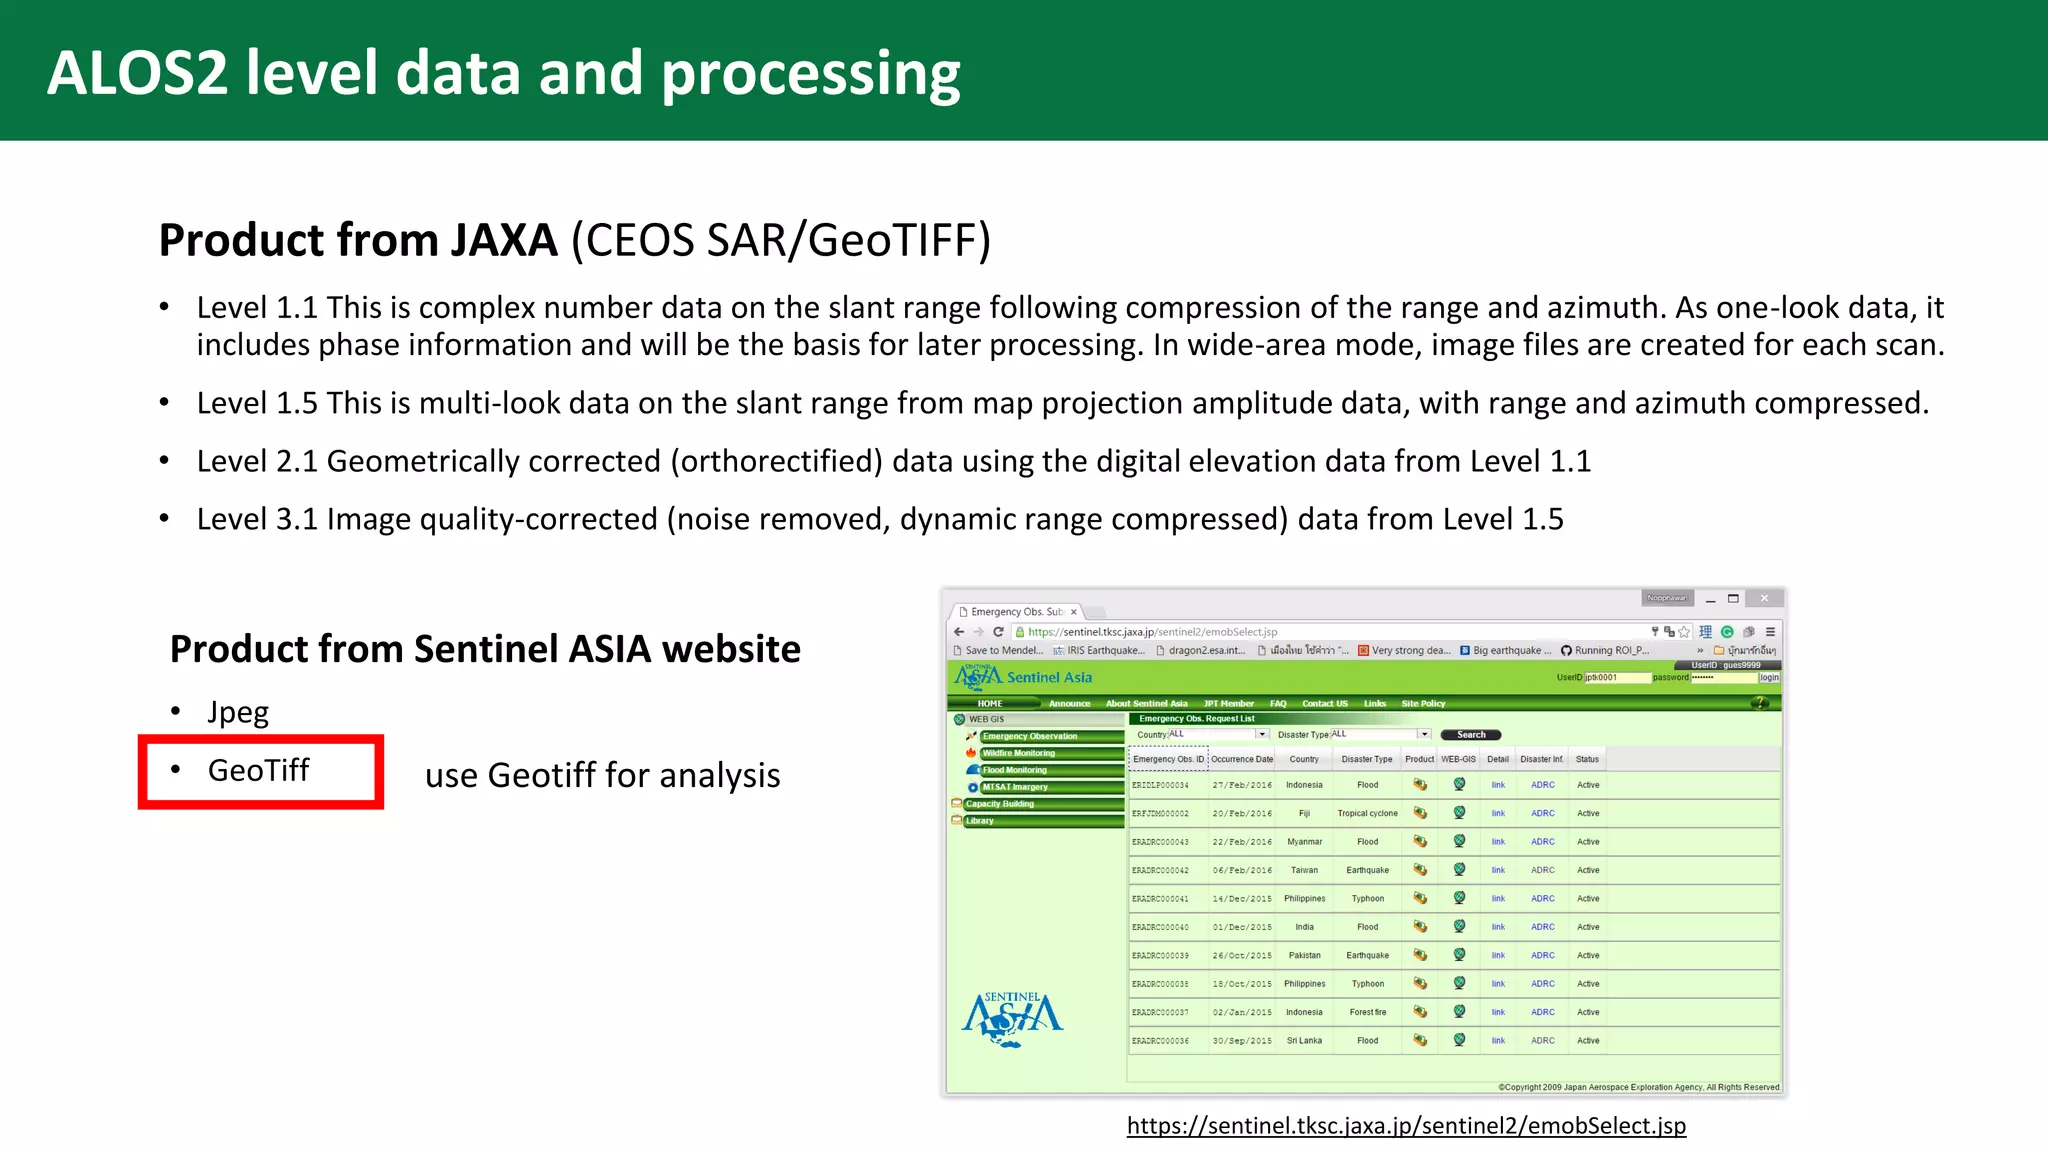
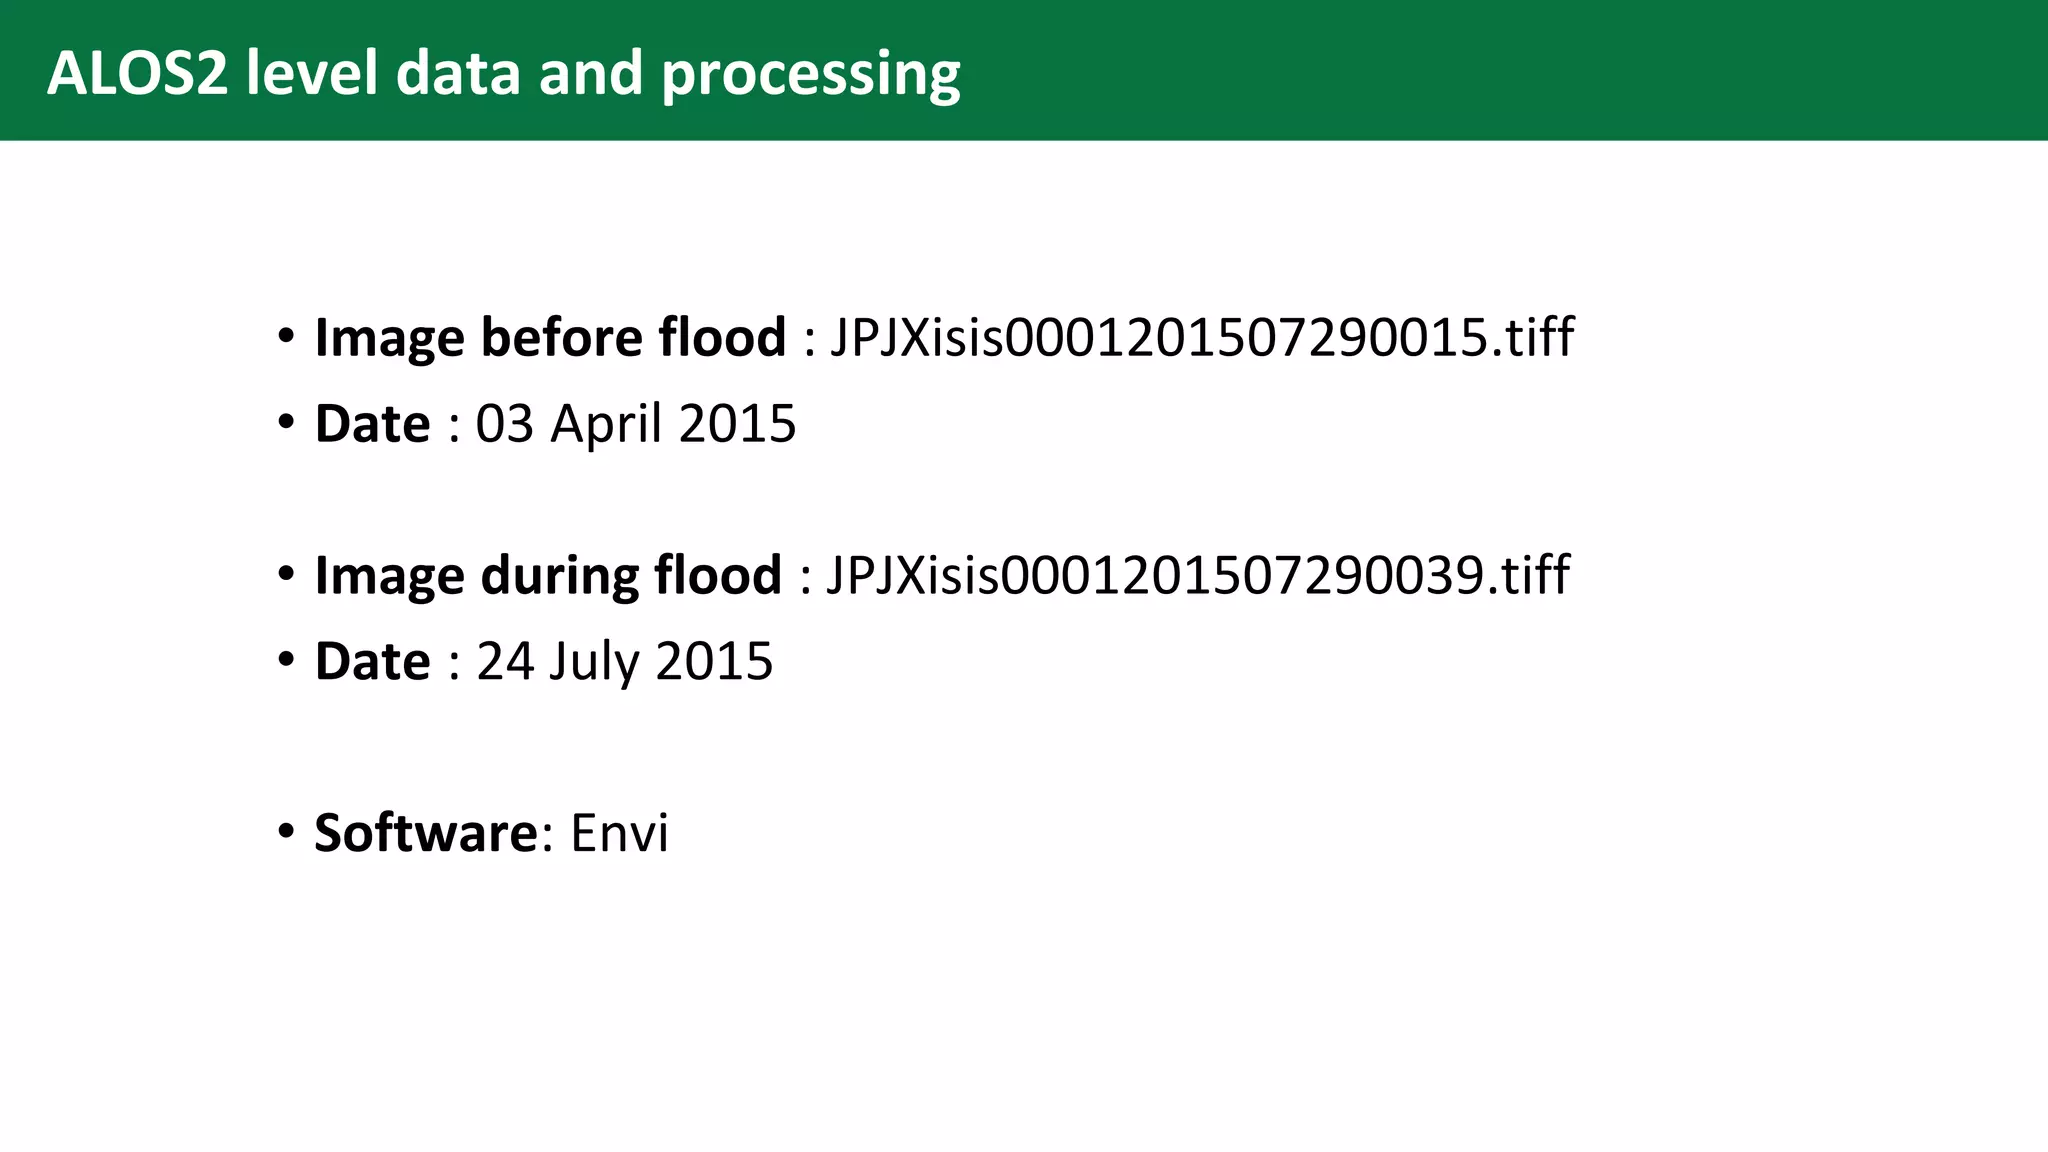
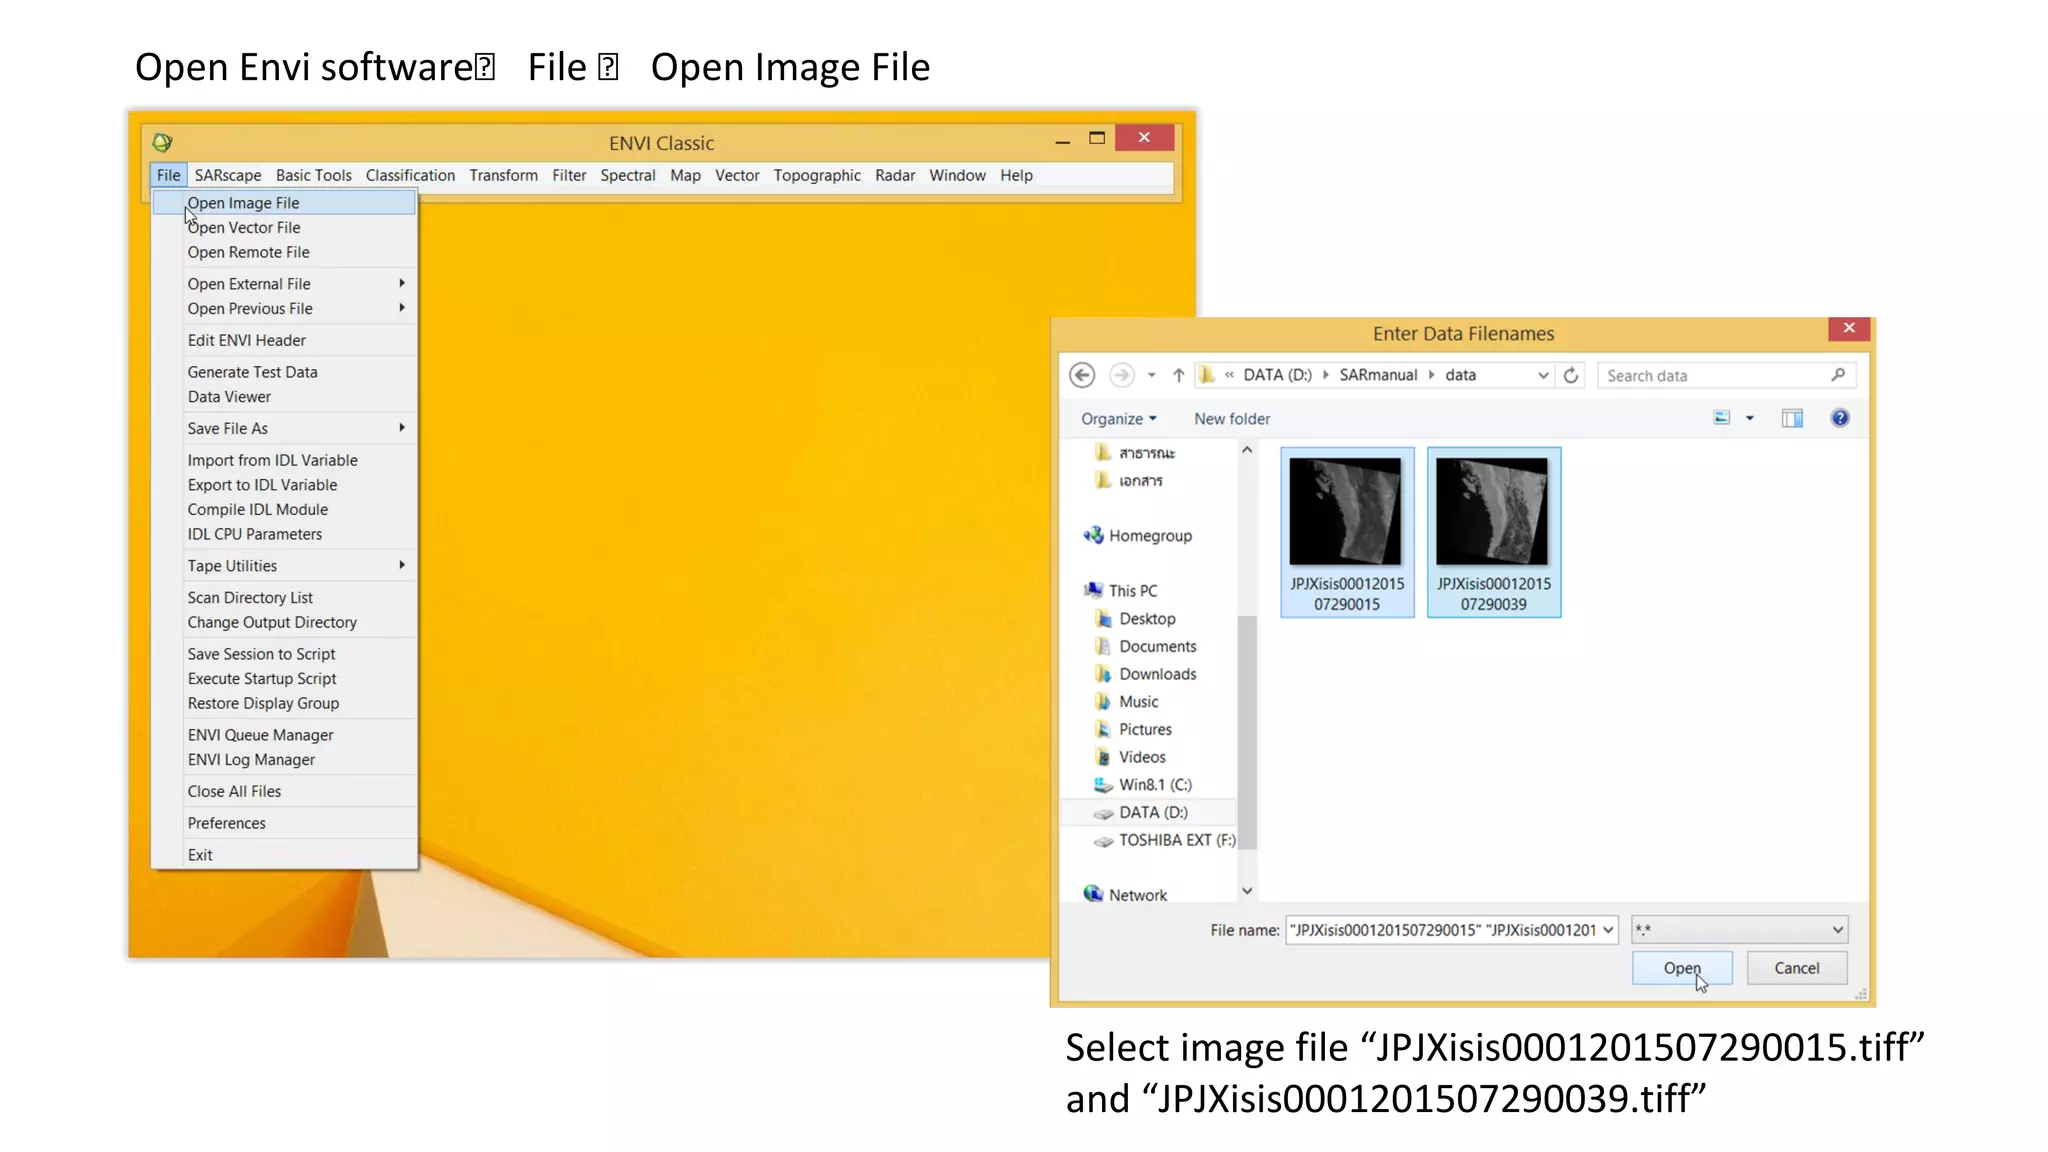
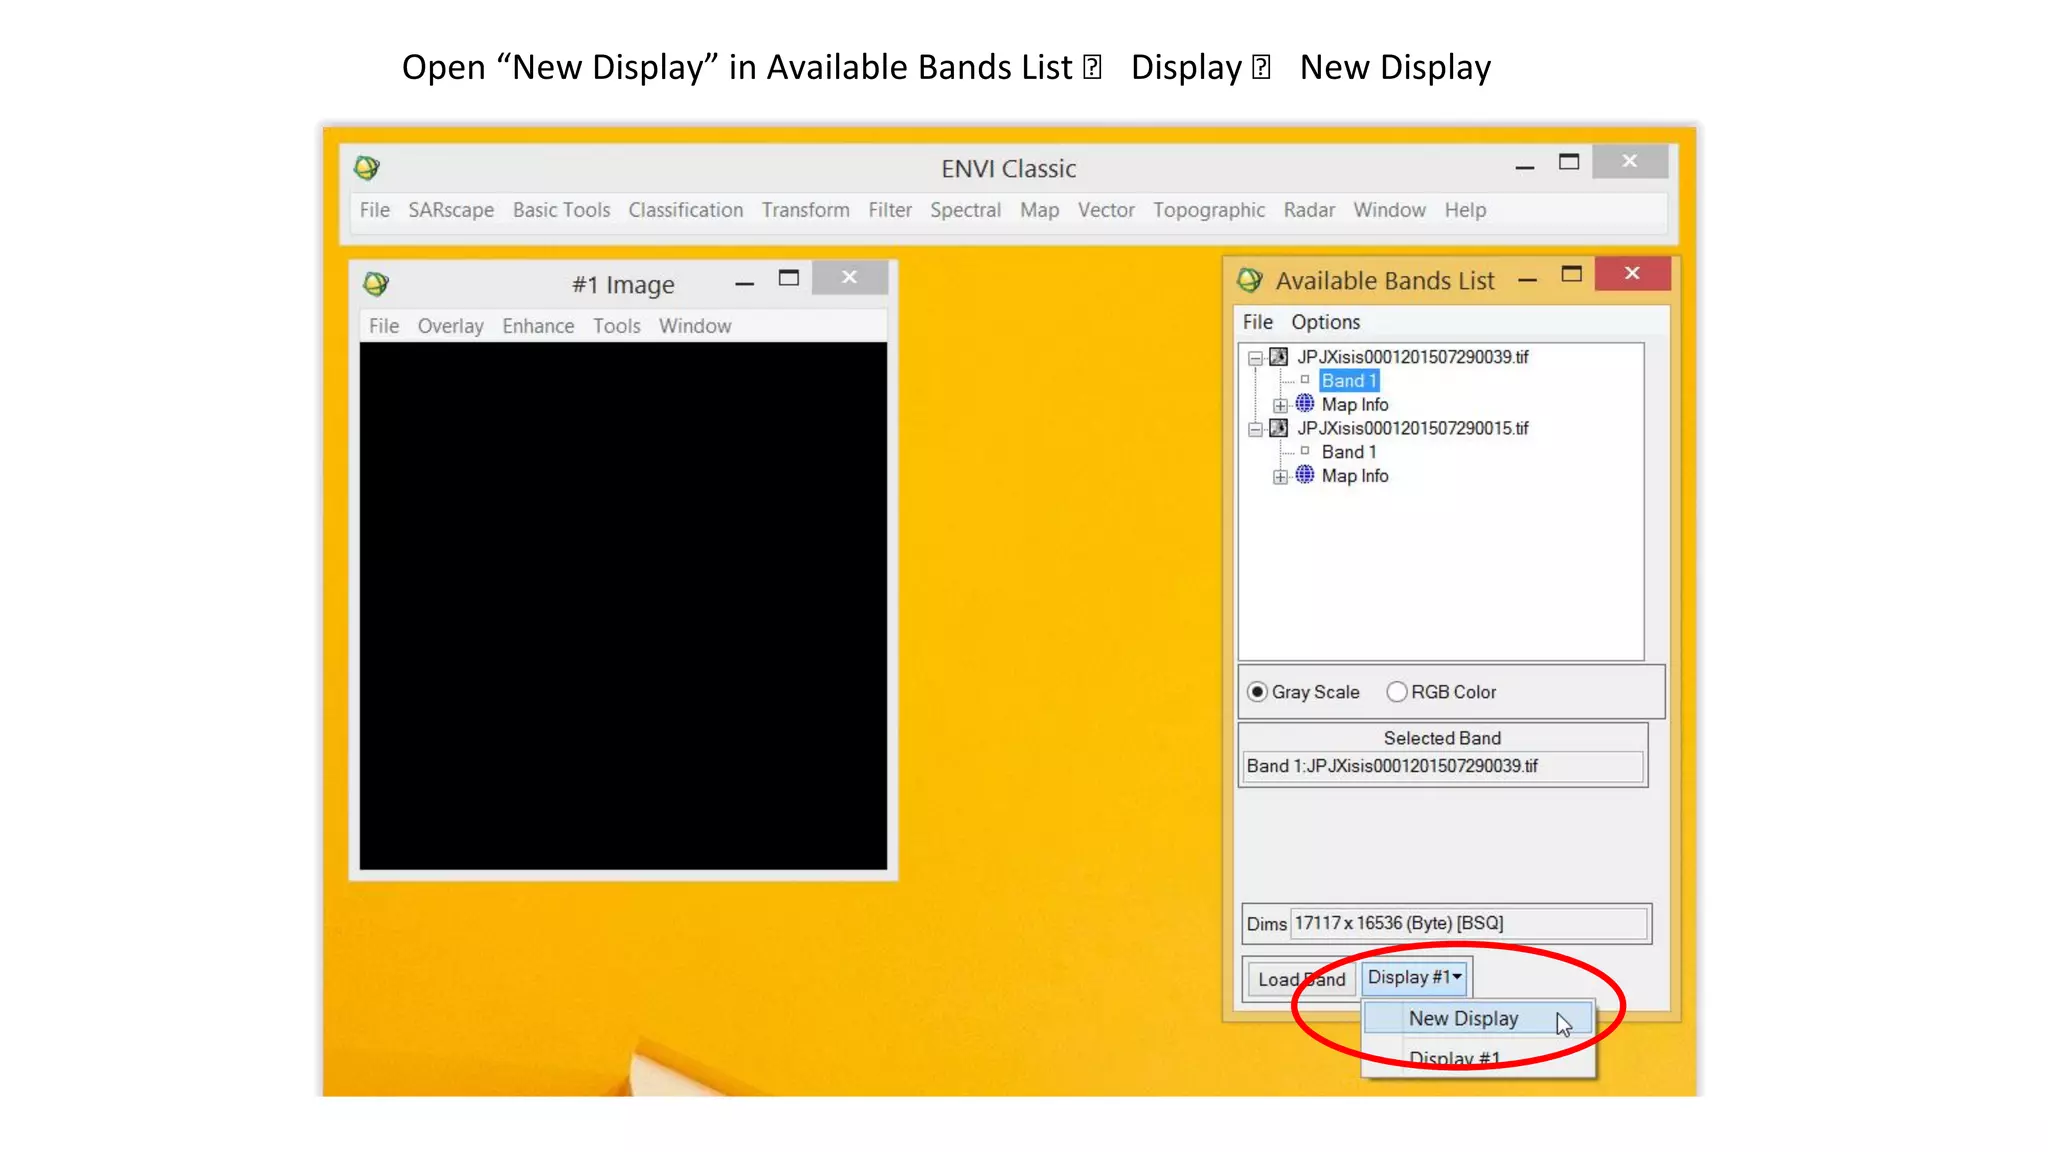
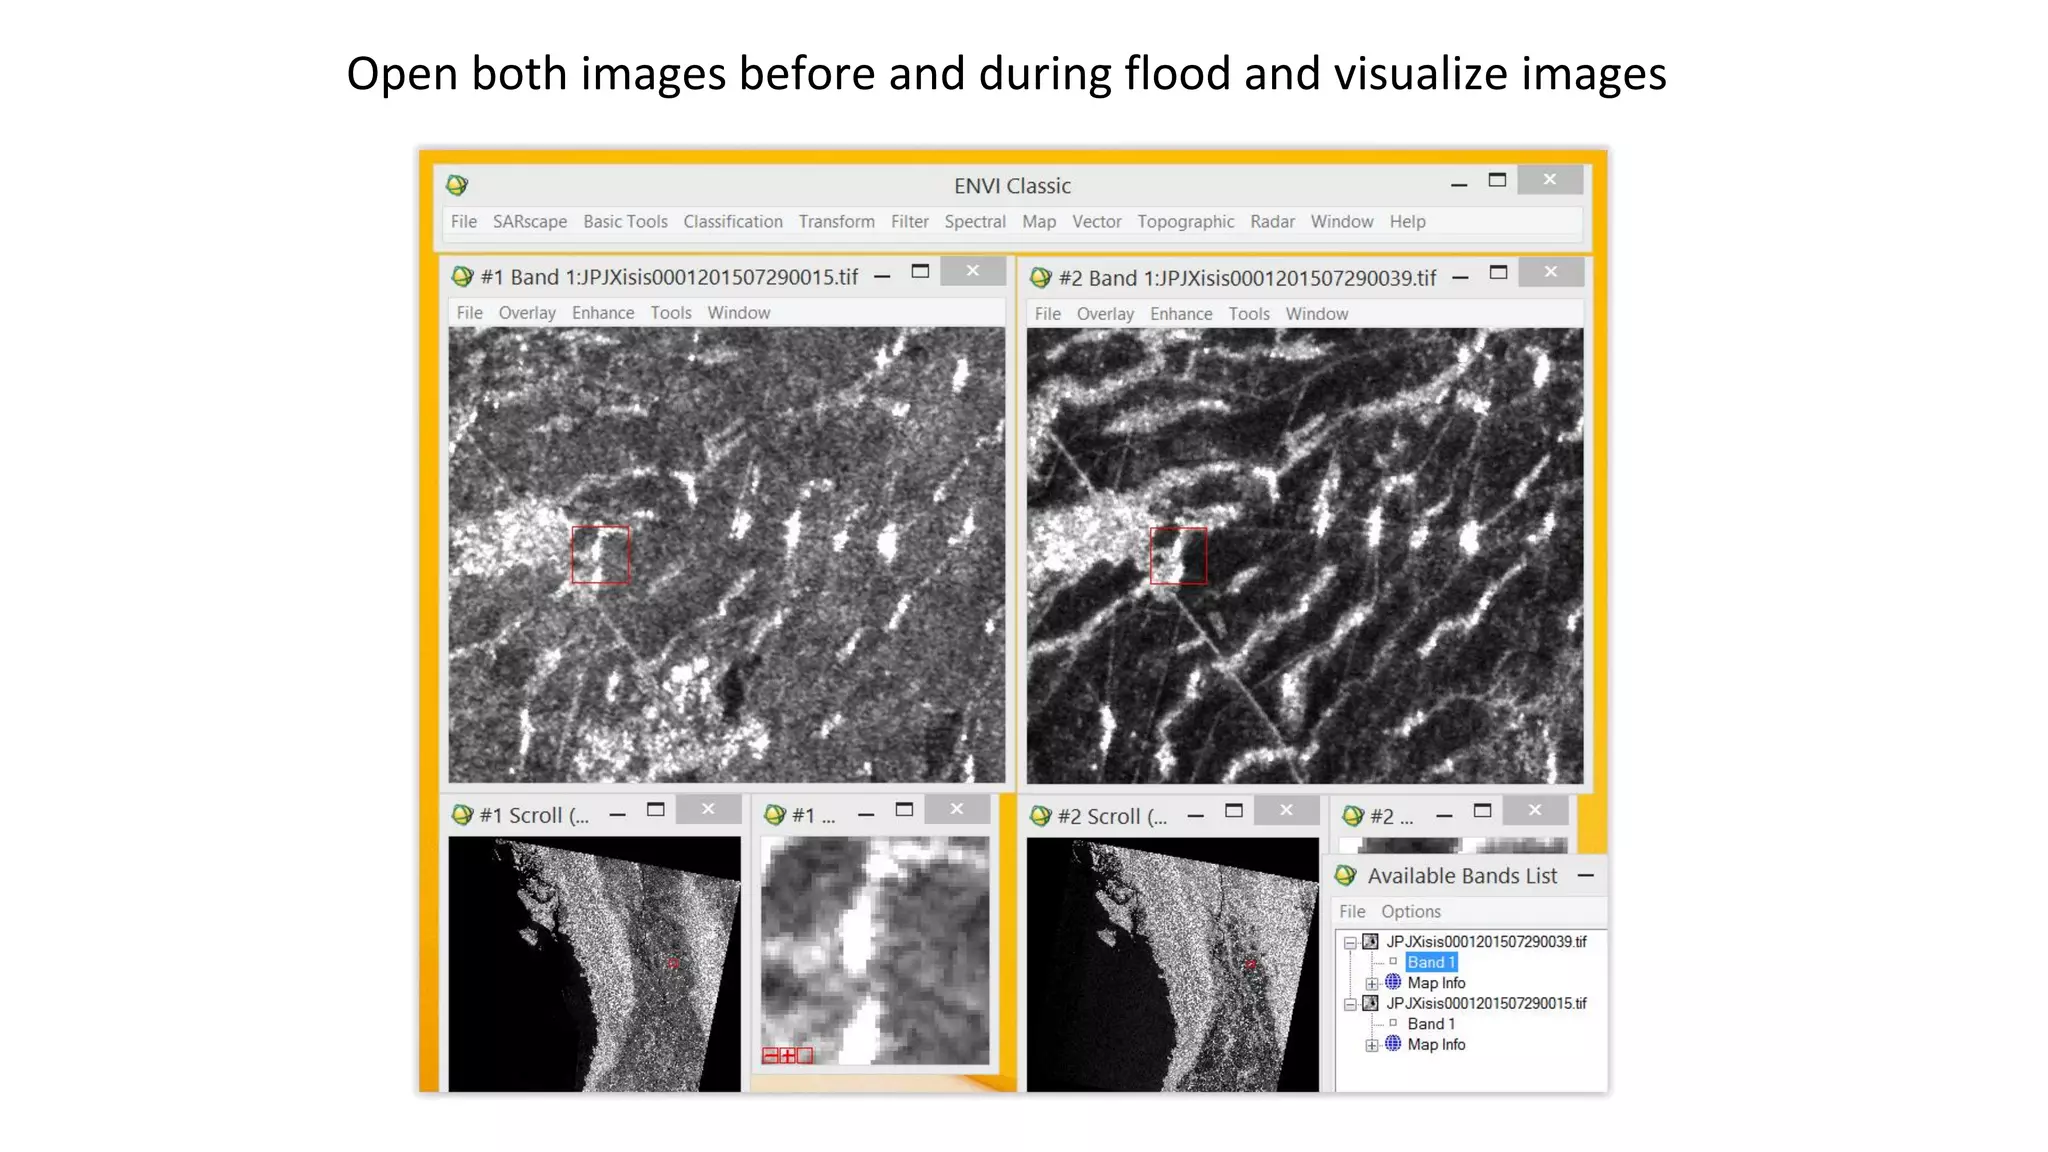
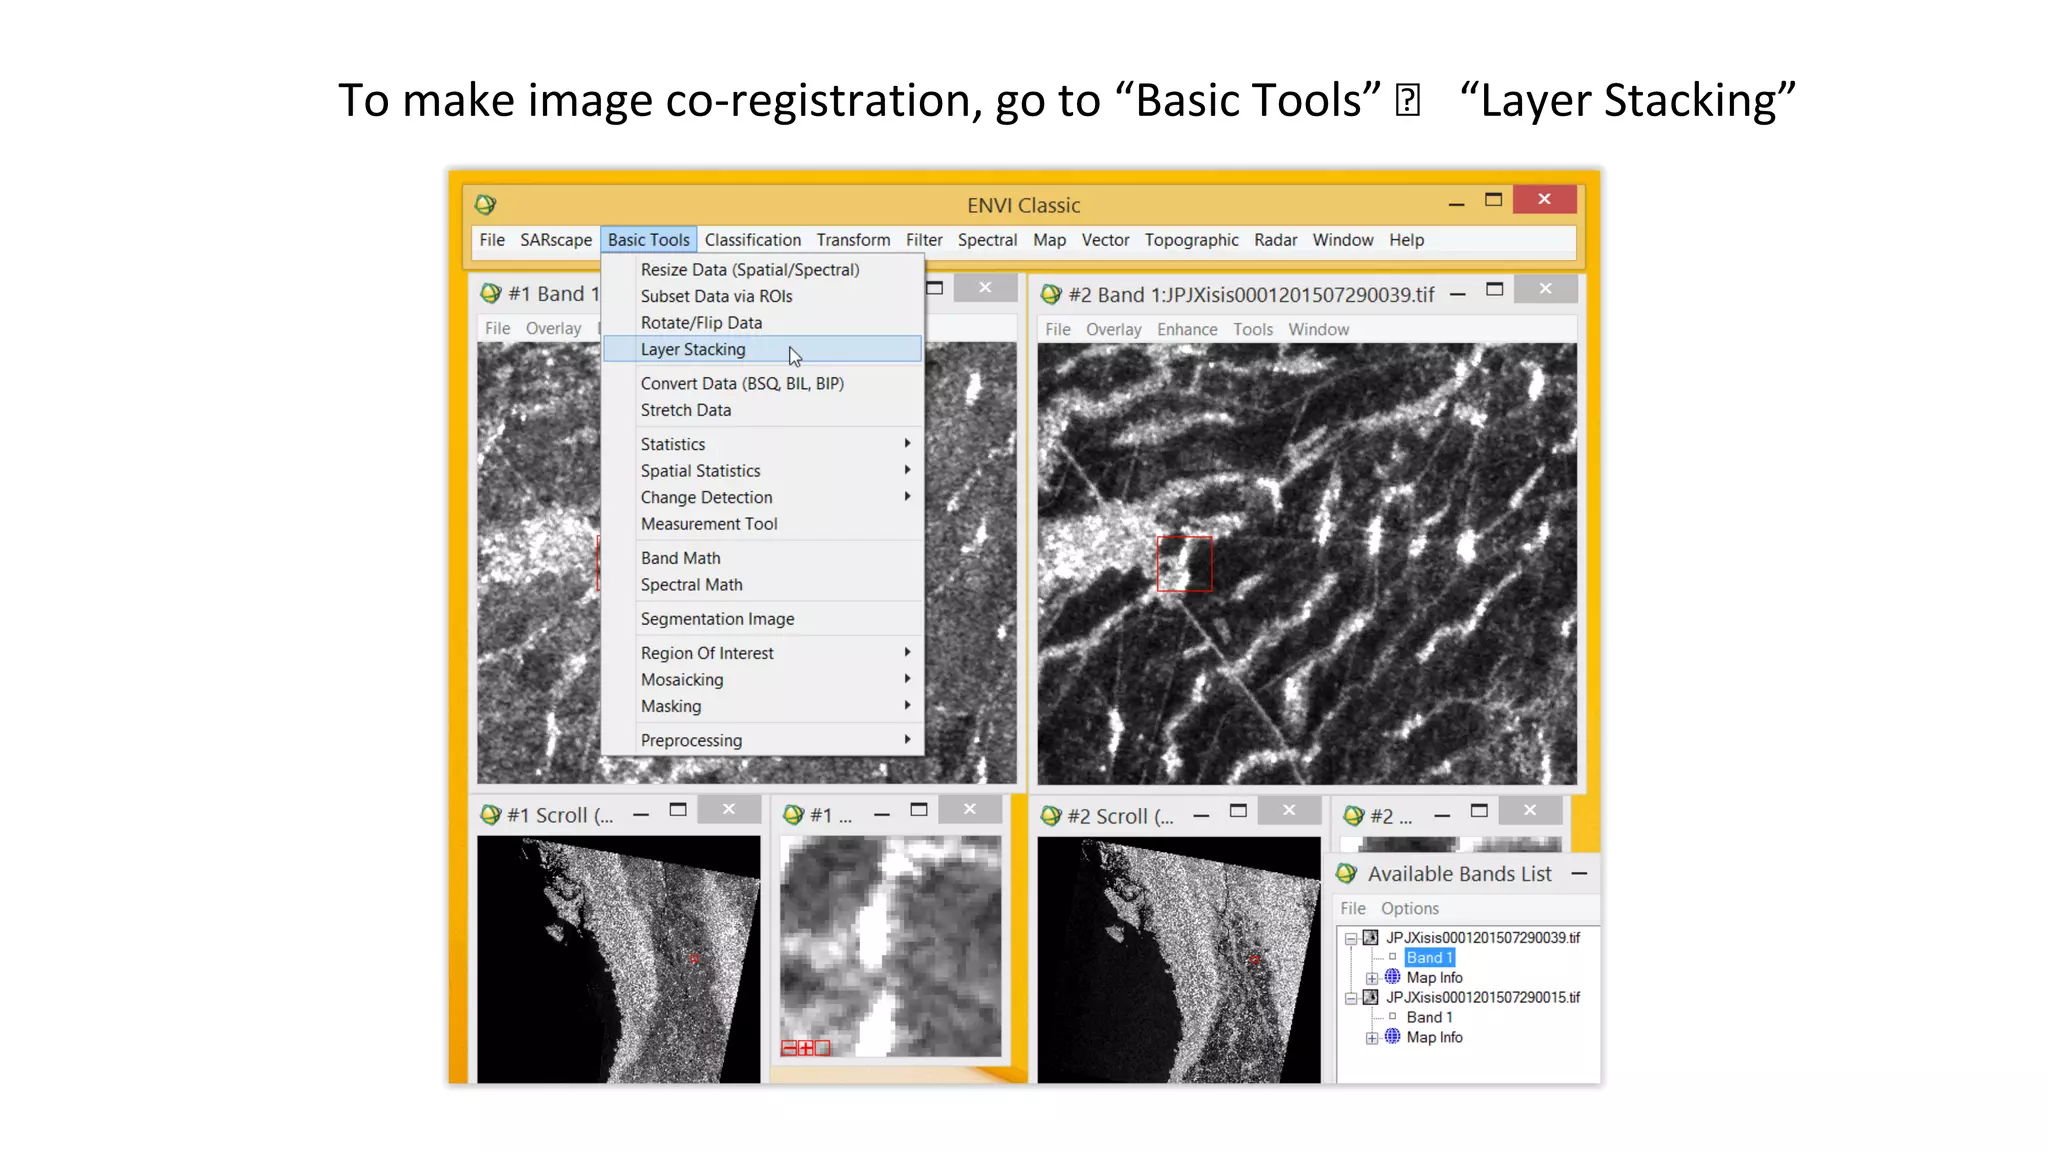
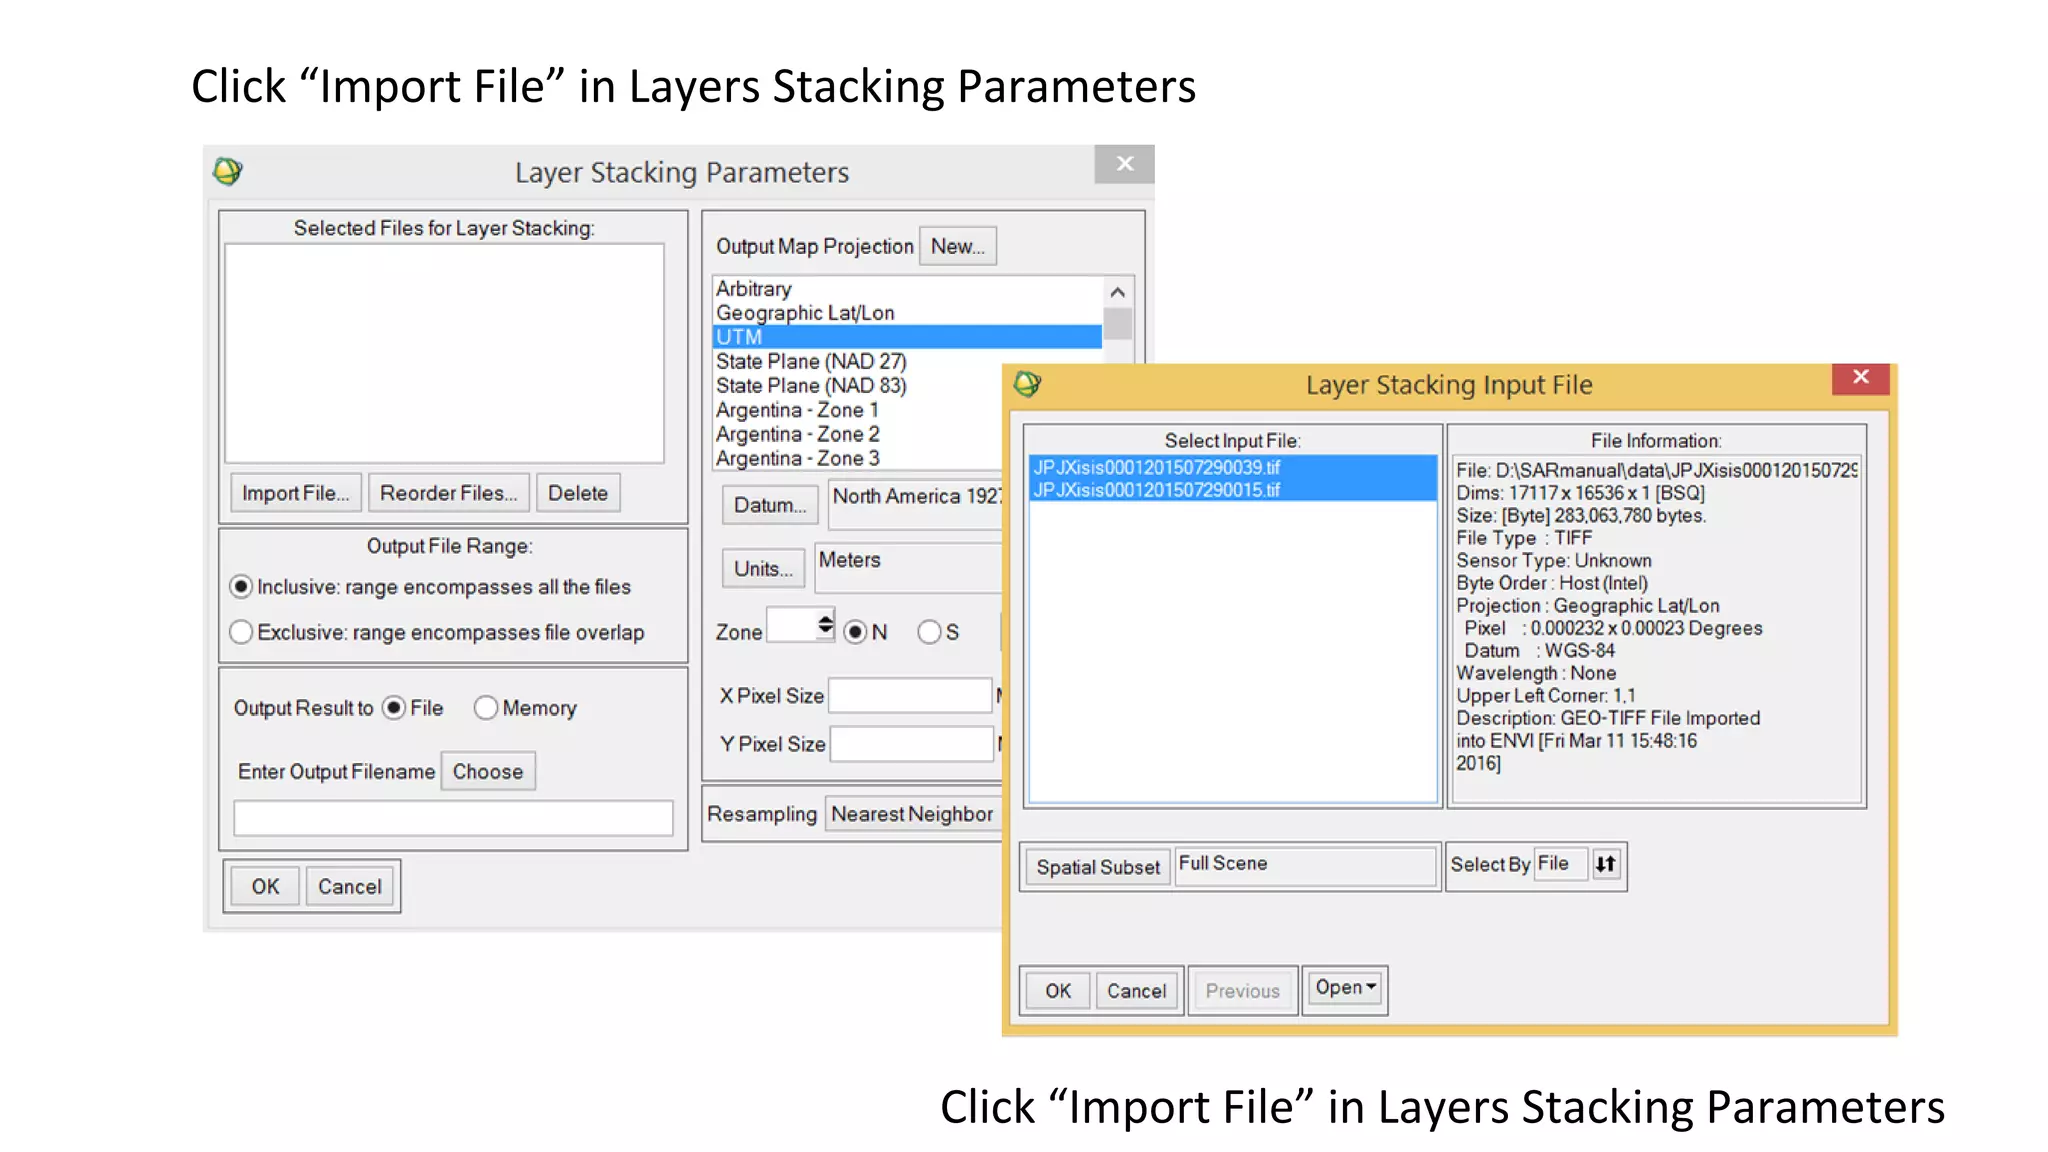
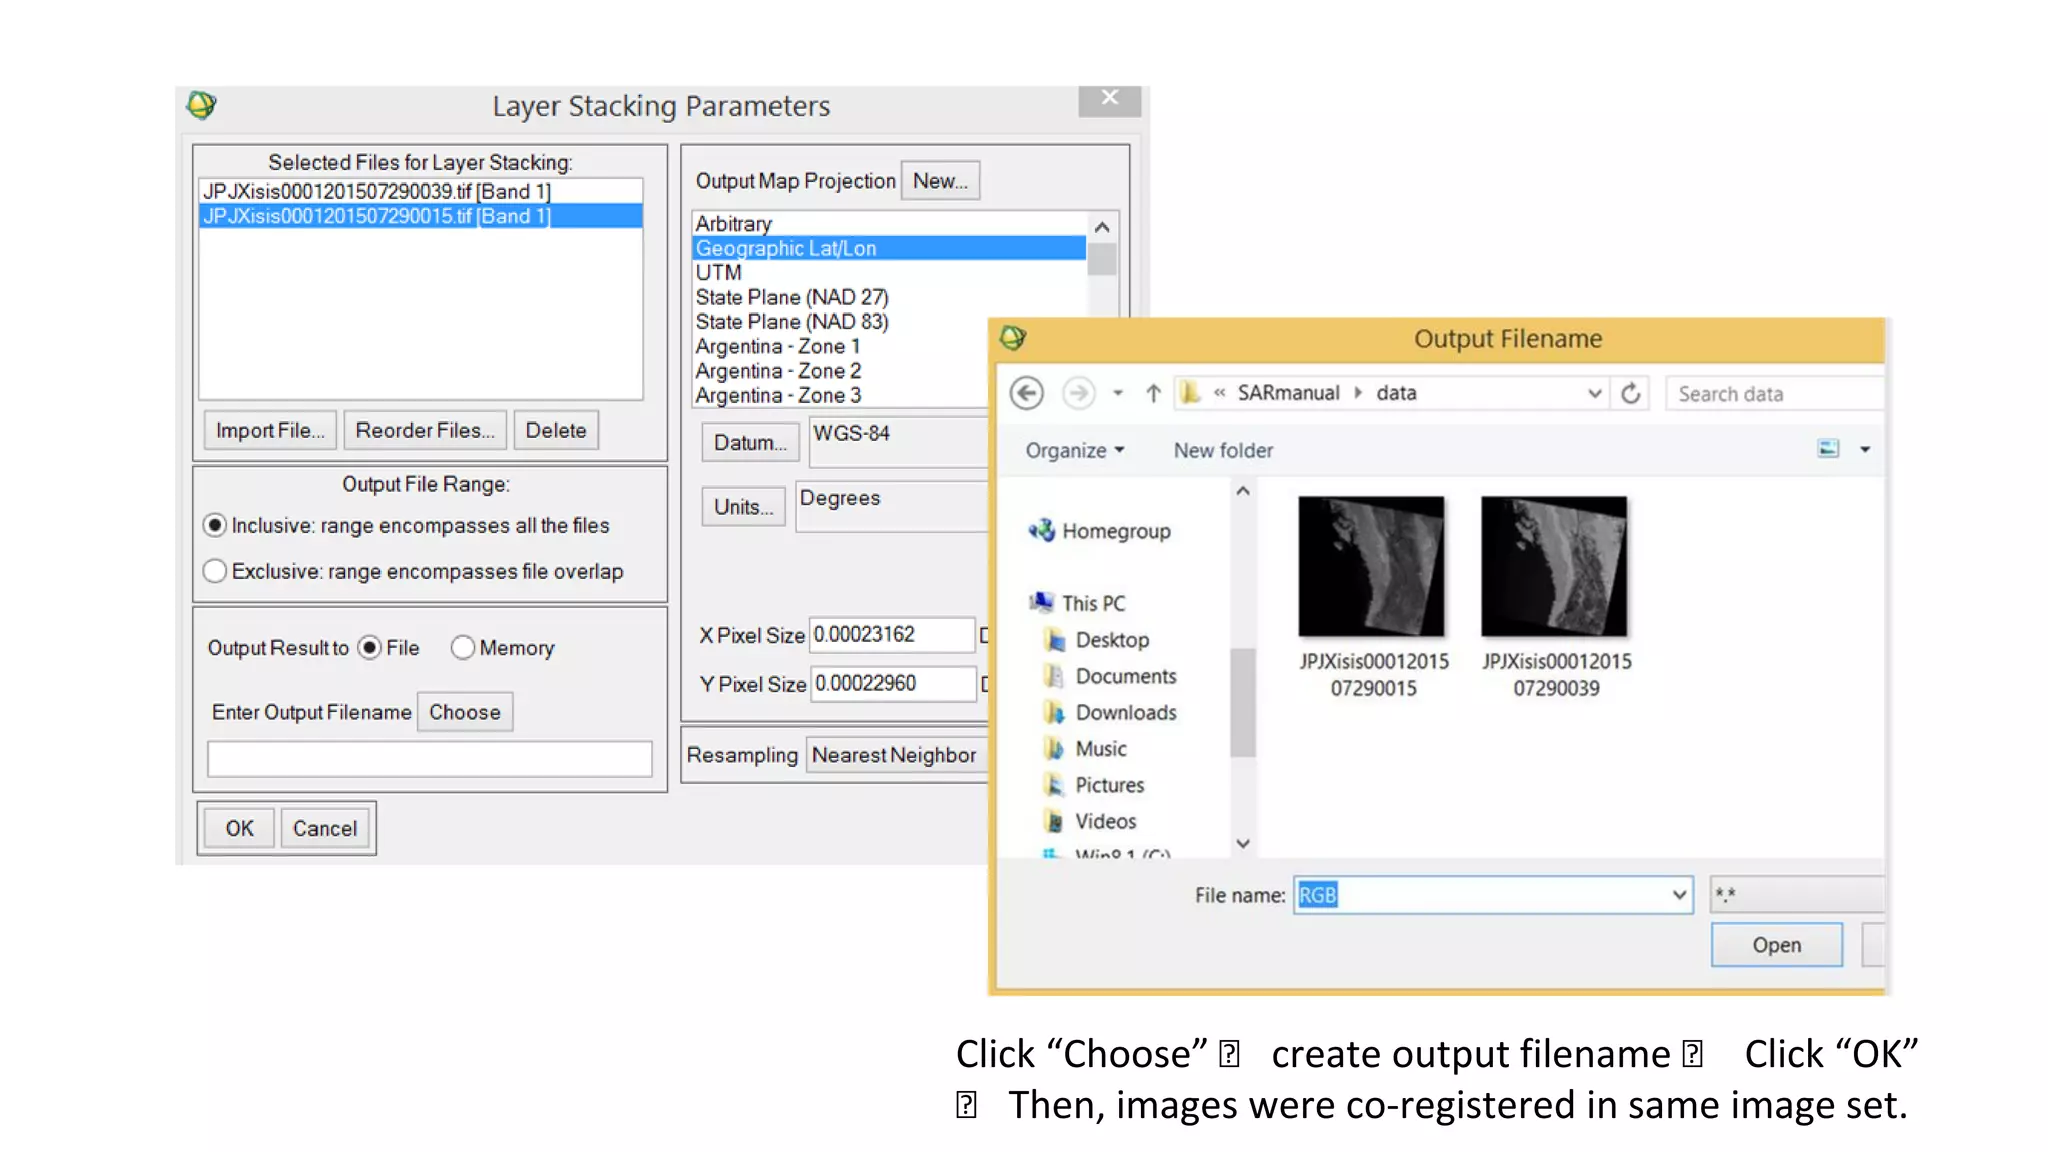
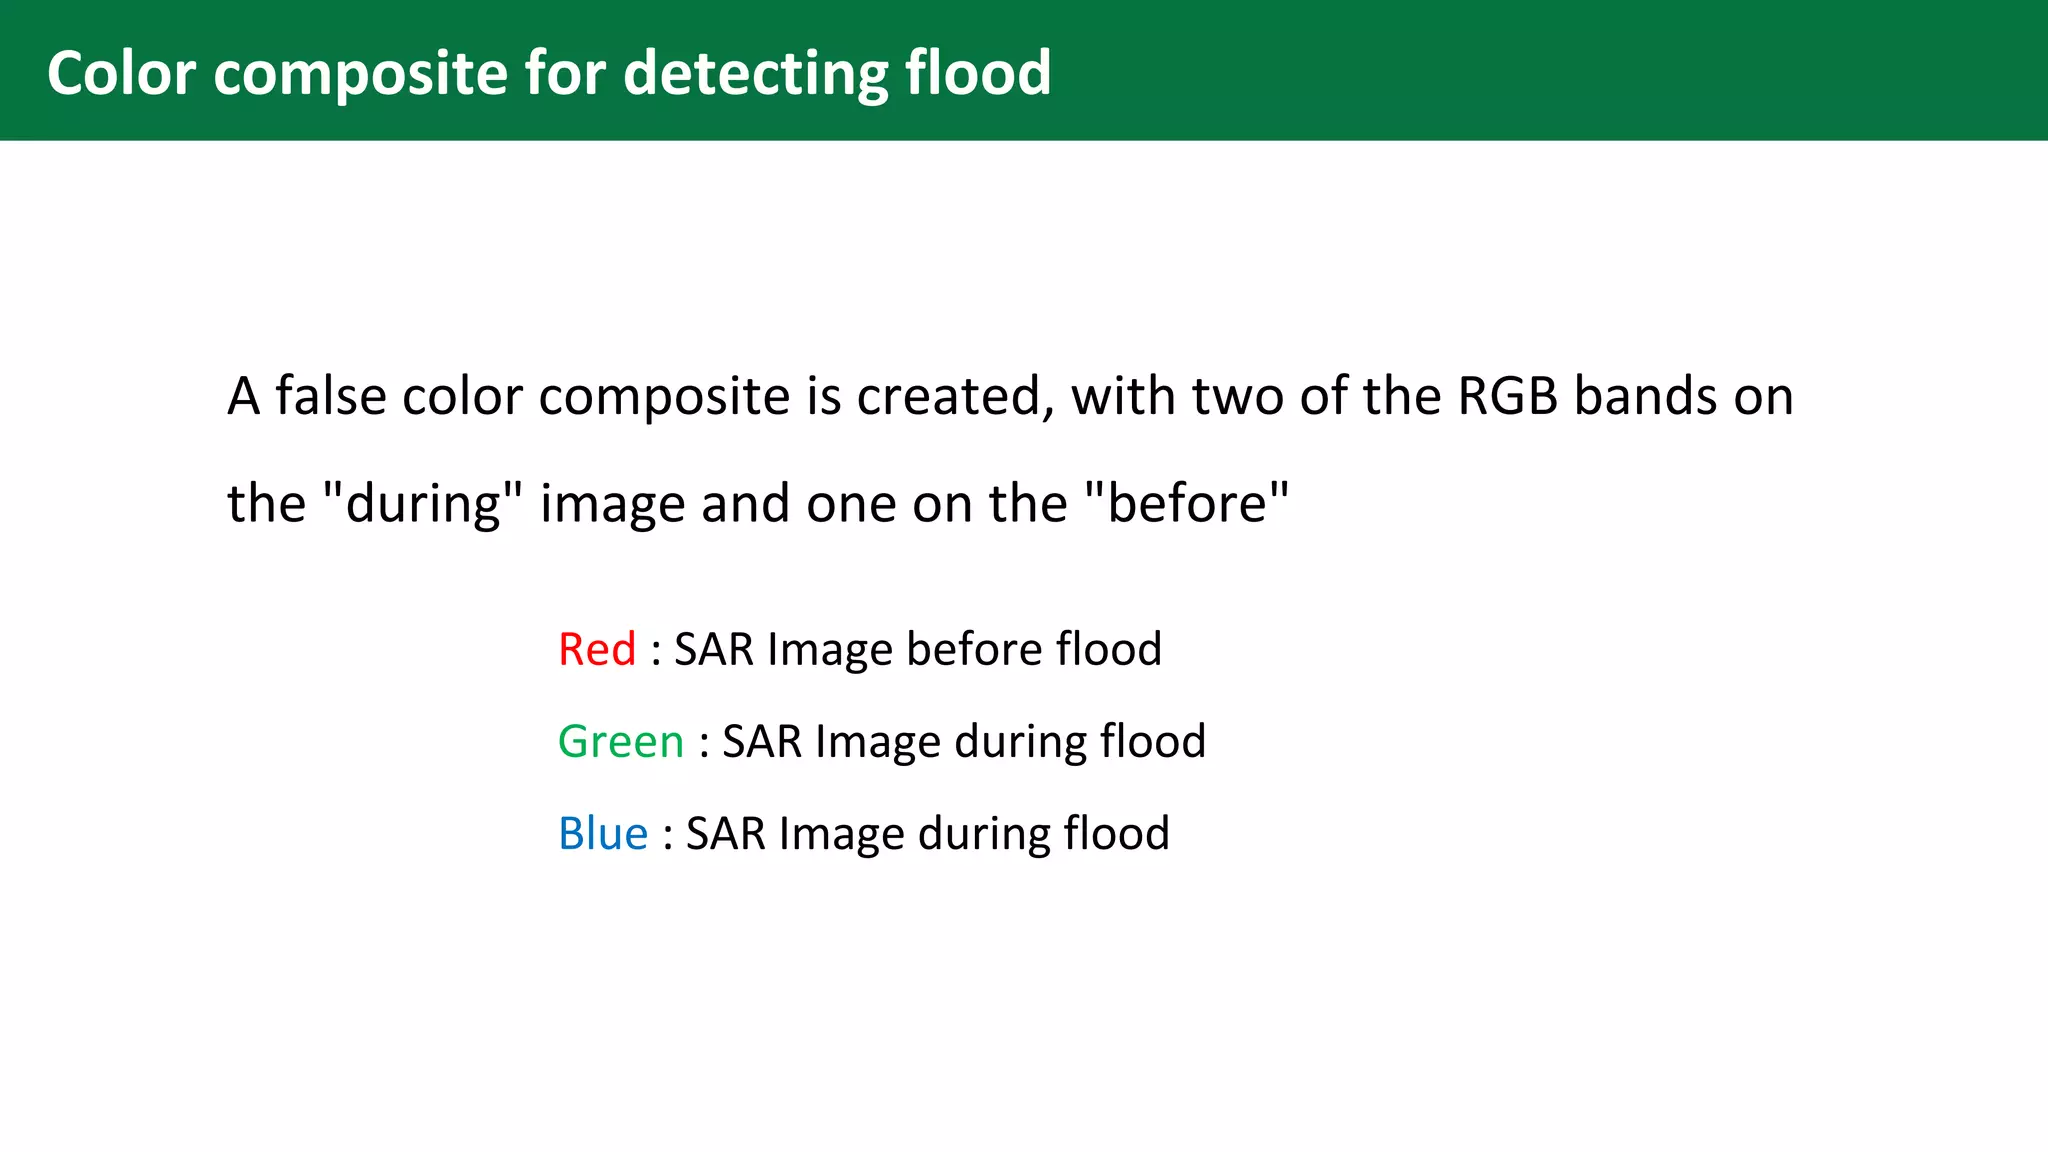
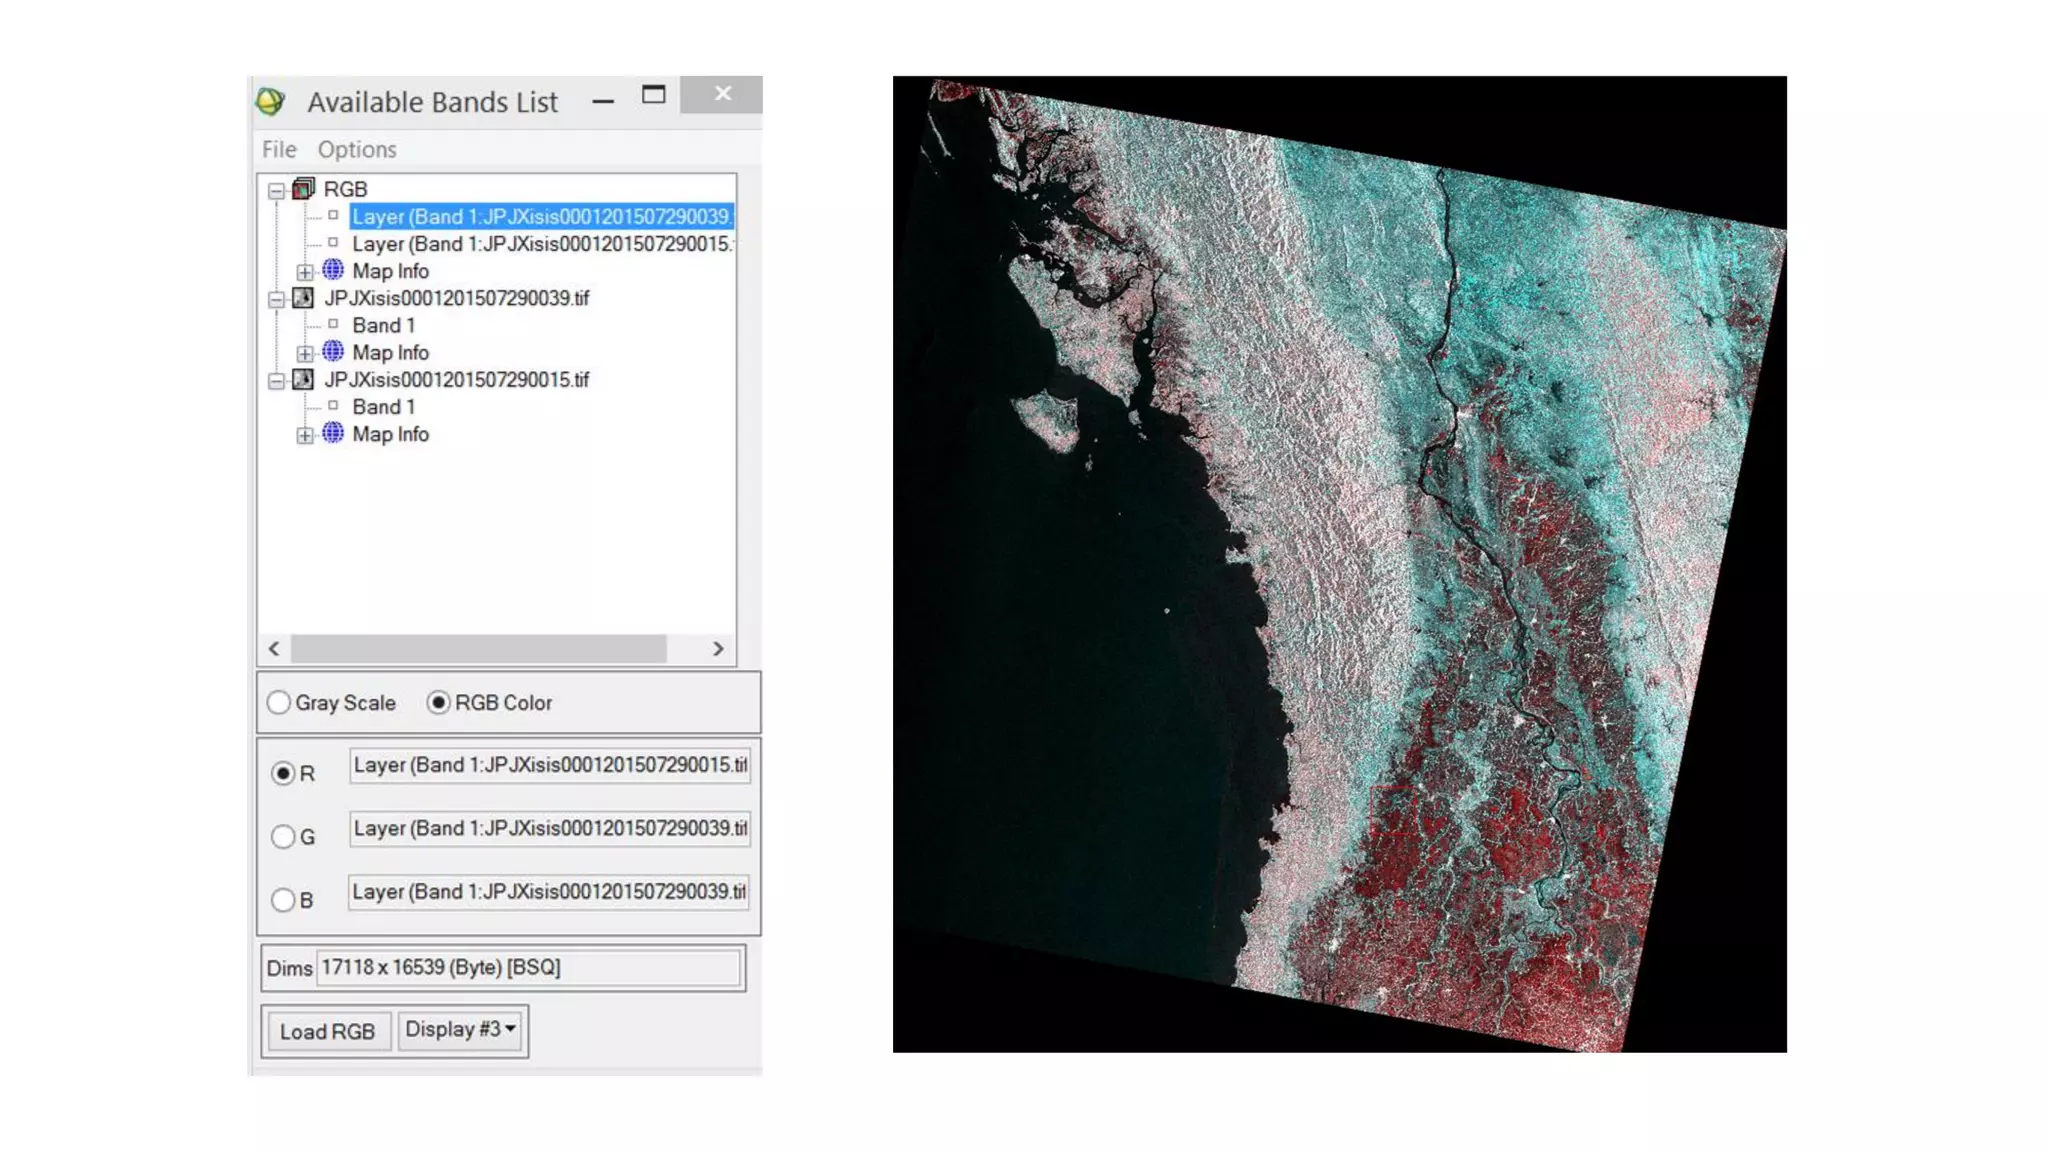
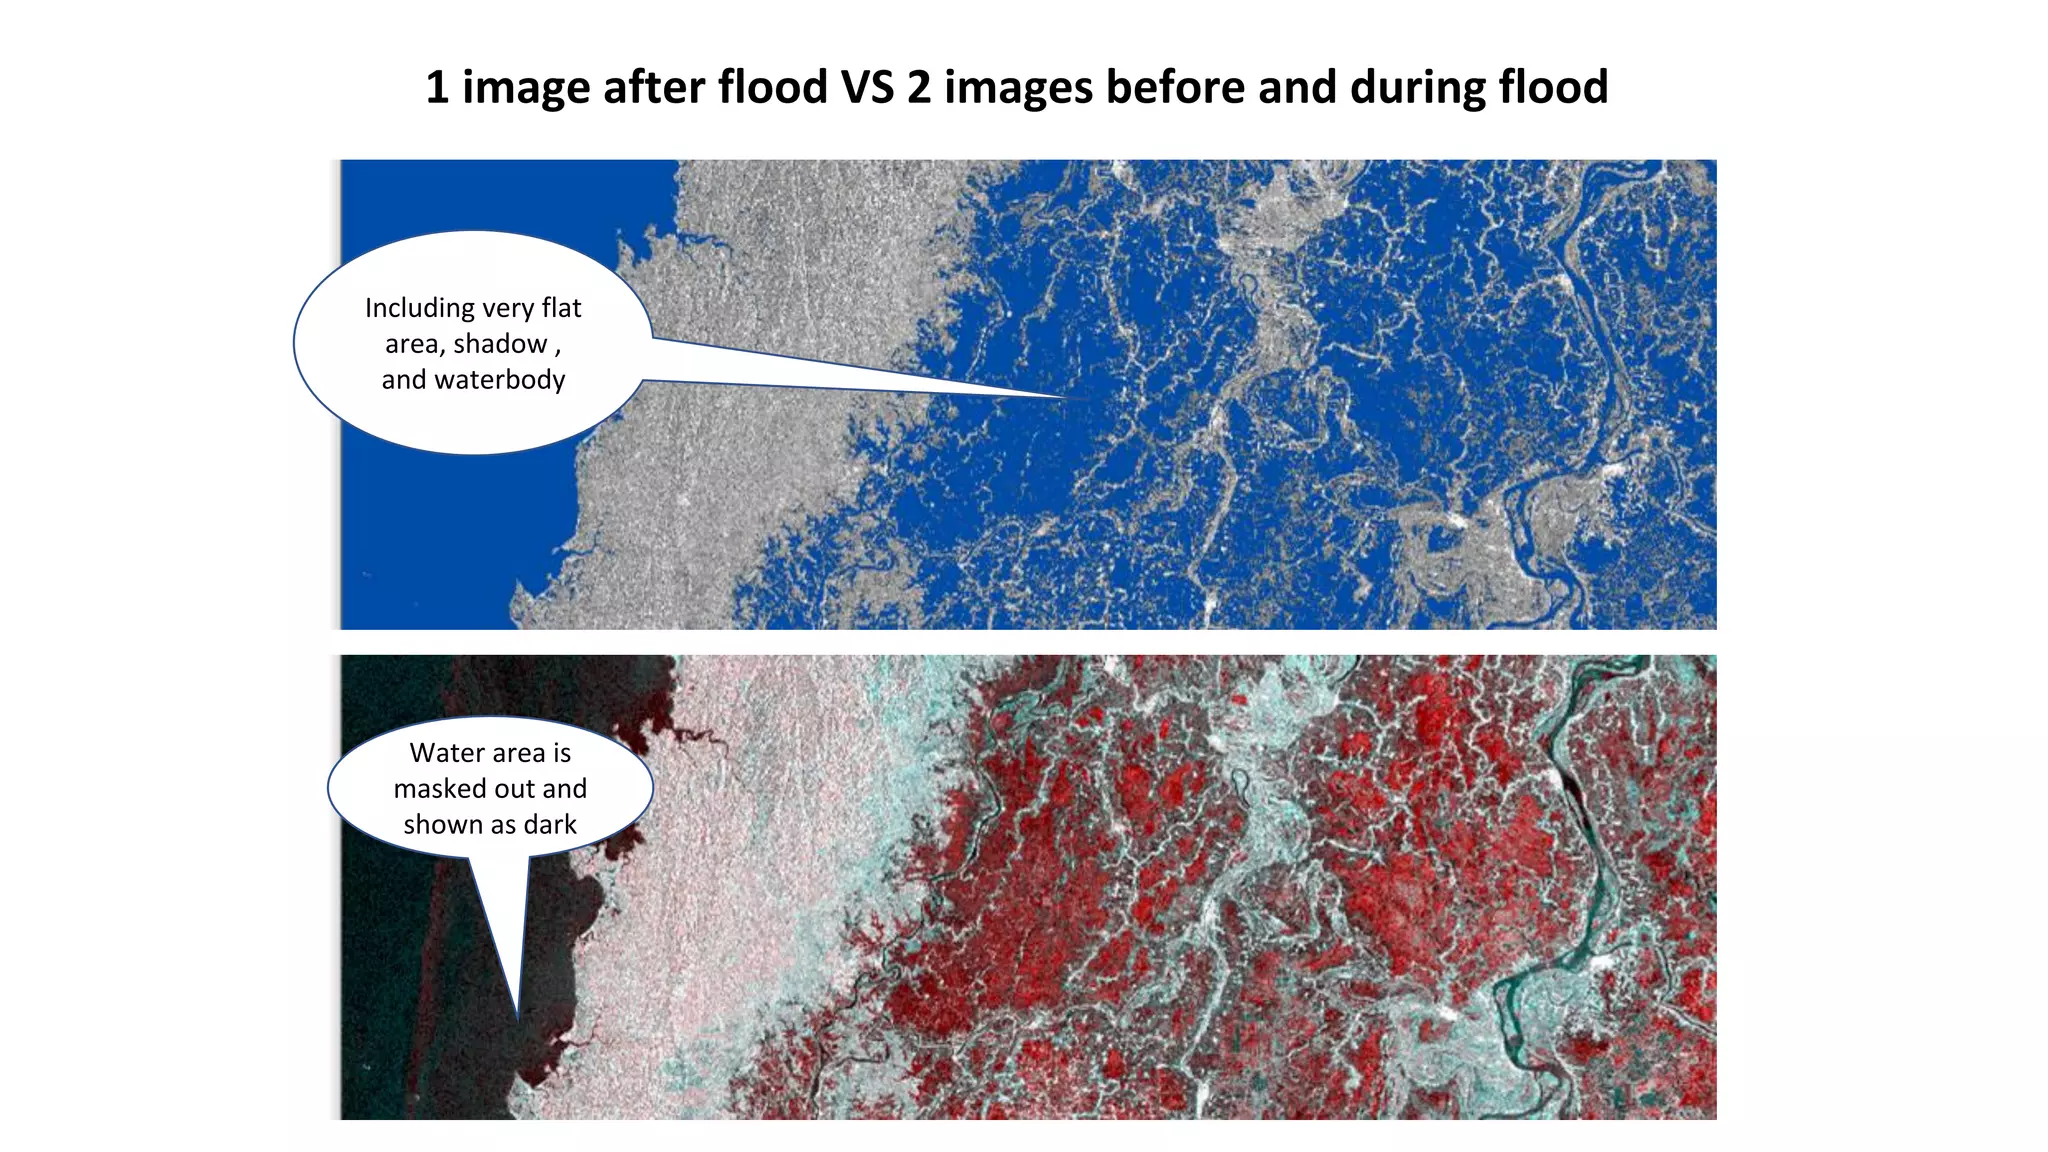
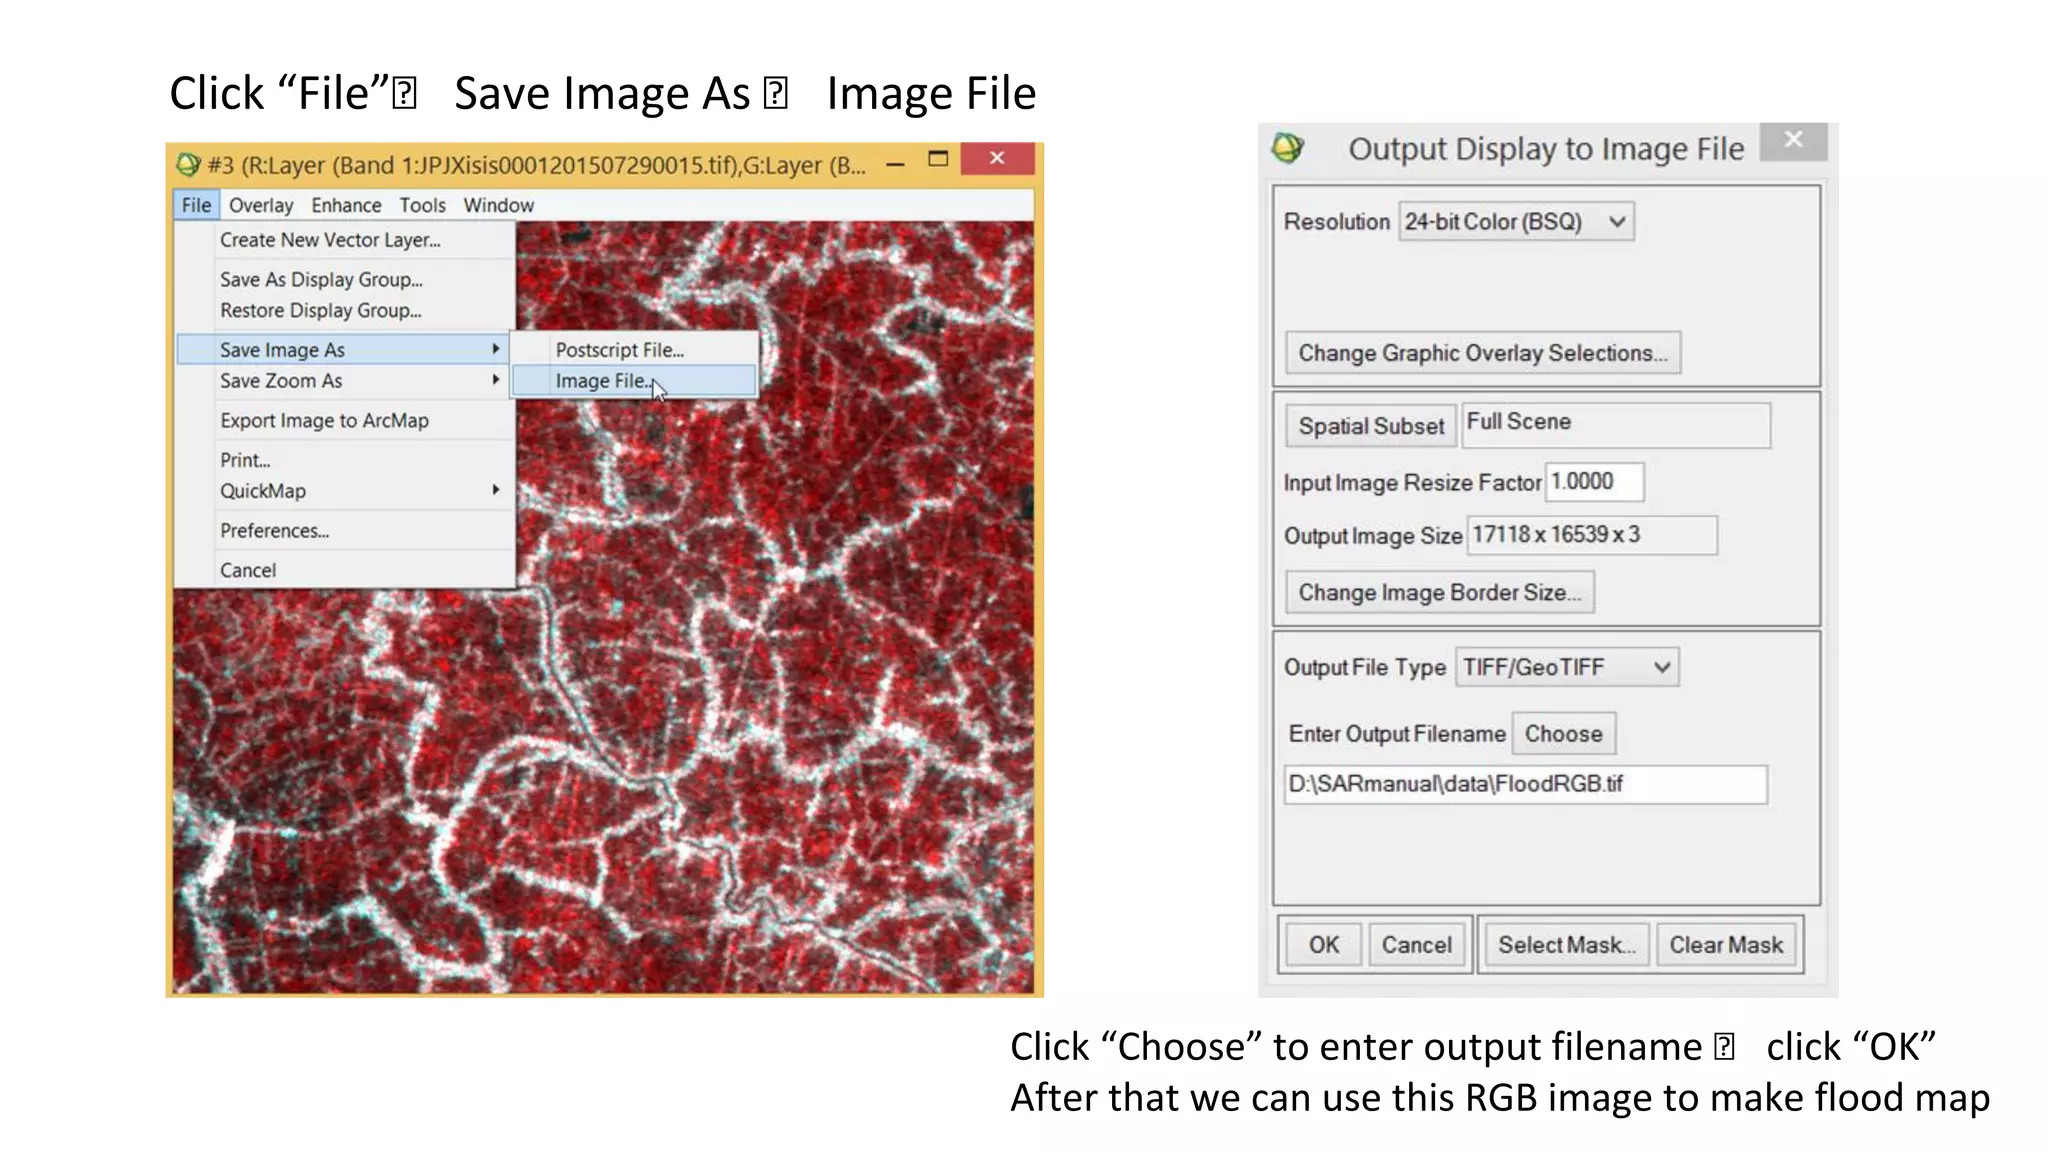
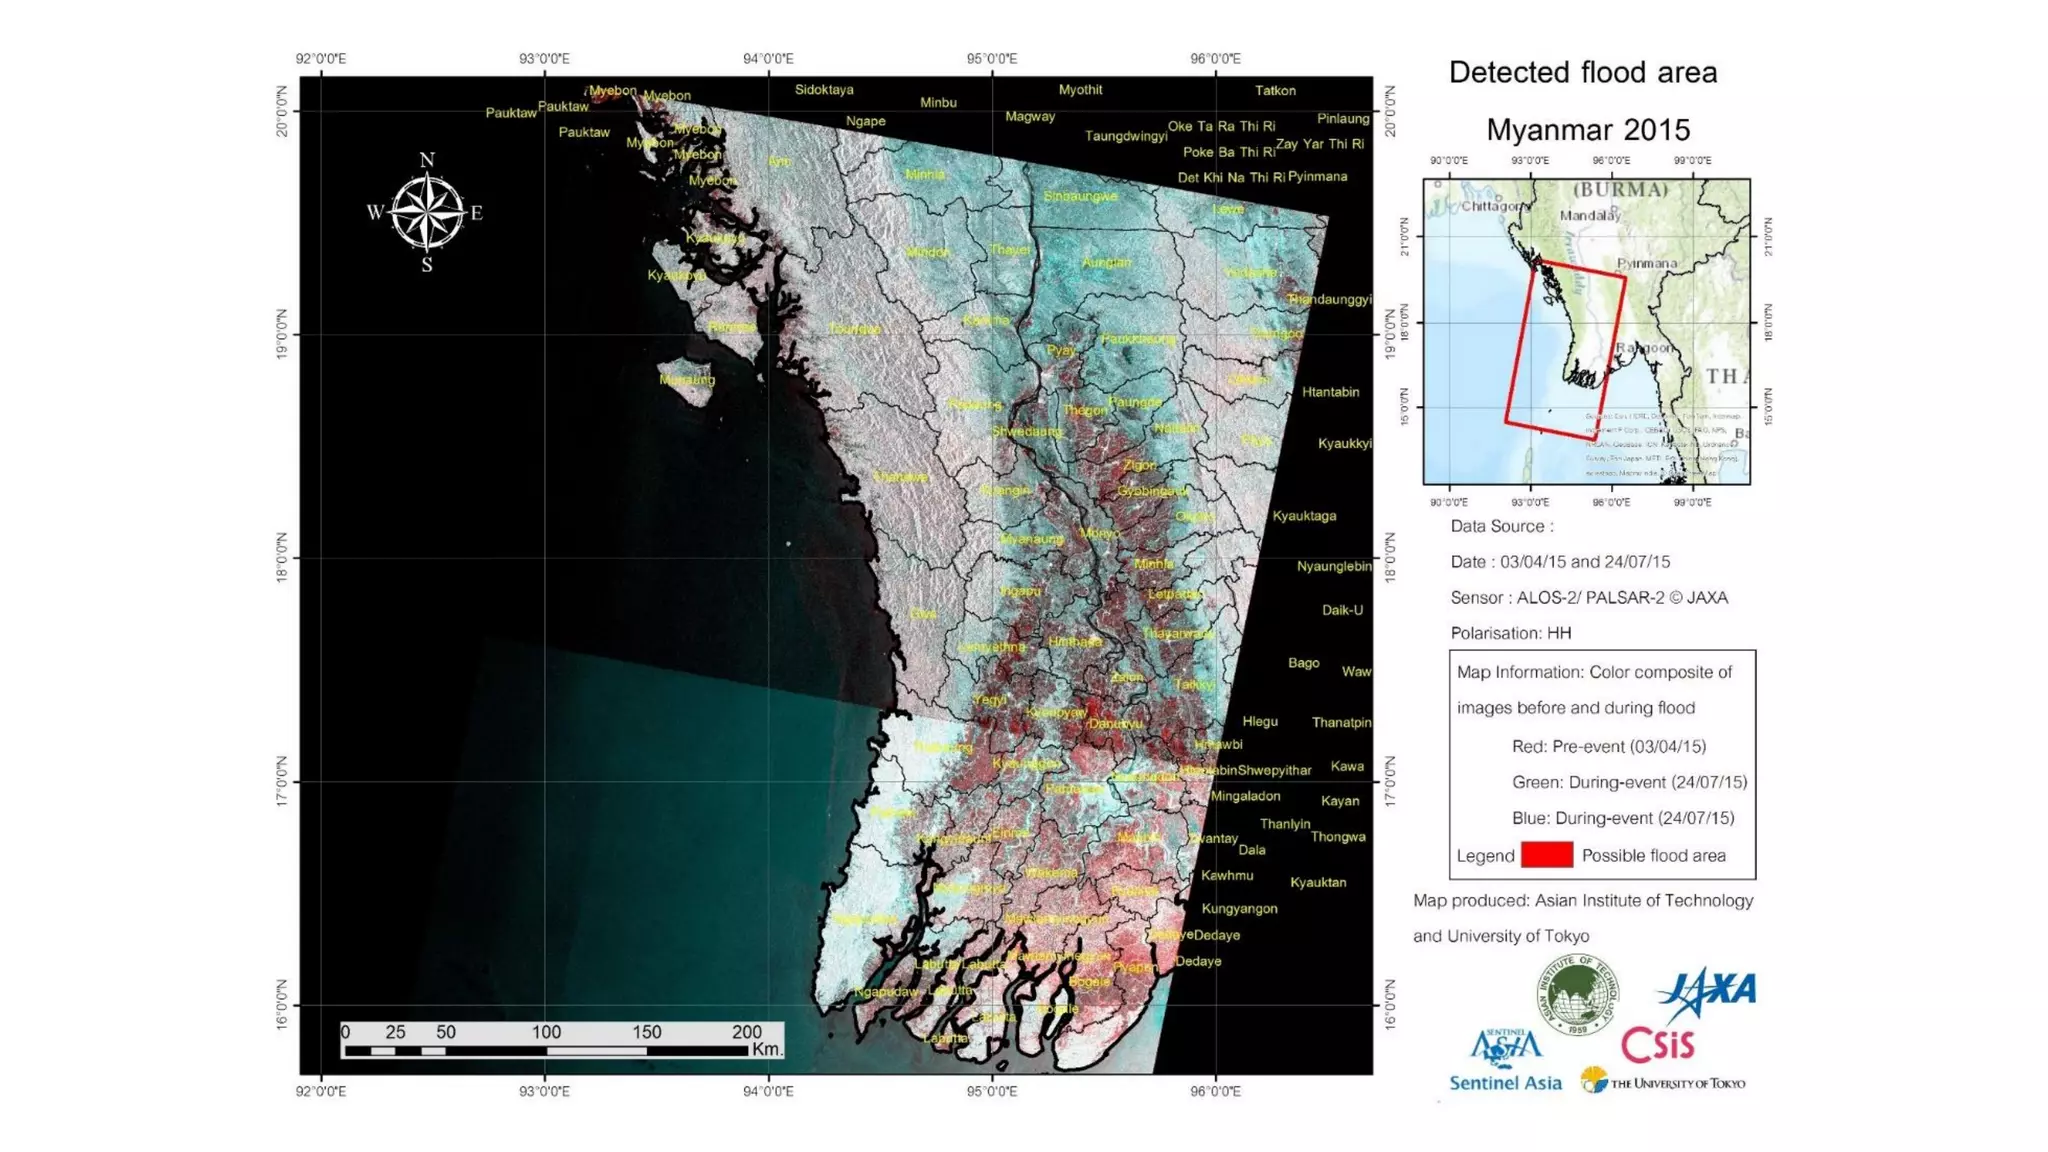
Color Composite in ENVI (Case Study: Flood in Myanmar)
1. Center for Research and Application for Satellite Remote Sensing
Yamaguchi University
Color Composite in ENVI
Case Study: Flood in Myanmar
2. • Torrential rain starting from 16 July 2015 has caused increase in
water levels in the rivers and dams that triggered flooding in some
villages of Mogaung townships in Kachin State and Minkin, Kantbalu,
Kyunhla, Kanee, Kaulin, Butalin and Inntaw township of Sagaing
region.
• As of 20th July report, a total of 2116 people of 358 households were
affected in Mogaung. In Sagaing region, 24 houses were damaged
and 57101 of 12942 households were affected by these flood. During
search and rescue, one staff from Fire Service Department, one staff
from Myanmar Police Forces and 5 residents died.
Myanmar Flood in 2015
3. ALOS2 level data and processing
Product from Sentinel ASIA website
• Jpeg
• GeoTiff
Product from JAXA (CEOS SAR/GeoTIFF)
• Level 1.1 This is complex number data on the slant range following compression of the range and azimuth. As one-look data, it
includes phase information and will be the basis for later processing. In wide-area mode, image files are created for each scan.
• Level 1.5 This is multi-look data on the slant range from map projection amplitude data, with range and azimuth compressed.
• Level 2.1 Geometrically corrected (orthorectified) data using the digital elevation data from Level 1.1
• Level 3.1 Image quality-corrected (noise removed, dynamic range compressed) data from Level 1.5
https://sentinel.tksc.jaxa.jp/sentinel2/emobSelect.jsp
use Geotiff for analysis
4. • Image before flood : JPJXisis0001201507290015.tiff
• Date : 03 April 2015
• Image during flood : JPJXisis0001201507290039.tiff
• Date : 24 July 2015
• Software: Envi
ALOS2 level data and processing
5. Select image file “JPJXisis0001201507290015.tiff”
and “JPJXisis0001201507290039.tiff”
Open Envi software🡪 File 🡪 Open Image File
8. To make image co-registration, go to “Basic Tools” 🡪 “Layer Stacking”
9. Click “Import File” in Layers Stacking Parameters
Click “Import File” in Layers Stacking Parameters
10. Click “Choose” 🡪 create output filename 🡪 Click “OK”
🡪 Then, images were co-registered in same image set.
11. A false color composite is created, with two of the RGB bands on
the "during" image and one on the "before"
Red : SAR Image before flood
Green : SAR Image during flood
Blue : SAR Image during flood
Color composite for detecting flood
12.
13. 1 image after flood VS 2 images before and during flood
Including very flat
area, shadow ,
and waterbody
Water area is
masked out and
shown as dark
14. Click “File”🡪 Save Image As 🡪 Image File
Click “Choose” to enter output filename 🡪 click “OK”
After that we can use this RGB image to make flood map