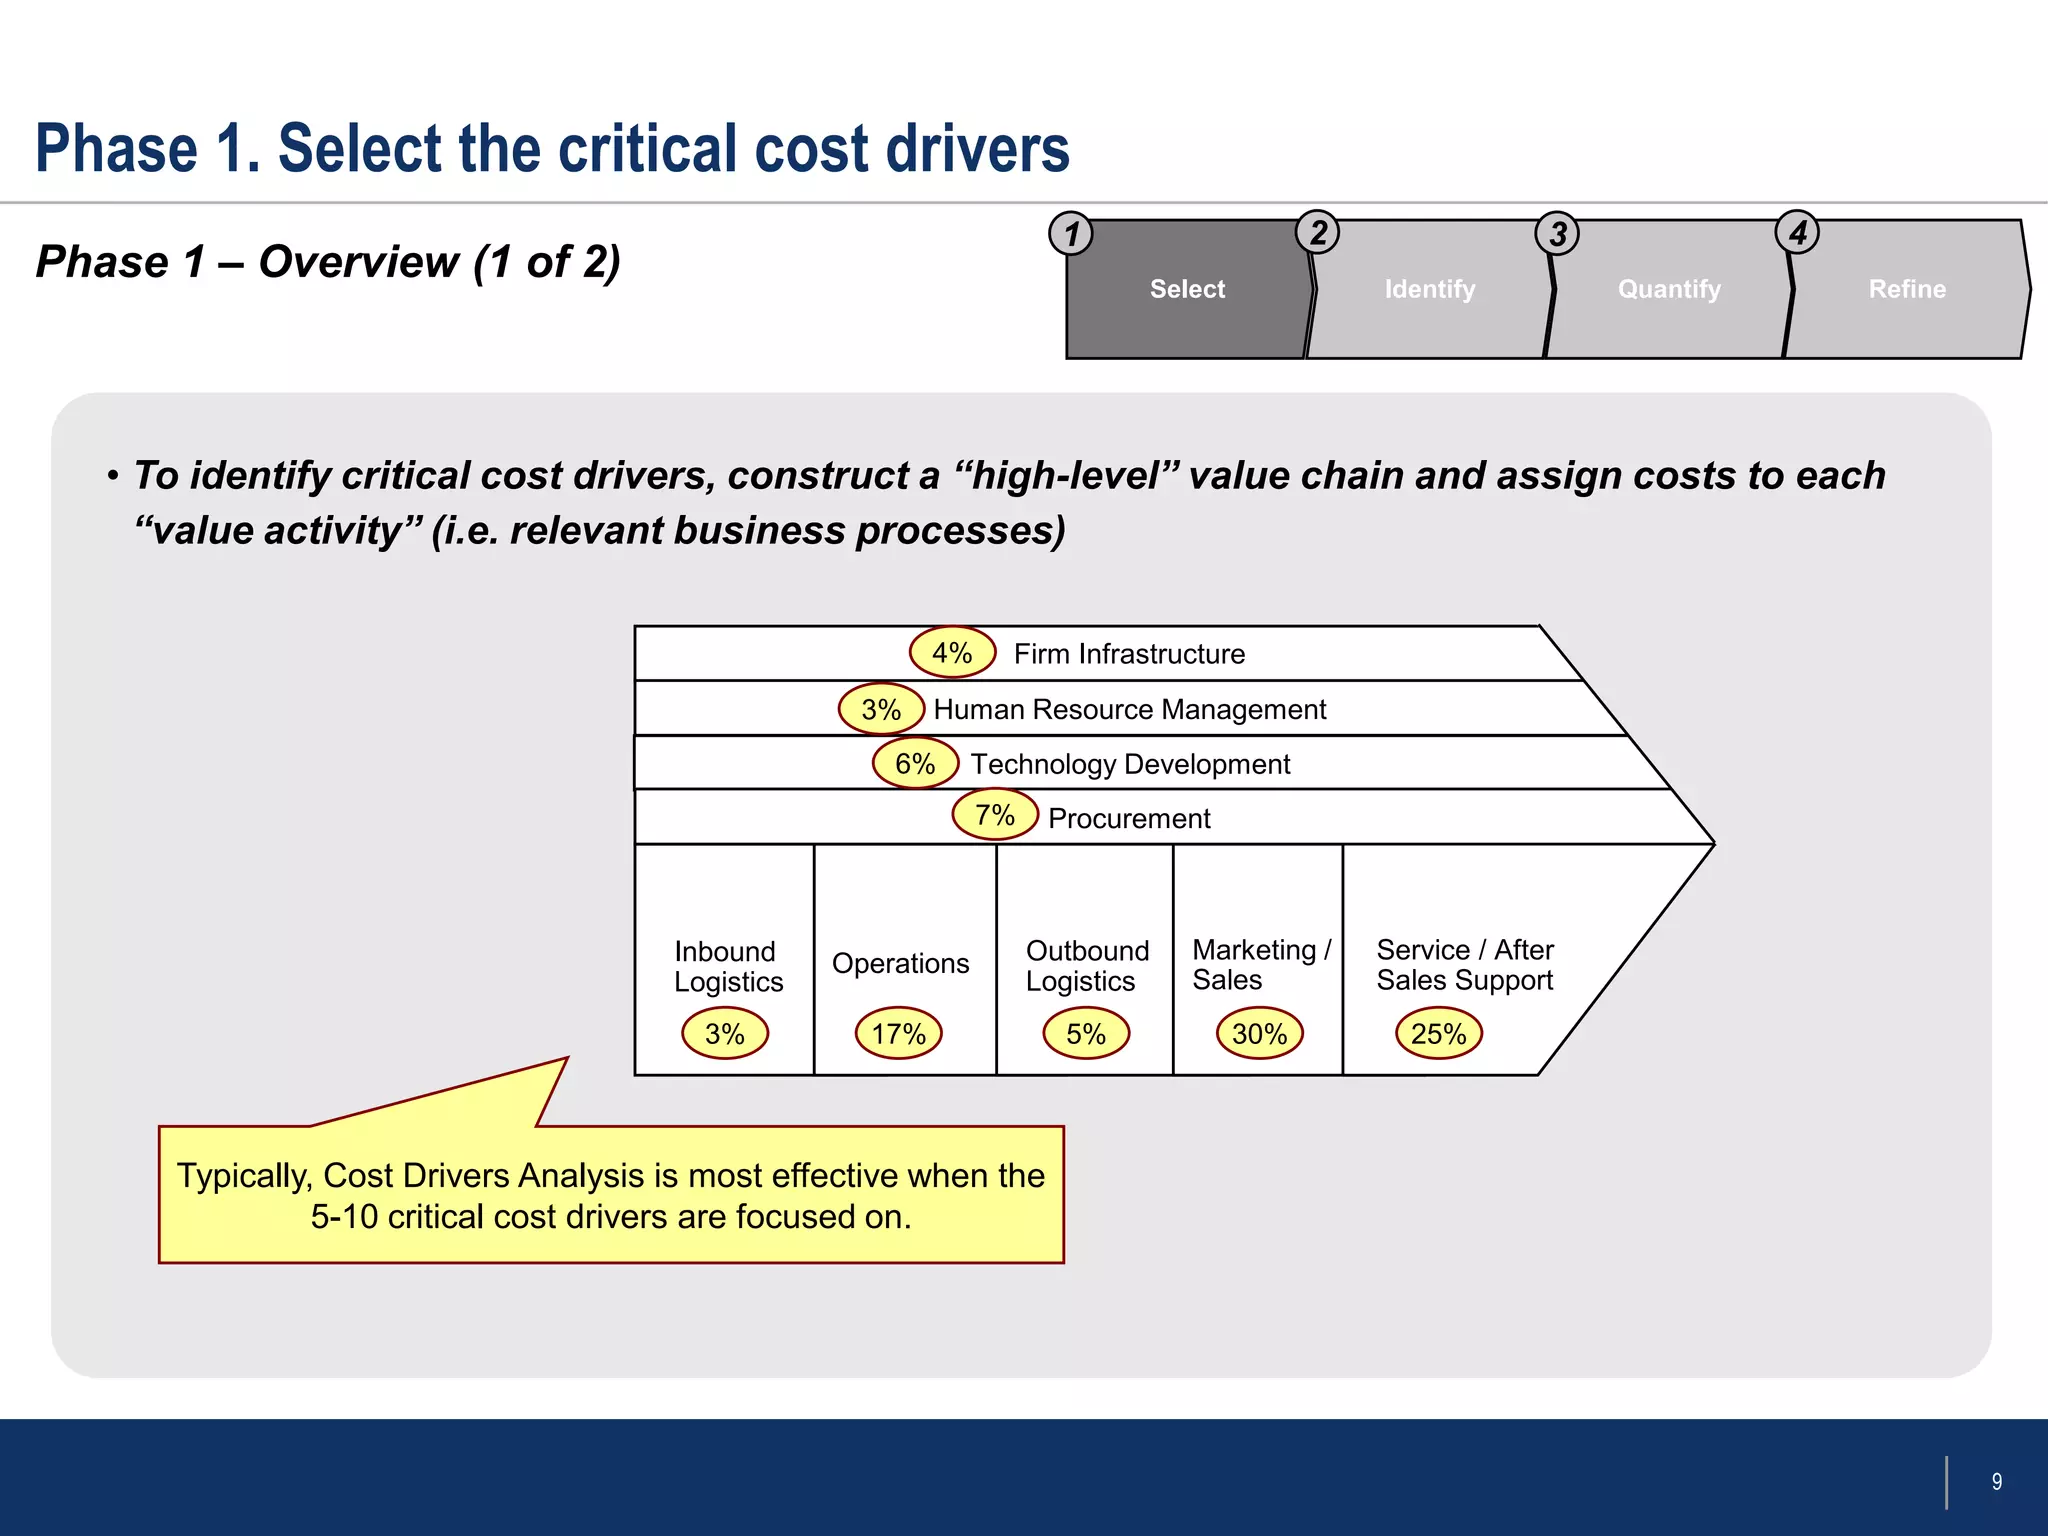
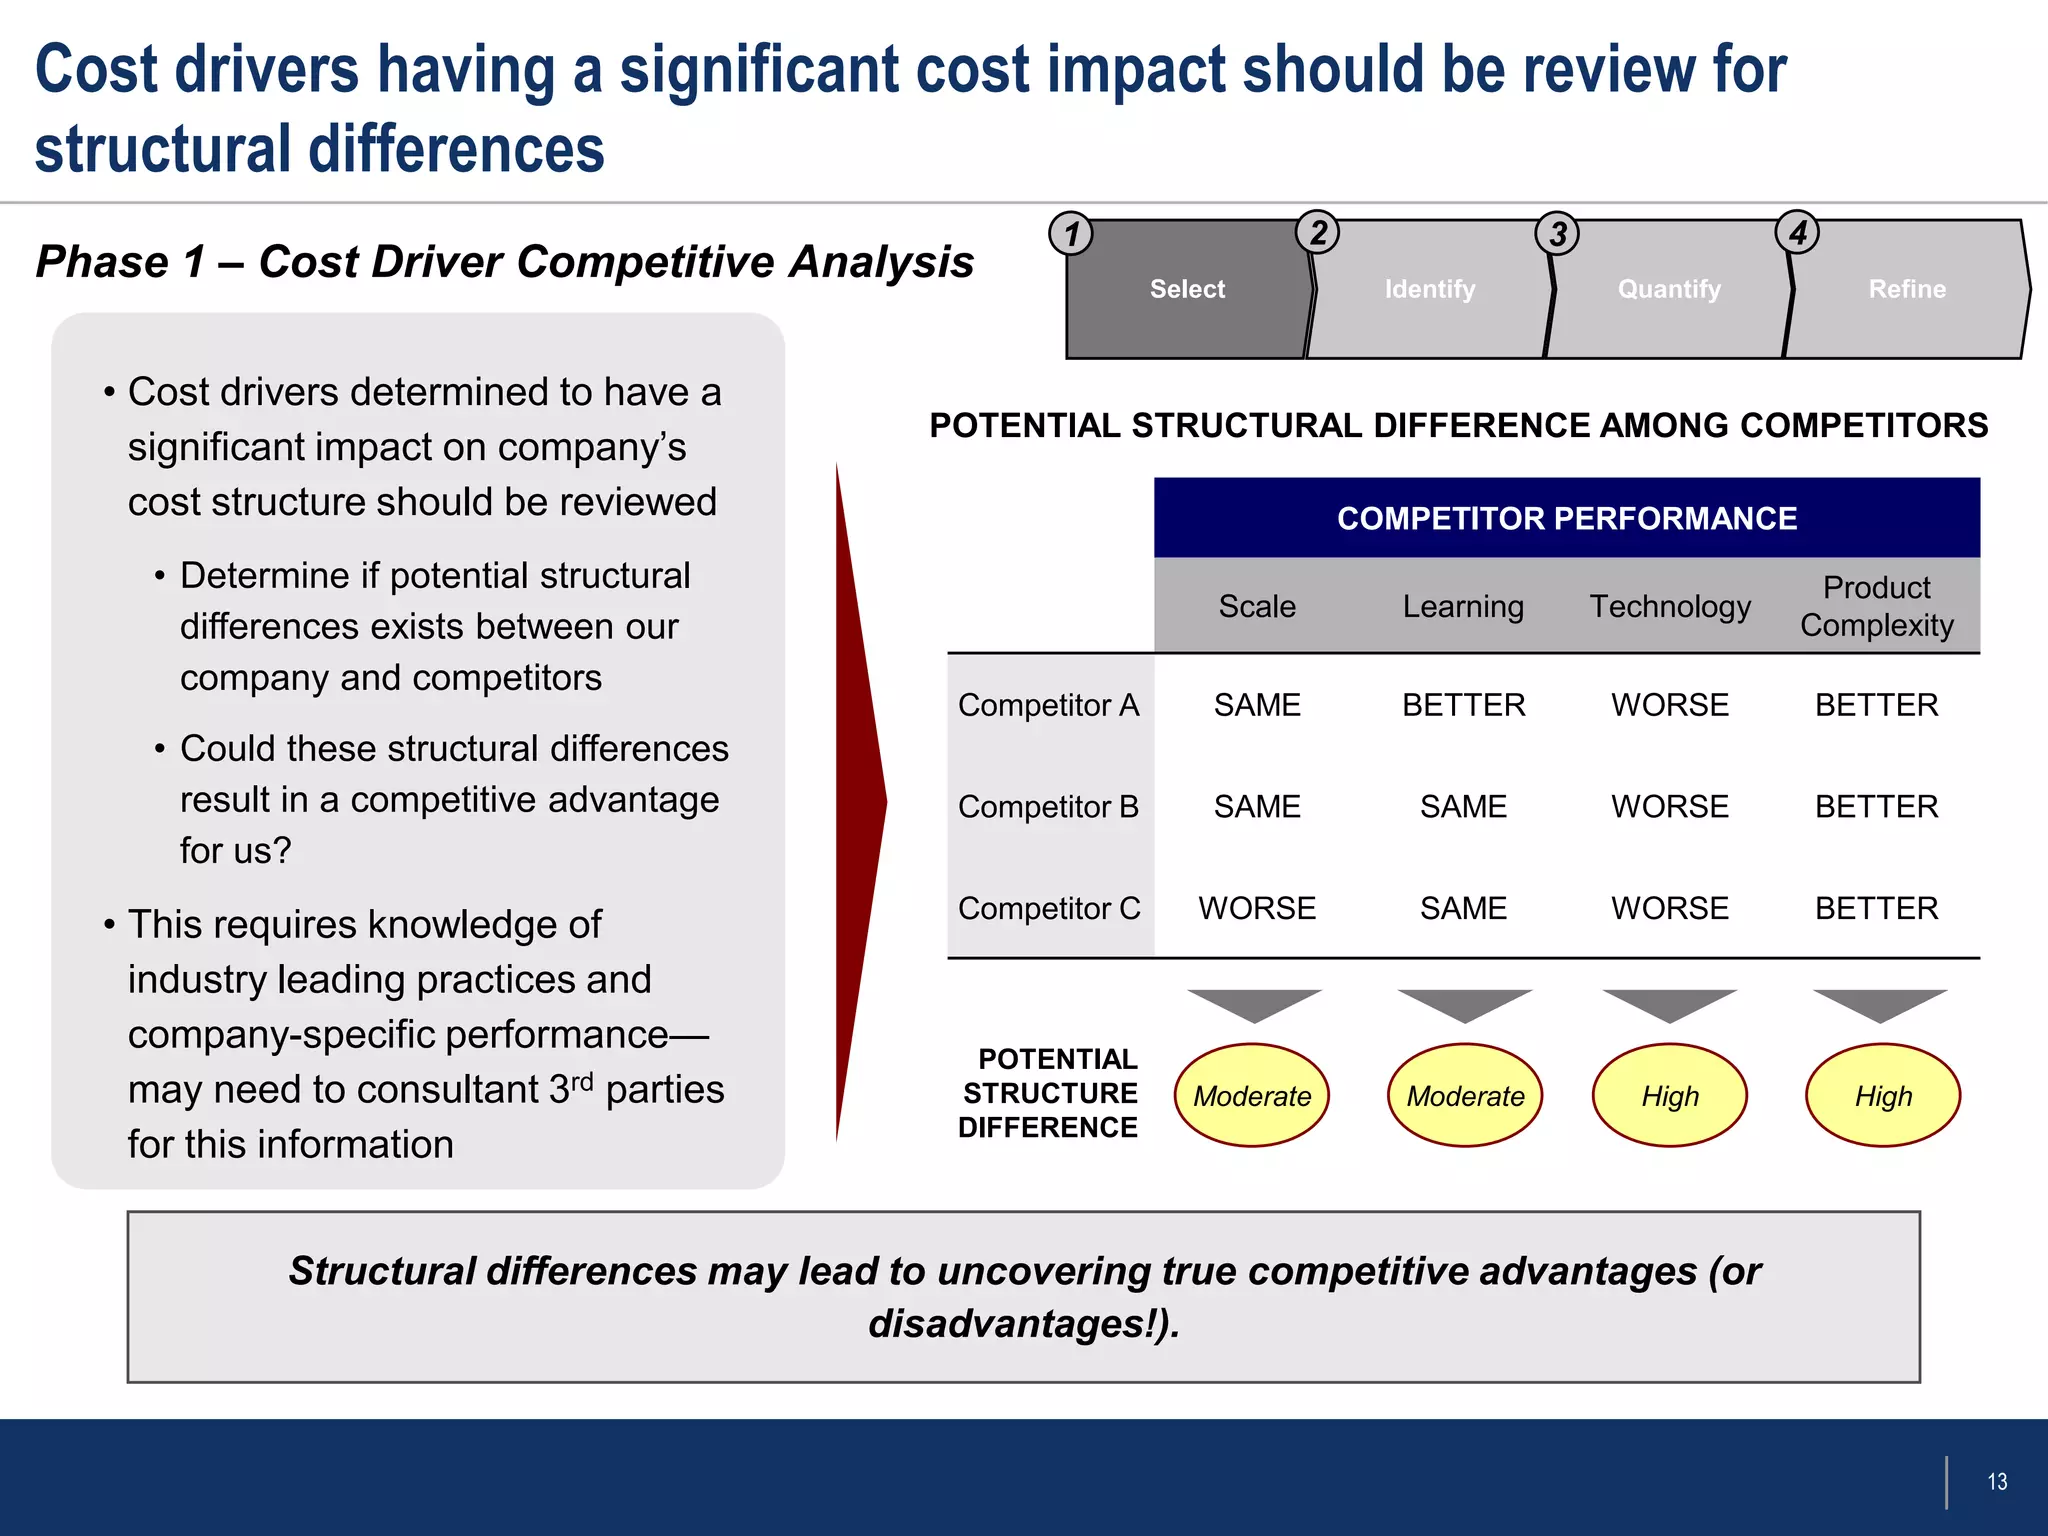
Cost Drivers Analysis
Business Strategy Framework


May 24, 2012
Contents


 • Competitive Cost Analysis
   - Overview
   - Techniques & Level of Effort
   - Cost Drivers Analysis – Benefits & Limitations
 • Approach
   - Phase 1
   - Phase 2
   - Phase 3
   - Phase 4


                                                      3
Cost Drivers Analysis is the focus of this document—and requires
moderate effort to perform
Competitive Cost Analysis – Techniques & Level of Effort

      FINANCIAL RATIO ANALYSIS                              VALUE CHAIN ANALYSIS                           COST DRIVERS ANALYSIS


DETAILS
   • This is a useful starting point for               • This is a framework for analyzing value-      • This analysis is related to Value Chain
     understanding the company’s current                 adding activities of a company                  Analysis in that:
     economic position                                 • It requires identification of the company’s      • Cost drivers are structural causes of
   • It provides perspectives on 3 key                   processes and activities—and                       costs of a business activity
     corporate performance measures:                     understanding how these activities impact        • Cost Drivers Analysis starts with a
       • Current profitability                           and are impacted by other players in end-          high-level identification of the
                                                         customer’s ―value delivery system‖                 company’s value chain
       • Sustainability of profits
                                                       • Once the value delivery system (i.e.        • It does not consider interaction of the
       • Financial risk
                                                         industry value chain) is mapped, cost         company’s cost structure with strategic
   • It is difficult to perform this analysis at the     drivers at each stage of the value delivery   actions of other companies in the industry
     relevant business unit level                        system must be identified
                                                                                                     • Quantifying the cost drivers gives analysts
                                                       • The company’s value delivery system is        significant insight into the cost structure of
                                                         then compared to the value delivery           our company and of competitors
                                                         system of competitors to identify
                                                                                                     • Analysis should focus on cost drivers with
                                                         advantages and improvement
                                                                                                       highest likelihood of having significant
                                                         opportunities
                                                                                                       impact on cost structure of the industry


                    Low Effort                                       High Effort                                   Moderate Effort
                                                                                                                                                        5
Contents


 • Competitive Cost Analysis
   - Overview
   - Techniques & Level of Effort
   - Cost Drivers Analysis – Benefits & Limitations
 • Approach
   - Phase 1
   - Phase 2
   - Phase 3
   - Phase 4


                                                      7
Phase 1. Select the critical cost drivers
                                                                       1                    2                 3              4
Phase 1 – Overview (1 of 2)                                                  Select             Identify          Quantify       Refine


   • To identify critical cost drivers, construct a ―high-level‖ value chain and assign costs to each
     ―value activity‖ (i.e. relevant business processes)

                                                           4%     Firm Infrastructure
                                                     3%    Human Resource Management
                                                       6%       Technology Development
                                                                7%    Procurement


                                       Inbound     Operations        Outbound    Marketing /    Service / After
                                       Logistics                     Logistics   Sales          Sales Support
                                         3%          17%               5%             30%         25%


      Typically, Cost Drivers Analysis is most effective when the
                5-10 critical cost drivers are focused on.


                                                                                                                                          9
Here is a list of ten major cost drivers, as suggested by Michael Porter
                                                                     1               2                  3                4
 Phase 1 – Cost Drivers                                                  Select          Identify            Quantify        Refine

                               •   Facility size
               Scale           •   Production
                               •   Technology                                                 •   Government Regulations
                               •   Operating Efficiency                  Institutional        •   Unionization
                                                                           Factors            •   Taxes
                               •   Run Length
                               •   Factor Costs                                               •   Tariffs
                                                                                              •   Local Content Rules
                               • Scope:
        Interrelationships        • Other Business Units                                      • First-to-Market
                                  • Shared Activities                       Timing            • Timing to Input
                                  • Shared Learning                                           • Purchases
                               •   Product Complexity                                         •   Output Level
           Discretionary       •   Product Variety                        Capacity
                                                                                              •   Facility Utilization
              Policy           •   R&D / Marketing Spend                  Utilization
                                                                                              •   Seasonality
                               •   Delivery Time, Inventory Levels                            •   Cyclicality
                               •   Segments Served                                            •   Forecast Accuracy
                               •   Production Technology Used
                               •   Plant Layout Efficiency                                    • Outsourcing
                                                                         Integration
                                                                                              • Vertical Integration
             Learning          • Experience (cumulative output)
                                                                                              • Internal Process Linkages:
                               •   Transportation Cost                    Linkages                • Quality
                               •   Labor Cost                                                     • Output Linkages (Mfg / Distrib)
              Location
                               •   Raw Materials Cost                                         • Vertical Linkages:
                               •   Energy Cost                                                    • Supplier Imposed Costs
                                                                                                  • Supplier Timeliness
Source: Michael Porter, 1985

                                                                                                                                      11
Cost drivers having a significant cost impact should be review for
structural differences
                                                      1                     2                 3                4
Phase 1 – Cost Driver Competitive Analysis                     Select             Identify         Quantify          Refine


   • Cost drivers determined to have a
                                              POTENTIAL STRUCTURAL DIFFERENCE AMONG COMPETITORS
     significant impact on company’s
     cost structure should be reviewed                                          COMPETITOR PERFORMANCE
     • Determine if potential structural                                                                        Product
                                                                    Scale          Learning       Technology
       differences exists between our                                                                          Complexity
       company and competitors
                                                Competitor A        SAME           BETTER          WORSE           BETTER
     • Could these structural differences
       result in a competitive advantage        Competitor B        SAME             SAME          WORSE           BETTER
       for us?
                                                Competitor C      WORSE              SAME          WORSE           BETTER
   • This requires knowledge of
     industry leading practices and
     company-specific performance—
                                                 POTENTIAL
     may need to consultant 3rd parties         STRUCTURE         Moderate         Moderate          High           High
                                                DIFFERENCE
     for this information


             Structural differences may lead to uncovering true competitive advantages (or
                                            disadvantages!).


                                                                                                                              13
“Critical” cost drivers can now be selected
                                                         1             2               3              4
Phase 1 – Conclusions                                         Select        Identify       Quantify       Refine


  • Two cost drivers selected for further analysis from the running example in the previous slides would be
    technology and product complexity, because…
     • The product complexity and technology cost drivers have large impact on the company’s cost
       structure
     • These two costs drivers are most likely to exhibit structural difference among competitors
  • In this example, we expect that product complexity represents a potential competitive advantage for
    our company, whereas technology represents a potential competitive disadvantage
  • The next three phases in Cost Drivers Analysis seeks to verify these hypotheses through a more
    detailed competitive cost analysis


          At this stage, identified critical cost drivers are only hypotheses—which need to be
                                       validated with further analysis.


                                                                                                                   15
Phase 3. Quantify competition position on these critical cost drivers
                                                         1             2              3              4
Phase 3 – Overview                                            Select       Identify       Quantify       Refine


  • Using the company’s detailed cost data, develop a cost driver model to quantify expenditures on each
    production cost component
  • Use the ―Method of Differences‖ to estimate the cost structure of each competitor
     • Assess the production ―differences‖ experienced by competitors on each cost driver component
     • Estimate how the production process of each competitor might differ from the company’s own
       processes (e.g. machine technology, labor productivity, plant location, delivery costs, etc.)
     • Based on these differences, the quantity of each cost driver component used can be estimated
     • The price paid by each competitor for these cost driver components can be estimated
  • These prices and quantities should be entered into the cost model for each competitor


       A key, underlying assumption is that competitive firms have similar inputs to production
                         process, although quantities may differ significantly.


                                                                                                                  17

Flevy.com - Cost Drivers Analysis

  • 1.
    Cost Drivers Analysis BusinessStrategy Framework May 24, 2012
  • 2.
    Contents • CompetitiveCost Analysis - Overview - Techniques & Level of Effort - Cost Drivers Analysis – Benefits & Limitations • Approach - Phase 1 - Phase 2 - Phase 3 - Phase 4 3
  • 3.
    Cost Drivers Analysisis the focus of this document—and requires moderate effort to perform Competitive Cost Analysis – Techniques & Level of Effort FINANCIAL RATIO ANALYSIS VALUE CHAIN ANALYSIS COST DRIVERS ANALYSIS DETAILS • This is a useful starting point for • This is a framework for analyzing value- • This analysis is related to Value Chain understanding the company’s current adding activities of a company Analysis in that: economic position • It requires identification of the company’s • Cost drivers are structural causes of • It provides perspectives on 3 key processes and activities—and costs of a business activity corporate performance measures: understanding how these activities impact • Cost Drivers Analysis starts with a • Current profitability and are impacted by other players in end- high-level identification of the customer’s ―value delivery system‖ company’s value chain • Sustainability of profits • Once the value delivery system (i.e. • It does not consider interaction of the • Financial risk industry value chain) is mapped, cost company’s cost structure with strategic • It is difficult to perform this analysis at the drivers at each stage of the value delivery actions of other companies in the industry relevant business unit level system must be identified • Quantifying the cost drivers gives analysts • The company’s value delivery system is significant insight into the cost structure of then compared to the value delivery our company and of competitors system of competitors to identify • Analysis should focus on cost drivers with advantages and improvement highest likelihood of having significant opportunities impact on cost structure of the industry Low Effort High Effort Moderate Effort 5
  • 4.
    Contents • CompetitiveCost Analysis - Overview - Techniques & Level of Effort - Cost Drivers Analysis – Benefits & Limitations • Approach - Phase 1 - Phase 2 - Phase 3 - Phase 4 7
  • 5.
    Phase 1. Selectthe critical cost drivers 1 2 3 4 Phase 1 – Overview (1 of 2) Select Identify Quantify Refine • To identify critical cost drivers, construct a ―high-level‖ value chain and assign costs to each ―value activity‖ (i.e. relevant business processes) 4% Firm Infrastructure 3% Human Resource Management 6% Technology Development 7% Procurement Inbound Operations Outbound Marketing / Service / After Logistics Logistics Sales Sales Support 3% 17% 5% 30% 25% Typically, Cost Drivers Analysis is most effective when the 5-10 critical cost drivers are focused on. 9
  • 6.
    Here is alist of ten major cost drivers, as suggested by Michael Porter 1 2 3 4 Phase 1 – Cost Drivers Select Identify Quantify Refine • Facility size Scale • Production • Technology • Government Regulations • Operating Efficiency Institutional • Unionization Factors • Taxes • Run Length • Factor Costs • Tariffs • Local Content Rules • Scope: Interrelationships • Other Business Units • First-to-Market • Shared Activities Timing • Timing to Input • Shared Learning • Purchases • Product Complexity • Output Level Discretionary • Product Variety Capacity • Facility Utilization Policy • R&D / Marketing Spend Utilization • Seasonality • Delivery Time, Inventory Levels • Cyclicality • Segments Served • Forecast Accuracy • Production Technology Used • Plant Layout Efficiency • Outsourcing Integration • Vertical Integration Learning • Experience (cumulative output) • Internal Process Linkages: • Transportation Cost Linkages • Quality • Labor Cost • Output Linkages (Mfg / Distrib) Location • Raw Materials Cost • Vertical Linkages: • Energy Cost • Supplier Imposed Costs • Supplier Timeliness Source: Michael Porter, 1985 11
  • 7.
    Cost drivers havinga significant cost impact should be review for structural differences 1 2 3 4 Phase 1 – Cost Driver Competitive Analysis Select Identify Quantify Refine • Cost drivers determined to have a POTENTIAL STRUCTURAL DIFFERENCE AMONG COMPETITORS significant impact on company’s cost structure should be reviewed COMPETITOR PERFORMANCE • Determine if potential structural Product Scale Learning Technology differences exists between our Complexity company and competitors Competitor A SAME BETTER WORSE BETTER • Could these structural differences result in a competitive advantage Competitor B SAME SAME WORSE BETTER for us? Competitor C WORSE SAME WORSE BETTER • This requires knowledge of industry leading practices and company-specific performance— POTENTIAL may need to consultant 3rd parties STRUCTURE Moderate Moderate High High DIFFERENCE for this information Structural differences may lead to uncovering true competitive advantages (or disadvantages!). 13
  • 8.
    “Critical” cost driverscan now be selected 1 2 3 4 Phase 1 – Conclusions Select Identify Quantify Refine • Two cost drivers selected for further analysis from the running example in the previous slides would be technology and product complexity, because… • The product complexity and technology cost drivers have large impact on the company’s cost structure • These two costs drivers are most likely to exhibit structural difference among competitors • In this example, we expect that product complexity represents a potential competitive advantage for our company, whereas technology represents a potential competitive disadvantage • The next three phases in Cost Drivers Analysis seeks to verify these hypotheses through a more detailed competitive cost analysis At this stage, identified critical cost drivers are only hypotheses—which need to be validated with further analysis. 15
  • 9.
    Phase 3. Quantifycompetition position on these critical cost drivers 1 2 3 4 Phase 3 – Overview Select Identify Quantify Refine • Using the company’s detailed cost data, develop a cost driver model to quantify expenditures on each production cost component • Use the ―Method of Differences‖ to estimate the cost structure of each competitor • Assess the production ―differences‖ experienced by competitors on each cost driver component • Estimate how the production process of each competitor might differ from the company’s own processes (e.g. machine technology, labor productivity, plant location, delivery costs, etc.) • Based on these differences, the quantity of each cost driver component used can be estimated • The price paid by each competitor for these cost driver components can be estimated • These prices and quantities should be entered into the cost model for each competitor A key, underlying assumption is that competitive firms have similar inputs to production process, although quantities may differ significantly. 17