Downloaded 2,455 times


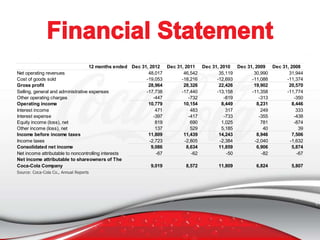
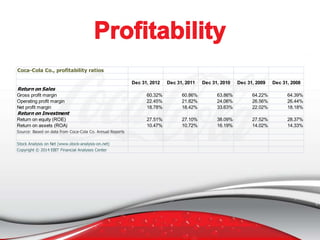


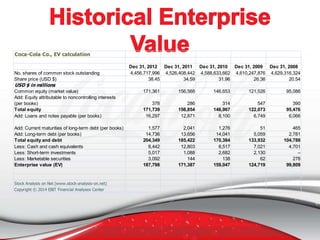


Coca-Cola Co. demonstrated significant financial growth from 2008 to 2012, with net operating revenues increasing from $31,944 million in 2008 to $48,017 million in 2012. Profitability ratios such as return on equity and net profit margin indicate healthy operational performance, while an increase in leverage contributed to the rise in return on equity. The company's enterprise value also showed a consistent increase, suggesting it is a safe investment.


