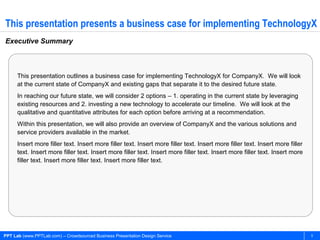
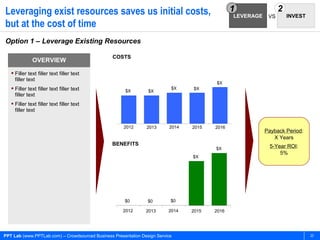
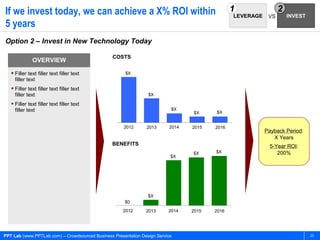
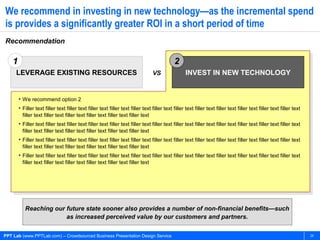
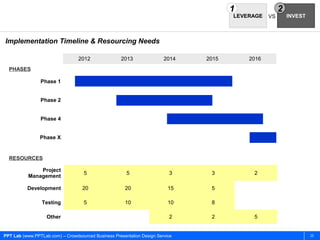
1. Crowdsourced Business
Presentation Design Service
New Technology Business Case
Introduction of a New Technology
into an Organization
This presentation template outlines a business case for implementing a “Technology
X” into an organization. It can be used to introduce and highlight the benefits of a
new technology, conduct a high-level gap analysis, and present a business case for
the technology’s implementation over operating in the company’s current state.
ORIGINAL PROJECT DETAILS August 28, 2012
http://pptlab.com/presentation?pid=1
2. PPT Lab (www.pptlab.com) is the only crowdsourced
presentation design service. Get consulting-quality
presentations at a fraction of the cost!
www.PPTLab.com
support@pptlab.com Each month, we will create well over 50 slides of for our members.
As a member, you will drive what business slides we create by
submitting your own presentation projects to our team. All
presentations will be created by a team of management
consultants and follow the Consulting Presentation Framework.
PPT Lab (www.PPTLab.com) – Crowdsourced Business Presentation Design Service 2
3. Contents
Overview X
Gap Analysis X
– Current State X
– Gaps X
– Future State X
Strategic Options X
– Recommendation X
Next Steps X
Appendix X
PPT Lab (www.PPTLab.com) – Crowdsourced Business Presentation Design Service 3
4. Contents
Overview
Gap Analysis
– Current State
– Gaps
– Future State
Strategic Options
– Recommendation
Next Steps
Appendix
PPT Lab (www.PPTLab.com) – Crowdsourced Business Presentation Design Service 4
5. This presentation presents a business case for implementing TechnologyX
Executive Summary
This presentation outlines a business case for implementing TechnologyX for CompanyX. We will look
at the current state of CompanyX and existing gaps that separate it to the desired future state.
In reaching our future state, we will consider 2 options – 1. operating in the current state by leveraging
existing resources and 2. investing a new technology to accelerate our timeline. We will look at the
qualitative and quantitative attributes for each option before arriving at a recommendation.
Within this presentation, we will also provide an overview of CompanyX and the various solutions and
service providers available in the market.
Insert more filler text. Insert more filler text. Insert more filler text. Insert more filler text. Insert more filler
text. Insert more filler text. Insert more filler text. Insert more filler text. Insert more filler text. Insert more
filler text. Insert more filler text. Insert more filler text.
PPT Lab (www.PPTLab.com) – Crowdsourced Business Presentation Design Service 5
6. Big Data refers to data sets whose sizes is beyond the ability of commonly
used software tools—we must rely on emerging technology for Big Data
Overview of TechnologyX
Big Data is a term applied to data sets whose size is beyond the ability of commonly used software
tools to capture, manage, and process within a tolerable elapsed time. Big Data sizes are a constantly
moving target currently ranging from a few dozen terabytes to many petabytes in a single data set.
Examples of Big Data include Web logs; RFID; sensor networks; social networks; Internet text and
documents; Internet search indexing; call detail records; astronomy, atmospheric science, biological,
genomics, biochemical, medical records; scientific research; military surveillance; photography
archives; video archives; and large scale eCommerce.
Being able to analyze and understand Big Data arms organizations with invaluable operational and
consumer insights. The issue is having the technology to be able to effectively and accurately process
such massive amounts of data. There are currently several software vendors focused on the issue of
Big Data.
Through analysis of Big Data, companies can gain invaluable operational and consumer
insights.
Source: Hadoop and the Data Warehouse, 2011
PPT Lab (www.PPTLab.com) – Crowdsourced Business Presentation Design Service 6
7. Taking into the account the cost and features trade-offs, Vendor X provides
the best fit for our organization
Vendor Comparison
INSERT LOGO
Implementation Costs $200K $XK
Ongoing Maintenance
Costs (Annual) $20K $50K $XK
Feature Set X
Feature Set Y
Feature Set Z
Vendor X provides the best fit
in terms of both technology
and budget
Source: Cloudera Hadoop website, Whitepaper X
PPT Lab (www.PPTLab.com) – Crowdsourced Business Presentation Design Service 7
8. Taking into the account the cost and features trade-offs, Vendor X provides
the best fit for our organization
Vendor Comparison – Competitive Landscape
High
Vendor X provides the
Medium
TECHNOLOGY
CAPABILITIES best fit in terms of both
technology and budget
Low
Low Medium High
COST
Source:
PPT Lab (www.PPTLab.com) – Crowdsourced Business Presentation Design Service 8
9. Source:
SWOT Analysis – VendorX
OPPORTUNITIES THREATS
Insert filler text insert filler text insert Insert filler text insert filler text insert
filler text insert filler text filler text insert filler text
Insert filler text insert filler text insert Insert filler text insert filler text insert
filler text insert filler text filler text insert filler text
Insert filler text insert filler text insert Insert filler text insert filler text insert
filler text insert filler text filler text insert filler text
STRENGTHS
PPT Lab (www.PPTLab.com) – Crowdsourced Business Presentation Design Service
Insert filler text insert filler text insert Insert filler text insert filler text insert
filler text insert filler text filler text insert filler text
Insert filler text insert filler text insert Insert filler text insert filler text insert
filler text insert filler text filler text insert filler text
Insert filler text insert filler text insert Insert filler text insert filler text insert
filler text insert filler text filler text insert filler text
WEAKNESSES
Insert key takeaway for vendor based on SWOT.
9
10. Contents
Overview
Gap Analysis
– Current State
– Gaps
– Future State
Strategic Options
– Recommendation
Next Steps
Appendix
PPT Lab (www.PPTLab.com) – Crowdsourced Business Presentation Design Service 10
11. Critical gaps currently exist—separating us from our desired Future State
Application to CompanyX
CURRENT STATE GAPS FUTURE STATE
• Filler text filler text filler text filler • Filler text filler text filler text filler • Filler text filler text filler text filler
text filler text filler text text filler text filler text text filler text filler text
• Filler text filler text filler text filler • Filler text filler text filler text filler • Filler text filler text filler text filler
text filler text filler text text filler text filler text text filler text filler text
• Filler text filler text filler text filler • Filler text filler text filler text filler • Filler text filler text filler text filler
text filler text filler text text filler text filler text text filler text filler text
• Filler text filler text filler text filler • Filler text filler text filler text filler • Filler text filler text filler text filler
text filler text filler text text filler text filler text text filler text filler text
• Filler text filler text filler text filler • Filler text filler text filler text filler • Filler text filler text filler text filler
text filler text filler text text filler text filler text text filler text filler text
• Filler text filler text filler text filler • Filler text filler text filler text filler • Filler text filler text filler text filler
text filler text filler text text filler text filler text text filler text filler text
PPT Lab (www.PPTLab.com) – Crowdsourced Business Presentation Design Service 11
12. By implementing TechnologyX, we can bring our organization from Level 1
to Level 5 on the Capability Maturity Model
Capability Maturity Model Level 5
OPTIMIZING
In the current state, we are here.
In this stage, processes are Level 4
unpredictable, poorly controlled,
and reactive.
QUANTITATIVELY
MANAGED
Level 3
DEFINED After implementation of
TechnologyX, our future state will
be here. In this phase, processes
are already measured and
Level 2
controlled—the focus is now on
MANAGED process optimization. This will take
X years and result in <insert text
about benefits>.
Level 1
INITIAL
time
Most of our competitors are in levels 3-4—implementation of Technology provides us
with a competitive advantage.
Source: What is CMMI, Godfrey, NASA
PPT Lab (www.PPTLab.com) – Crowdsourced Business Presentation Design Service 12
13. The BI Maturity Model shows the natural growth of and impact on
organizations as they successfully implement and leverage BI technologies
BI Maturity Model
LEVEL 1 LEVEL 2 LEVEL 3 LEVEL 4 LEVEL 5
UNAWARE TACTICAL FOCUSED STRATEGIC PERVASIVE
• Complete lack of • No business • Funding from • Establish a
awareness sponsor, IT business units on a balanced portfolio • Use of BI is
• Spreadsheet and executive in charge project-by-project of standards extended to
information anarchy • Limited users basis • Business objectives suppliers,
• One-off reporting • Data inconsistency • Specific set of users drive BI and customers, and
requests and stove-piped is realizing value performance business partners
systems • Successful focus on management • Analytics are
a specific business strategies inserted into and
need • Deploy an around the
enterprise metrics business process
framework • Information is
• Governance trusted across the
policies are defined company
and enforced
time
We are currently at level 1, INSERT BUMPER TAKE-AWAY STATEMENT.
Source: Gartner Maturity Model, 2008
PPT Lab (www.PPTLab.com) – Crowdsourced Business Presentation Design Service 13
14. By implementing TechnologyX, we can bring our organization from Level 1
to Level 5 on the Maturity Model
Maturity Model
LEVEL 1 LEVEL 2 LEVEL 3 LEVEL 4 LEVEL 5
UNAWARE TACTICAL FOCUSED STRATEGIC PERVASIVE
In the current state, we are at the end
of Level 1 and start of Level 2. Data is
inconsistent and processes are
largely dependent on spreadsheets.
There is no business sponsor.
Processes and systems are led by IT.
After implementation of TechnologyX, our
future state will be here. In this phase, use
of BI has already been extended to
partners and vendors. Information is
trusted across the organization. Business
processes are refined and complemented
with analytics.
time
Most of our competitors are in levels 3-4—implementation of Technology provides us
with a competitive advantage.
Source: Gartner Maturity Model, 2008
PPT Lab (www.PPTLab.com) – Crowdsourced Business Presentation Design Service 14
15. The Maturity Model shows the technological, organizational, and
operational attributes across 5 levels of technology integration
Maturity Model (1 of 2)
LEVEL 1 LEVEL 2 LEVEL 3 LEVEL 4 LEVEL 5
INSERT INSERT INSERT INSERT INSERT
NAME NAME NAME NAME NAME
Technology
Organization
Operations
time
We are currently at level 1, INSERT BUMPER TAKE-AWAY STATEMENT.
PPT Lab (www.PPTLab.com) – Crowdsourced Business Presentation Design Service 15
16. By implementing TechnologyX, we can bring our organization from Level 1
to Level 5 on the Maturity Model
Maturity Model (2 of 2)
LEVEL 1 LEVEL 2 LEVEL 3 LEVEL 4 LEVEL 5
INSERT INSERT INSERT INSERT INSERT
NAME NAME NAME NAME NAME
Technology
Organization
Operations
time
Most of our competitors are in levels 3-4—implementation of Technology provides us
with a competitive advantage.
PPT Lab (www.PPTLab.com) – Crowdsourced Business Presentation Design Service 16
17. CURRENT FUTURE
STATE
GAPS STATE
In the current state …
Current State Deep Dive
• Filler text filler text filler text filler text filler text filler text filler text filler text filler text filler text filler text filler text filler text filler
text filler text filler text
• Filler text filler text filler text filler text filler text filler text filler text filler text filler text filler text filler text filler text filler text filler
text filler text filler text
• Filler text filler text filler text filler text filler text filler text filler text filler text filler text filler text filler text filler text filler text filler
text filler text filler text
• Filler text filler text filler text filler text filler text filler text filler text filler text filler text filler text filler text filler text filler text filler
text filler text filler text
• Filler text filler text filler text filler text filler text filler text filler text filler text filler text filler text filler text filler text filler text filler
text filler text filler text
• Filler text filler text filler text filler text filler text filler text filler text filler text filler text filler text filler text filler text filler text filler
text filler text filler text
• Filler text filler text filler text filler text filler text filler text filler text filler text filler text filler text filler text filler text filler text filler
text filler text filler text
Insert statement around the current state business value.
PPT Lab (www.PPTLab.com) – Crowdsourced Business Presentation Design Service 17
18. CURRENT FUTURE
STATE
GAPS STATE
Insert Headline
Gaps Deep Dive
• Filler text filler text filler text filler text filler text filler text filler text filler text filler text filler text filler text filler text filler text filler
text filler text filler text
• Filler text filler text filler text filler text filler text filler text filler text filler text filler text filler text filler text filler text filler text filler
text filler text filler text
• Filler text filler text filler text filler text filler text filler text filler text filler text filler text filler text filler text filler text filler text filler
text filler text filler text
• Filler text filler text filler text filler text filler text filler text filler text filler text filler text filler text filler text filler text filler text filler
text filler text filler text
• Filler text filler text filler text filler text filler text filler text filler text filler text filler text filler text filler text filler text filler text filler
text filler text filler text
• Filler text filler text filler text filler text filler text filler text filler text filler text filler text filler text filler text filler text filler text filler
text filler text filler text
• Filler text filler text filler text filler text filler text filler text filler text filler text filler text filler text filler text filler text filler text filler
text filler text filler text
Bumper text.
PPT Lab (www.PPTLab.com) – Crowdsourced Business Presentation Design Service 18
19. CURRENT FUTURE
STATE
GAPS STATE
In the future …
Future State Deep Dive
• Filler text filler text filler text filler text filler text filler text filler text filler text filler text filler text filler text filler text filler text filler
text filler text filler text
• Filler text filler text filler text filler text filler text filler text filler text filler text filler text filler text filler text filler text filler text filler
text filler text filler text
• Filler text filler text filler text filler text filler text filler text filler text filler text filler text filler text filler text filler text filler text filler
text filler text filler text
• Filler text filler text filler text filler text filler text filler text filler text filler text filler text filler text filler text filler text filler text filler
text filler text filler text
• Filler text filler text filler text filler text filler text filler text filler text filler text filler text filler text filler text filler text filler text filler
text filler text filler text
• Filler text filler text filler text filler text filler text filler text filler text filler text filler text filler text filler text filler text filler text filler
text filler text filler text
• Filler text filler text filler text filler text filler text filler text filler text filler text filler text filler text filler text filler text filler text filler
text filler text filler text
Insert statement around future state business value achieved.
PPT Lab (www.PPTLab.com) – Crowdsourced Business Presentation Design Service 19
20. Contents
Overview
Gap Analysis
– Current State
– Gaps
– Future State
Strategic Options
– Recommendation
Next Steps
Appendix
PPT Lab (www.PPTLab.com) – Crowdsourced Business Presentation Design Service 20
21. In order to reach the future state, we can either leverage existing resources
or invest in new technology
Leverage or Invest
How do we get to the future?
LEVEL 1 LEVEL 5
INITIAL OPTIMIZING
1 LEVERAGE EXISTING RESOURCES VS 2 INVEST IN NEW TECHNOLOGY
Our first option is to operate with our current In the second option, we invest in new technology to
resources and grow from level 1 to level 5 organically improve our current state and expedite our growth to
level 5
This is the conservative option—it is slower and
requires no additional financial investment This is the aggressive option—it requires immediate
financial investment to achieve more immediate
results
PPT Lab (www.PPTLab.com) – Crowdsourced Business Presentation Design Service 21
22. Leveraging exist resources saves us initial costs, 1 2
LEVERAGE VS INVEST
but at the cost of time
Option 1 – Leverage Existing Resources
COSTS
OVERVIEW
Filler text filler text filler text
filler text
$X
Filler text filler text filler text $X $X
$X $X
filler text
Filler text filler text filler text
filler text
2012 2013 2014 2015 2016
Payback Period:
X Years
BENEFITS 5-Year ROI:
$X
5%
$X
$0 $0 $0
2012 2013 2014 2015 2016
PPT Lab (www.PPTLab.com) – Crowdsourced Business Presentation Design Service 22
23. If we invest today, we can achieve a X% ROI within 1 2
LEVERAGE VS INVEST
5 years
Option 2 – Invest in New Technology Today
COSTS
OVERVIEW
Filler text filler text filler text $X
filler text
Filler text filler text filler text
filler text $X
Filler text filler text filler text
filler text $X
$X $X
2012 2013 2014 2015 2016
Payback Period:
X Years
BENEFITS 5-Year ROI:
$X $X 200%
$X
$X
$0
2012 2013 2014 2015 2016
PPT Lab (www.PPTLab.com) – Crowdsourced Business Presentation Design Service 23
24. We recommend in investing in new technology—as the incremental spend
is provides a significantly greater ROI in a short period of time
Recommendation
1 2
LEVERAGE EXISTING RESOURCES VS INVEST IN NEW TECHNOLOGY
• We recommend option 2
• Filler text filler text filler text filler text filler text filler text filler text filler text filler text filler text filler text filler text filler text
filler text filler text filler text filler text filler text filler text
• Filler text filler text filler text filler text filler text filler text filler text filler text filler text filler text filler text filler text filler text
filler text filler text filler text filler text filler text filler text
• Filler text filler text filler text filler text filler text filler text filler text filler text filler text filler text filler text filler text filler text
filler text filler text filler text filler text filler text filler text
• Filler text filler text filler text filler text filler text filler text filler text filler text filler text filler text filler text filler text filler text
filler text filler text filler text filler text filler text filler text
Reaching our future state sooner also provides a number of non-financial benefits—such
as increased perceived value by our customers and partners.
PPT Lab (www.PPTLab.com) – Crowdsourced Business Presentation Design Service 24
25. 1 2
LEVERAGE VS INVEST
Implementation Timeline & Resourcing Needs
2012 2013 2014 2015 2016
PHASES
Phase 1
Phase 2
Phase 4
Phase X
RESOURCES
Project
5 5 3 3 2
Management
Development 20 20 15 5
Testing 5 10 10 8
Other 2 2 5
PPT Lab (www.PPTLab.com) – Crowdsourced Business Presentation Design Service 25
26. 1 2
LEVERAGE VS INVEST
Implementation Timeline & Resourcing Needs
Approach & Timeline
OBJECTIVES
Month 1 Month 2 Month 3 Month 4 Month 5
Insert filler text insert filler
text insert filler text
Insert filler text insert filler Conduct Gap Analysis and Evaluate and Prioritize Develop
text insert filler text Determine Project Portfolio Portfolio of Initiatives Roadmap
Insert filler text insert filler
text insert filler text
Insert filler text insert filler IT Project Future State
Gap Analysis Prioritized Projects
text insert filler text Portfolio Roadmap
Evaluate Value and Feasibility Roadmap
Insert filler text insert filler Current Future
Quick Hits
text insert filler text Situation Vision
Existing
Initiatives
Oppor- New Prioritized List of Initiatives
Gaps
tunities Initiatives
Conducting a gap analysis allows to tactically prioritize our initiatives to achieve the
greatest business value.
PPT Lab (www.PPTLab.com) – Crowdsourced Business Presentation Design Service 26
27. 1 2
LEVERAGE VS INVEST
Business Value over Time
2012 2013 2014 2015 2016
$XM $XM
$XM
Business value is
$XM driven by
$XM headcount
reduction of X and
time savings of Y
Filler text filler text Filler text filler text Filler text filler text Filler text filler text Filler text filler text
filler text filler text filler text filler text filler text
Filler text filler text Filler text filler text Filler text filler text Filler text filler text Filler text filler text
filler text filler text filler text filler text filler text
Filler text filler text Filler text filler text Filler text filler text Filler text filler text Filler text filler text
filler text filler text filler text filler text filler text
Filler text filler text Filler text filler text Filler text filler text Filler text filler text Filler text filler text
filler text filler text filler text filler text filler text
PPT Lab (www.PPTLab.com) – Crowdsourced Business Presentation Design Service 27
28. Contents
Overview
Gap Analysis
– Current State
– Gaps
– Future State
Strategic Options
– Recommendation
Next Steps
Appendix
PPT Lab (www.PPTLab.com) – Crowdsourced Business Presentation Design Service 28
29. Next Steps
Meet with Stakeholder X, Stakeholder Y to discuss …
Insert next step/action item text
PPT Lab (www.PPTLab.com) – Crowdsourced Business Presentation Design Service 29
30. Contents
Overview
Gap Analysis
– Current State
– Gaps
– Future State
Strategic Options
– Recommendation
Next Steps
Appendix
PPT Lab (www.PPTLab.com) – Crowdsourced Business Presentation Design Service 30
31. PPT Lab (www.pptlab.com) is the only crowdsourced
presentation design service. Get consulting-quality
presentations at a fraction of the cost!
www.PPTLab.com
support@pptlab.com Each month, we will create well over 50 slides of for our members.
As a member, you will drive what business slides we create by
submitting your own presentation projects to our team. All
presentations will be created by a team of management
consultants and follow the Consulting Presentation Framework.
PPT Lab (www.PPTLab.com) – Crowdsourced Business Presentation Design Service 31