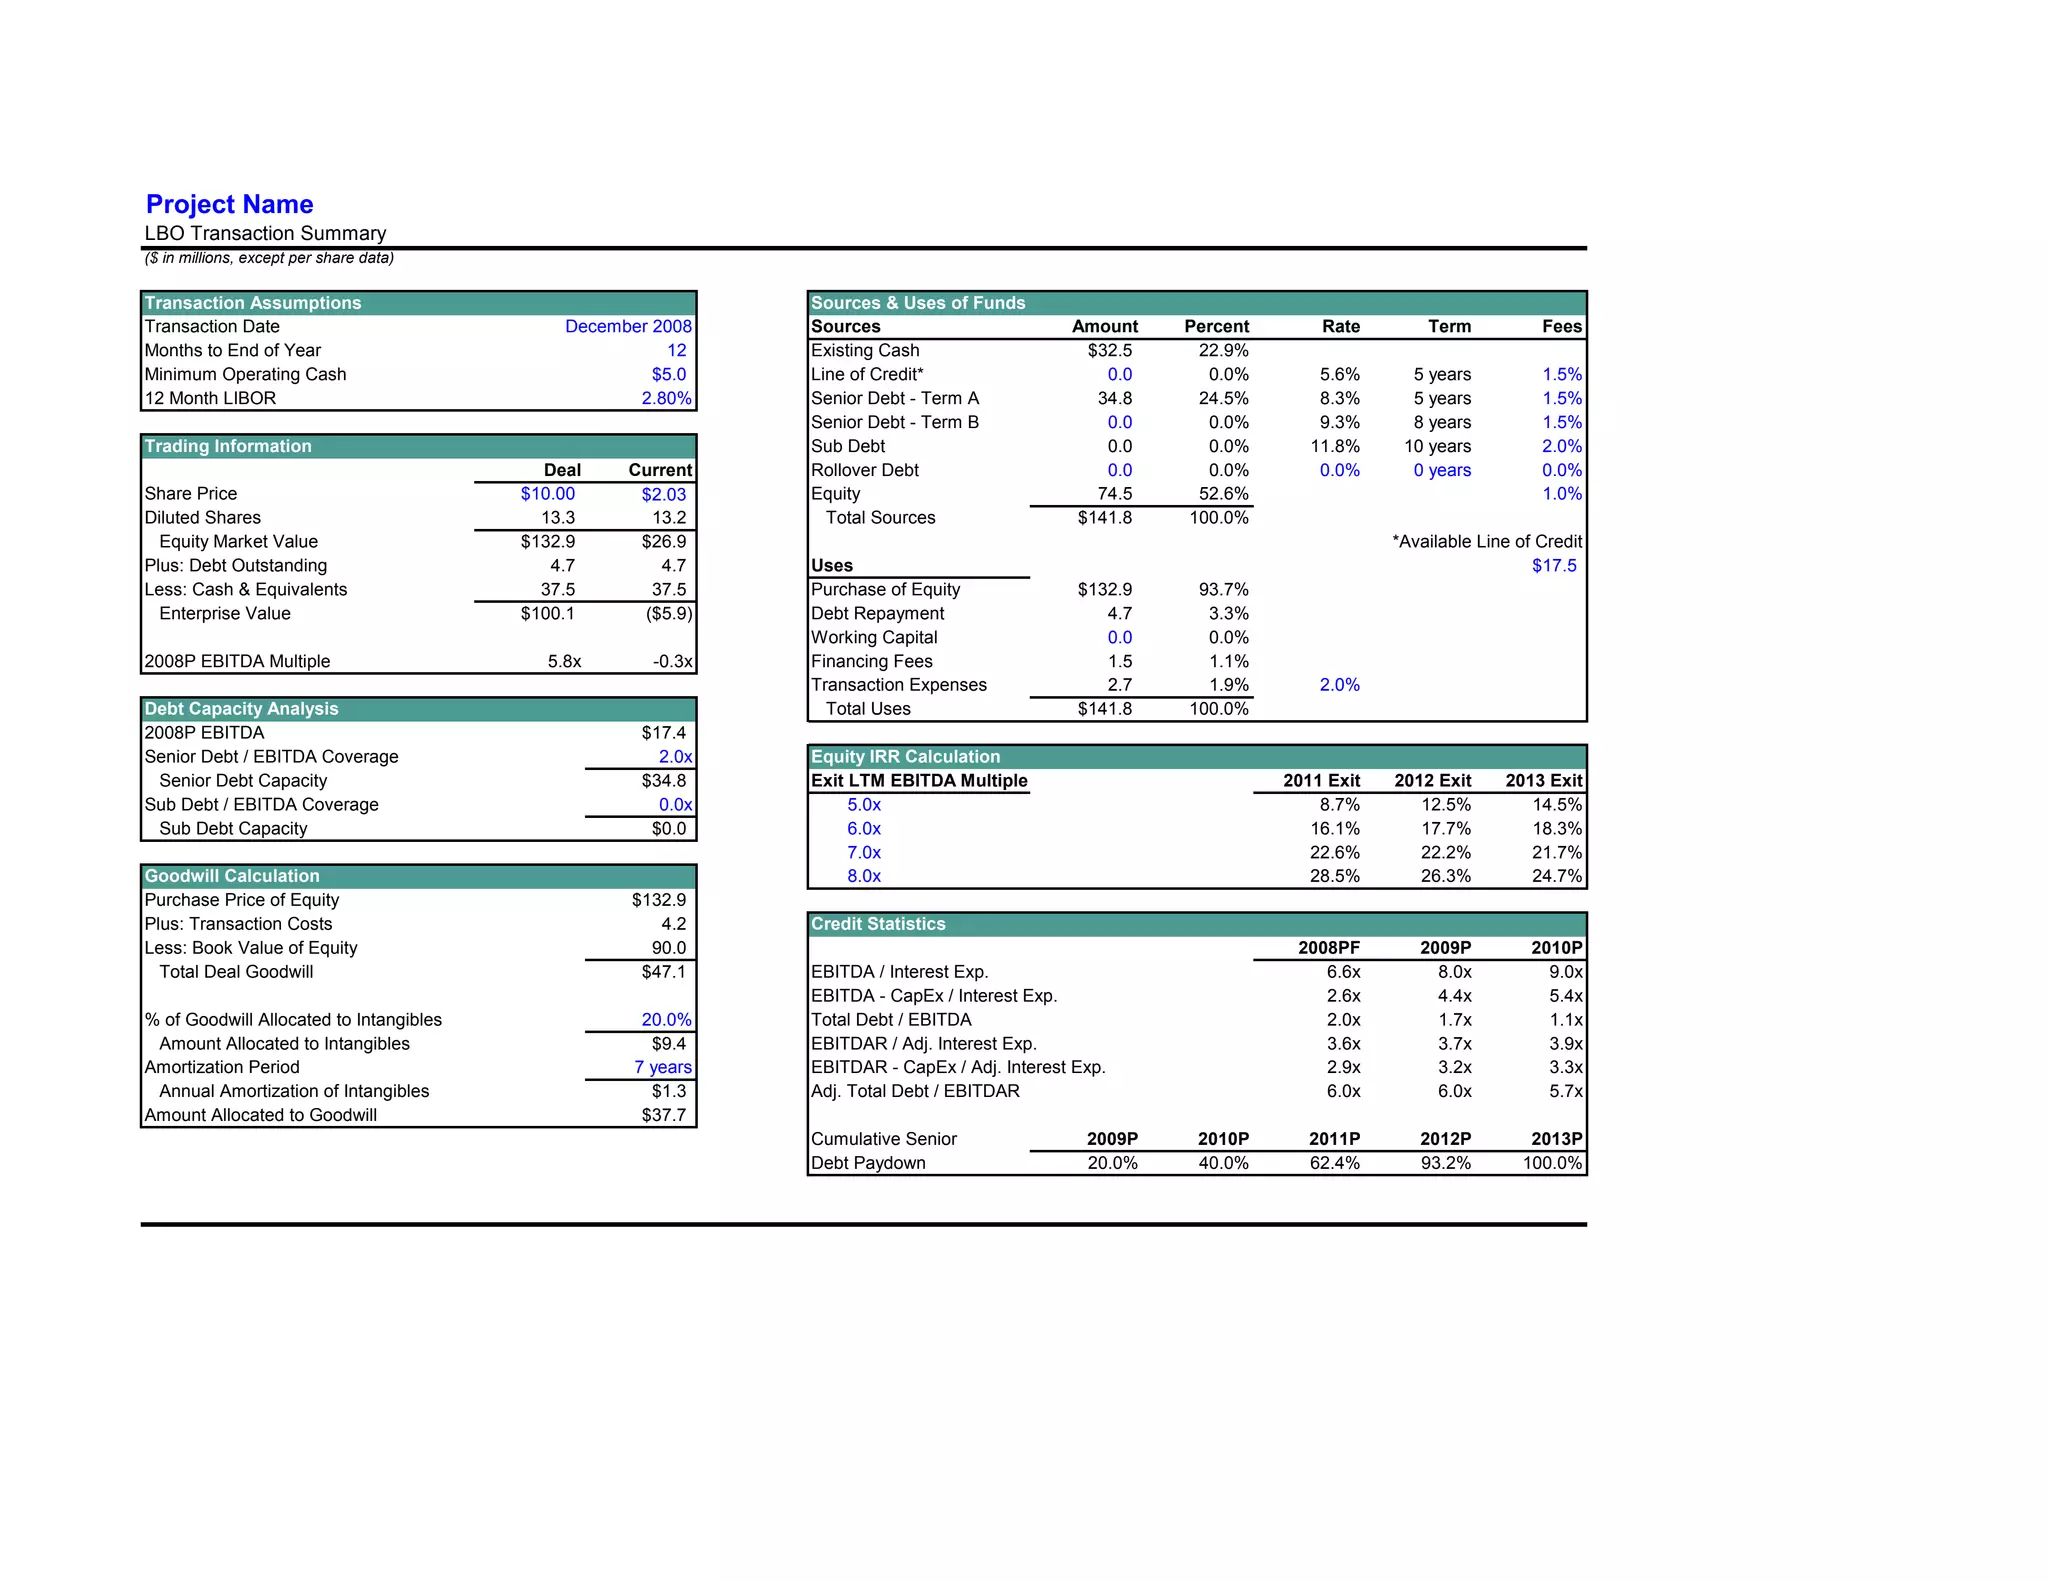
Project Name
LBO Transaction Summary
($ in millions, except per share data)

Transaction Assumptions                                       Sources & Uses of Funds
Transaction Date                             December 2008    Sources                        Amount    Percent       Rate        Term           Fees
Months to End of Year                                   12    Existing Cash                   $32.5     22.9%
Minimum Operating Cash                                $5.0    Line of Credit*                   0.0      0.0%        5.6%      5 years          1.5%
12 Month LIBOR                                      2.80%     Senior Debt - Term A             34.8     24.5%        8.3%      5 years          1.5%
                                                              Senior Debt - Term B              0.0      0.0%        9.3%      8 years          1.5%
Trading Information                                           Sub Debt                          0.0      0.0%       11.8%     10 years          2.0%
                                           Deal    Current    Rollover Debt                     0.0      0.0%        0.0%      0 years          0.0%
Share Price                              $10.00     $2.03     Equity                           74.5     52.6%                                   1.0%
Diluted Shares                             13.3      13.2       Total Sources                $141.8    100.0%
  Equity Market Value                    $132.9     $26.9                                                                    *Available Line of Credit
Plus: Debt Outstanding                      4.7       4.7     Uses                                                                             $17.5
Less: Cash & Equivalents                   37.5      37.5     Purchase of Equity              $132.9    93.7%
  Enterprise Value                       $100.1     ($5.9)    Debt Repayment                     4.7     3.3%
                                                              Working Capital                    0.0     0.0%
2008P EBITDA Multiple                      5.8x       -0.3x   Financing Fees                     1.5     1.1%
                                                              Transaction Expenses               2.7     1.9%        2.0%
Debt Capacity Analysis                                          Total Uses                    $141.8   100.0%
2008P EBITDA                                        $17.4
Senior Debt / EBITDA Coverage                         2.0x    Equity IRR Calculation
 Senior Debt Capacity                               $34.8     Exit LTM EBITDA Multiple                           2011 Exit   2012 Exit     2013 Exit
Sub Debt / EBITDA Coverage                            0.0x         5.0x                                              8.7%       12.5%         14.5%
 Sub Debt Capacity                                   $0.0          6.0x                                             16.1%       17.7%         18.3%
                                                                   7.0x                                             22.6%       22.2%         21.7%
Goodwill Calculation                                               8.0x                                             28.5%       26.3%         24.7%
Purchase Price of Equity                           $132.9
Plus: Transaction Costs                               4.2     Credit Statistics
Less: Book Value of Equity                           90.0                                                         2008PF        2009P          2010P
  Total Deal Goodwill                               $47.1     EBITDA / Interest Exp.                                 6.6x         8.0x           9.0x
                                                              EBITDA - CapEx / Interest Exp.                         2.6x         4.4x           5.4x
% of Goodwill Allocated to Intangibles               20.0%    Total Debt / EBITDA                                    2.0x         1.7x           1.1x
 Amount Allocated to Intangibles                      $9.4    EBITDAR / Adj. Interest Exp.                           3.6x         3.7x           3.9x
Amortization Period                                 7 years   EBITDAR - CapEx / Adj. Interest Exp.                   2.9x         3.2x           3.3x
 Annual Amortization of Intangibles                   $1.3    Adj. Total Debt / EBITDAR                              6.0x         6.0x           5.7x
Amount Allocated to Goodwill                         $37.7
                                                              Cumulative Senior                2009P    2010P       2011P       2012P          2013P
                                                              Debt Paydown                     20.0%    40.0%       62.4%       93.2%         100.0%
Project Name
Returns Analysis
($ in millions, except per share data)


2011 Exit Analysis                                                               Sensitivity Analysis - 2011 Exit
Years to Exit                                3.0                                 Price                 LTM EBITDA Exit Multiple            Premium
Exit EBITDA Multiple                        5.0x      6.0x      7.0x      8.0x           8.7%           5.0x       6.0x             7.0x
Exit LTM EBITDA                            20.6      20.6      20.6      20.6    $8.00                 8.7%       8.7%             8.7%     294.1%
 Implied Enterprise Value                $103.0    $123.6    $144.2    $164.7    $9.00                 8.7%       8.7%             8.7%     343.3%
                                                                                 $10.00                8.7%       8.7%             8.7%     392.6%
Less: Debt Outstanding                     13.1      13.1      13.1      13.1    $11.00                8.7%       8.7%             8.7%     441.9%
Plus: Cash & Equivalents                    5.0       5.0       5.0       5.0    $12.00                8.7%       8.7%             8.7%     491.1%
  Implied Equity Value                    $94.9    $115.5    $136.1    $156.7

Implied IRR                                8.7%     16.1%     22.6%     28.5%
Implied Return Multiple                     1.3x      1.5x      1.8x      2.1x

2012 Exit Analysis                                                               Sensitivity Analysis - 2012 Exit
Years to Exit                                4.0                                 Price                 LTM EBITDA Exit Multiple            Premium
Exit EBITDA Multiple                        5.0x      6.0x      7.0x      8.0x          12.5%           5.0x        6.0x            7.0x
Exit LTM EBITDA                            23.1      23.1      23.1      23.1    $8.00               12.5%        12.5%           12.5%     294.1%
 Implied Enterprise Value                $115.7    $138.9    $162.0    $185.2    $9.00               12.5%        12.5%           12.5%     343.3%
                                                                                 $10.00              12.5%        12.5%           12.5%     392.6%
Less: Debt Outstanding                      2.3       2.3       2.3       2.3    $11.00              12.5%        12.5%           12.5%     441.9%
Plus: Cash & Equivalents                    5.0       5.0       5.0       5.0    $12.00              12.5%        12.5%           12.5%     491.1%
  Implied Equity Value                   $118.4    $141.5    $164.7    $187.8

Implied IRR                               12.5%     17.7%     22.2%     26.3%
Implied Return Multiple                     1.6x      1.9x      2.2x      2.5x

2013 Exit Analysis                                                               Sensitivity Analysis - 2013 Exit
Years to Exit                                5.0                                 Price                 LTM EBITDA Exit Multiple            Premium
Exit EBITDA Multiple                        5.0x      6.0x      7.0x      8.0x          14.5%           5.0x        6.0x            7.0x
Exit LTM EBITDA                            25.9      25.9      25.9      25.9    $8.00               14.5%        14.5%           14.5%     294.1%
 Implied Enterprise Value                $129.6    $155.5    $181.4    $207.3    $9.00               14.5%        14.5%           14.5%     343.3%
                                                                                 $10.00              14.5%        14.5%           14.5%     392.6%
Less: Debt Outstanding                      0.0       0.0       0.0       0.0    $11.00              14.5%        14.5%           14.5%     441.9%
Plus: Cash & Equivalents                   15.6      15.6      15.6      15.6    $12.00              14.5%        14.5%           14.5%     491.1%
  Implied Equity Value                   $145.2    $171.1    $197.0    $222.9

Implied IRR                               14.5%     18.3%     21.7%     24.7%
Implied Return Multiple                     1.9x      2.3x      2.6x      3.0x
Project Name
Summary Financials and Credit Analysis
($ in millions, except per share data)
                                                                 FY December 31,
                                         2008PF      2009P      2010P     2011P       2012P      2013P

Unadjusted Operating Statistics
Revenue                                    $274.0     $271.5     $276.9     $290.8     $305.3     $320.6
EBITDA                                       17.4       16.5       18.2       20.6       23.1       25.9
EBIT                                          5.4        3.2        4.5        6.1        7.7        9.5
Capital Expenditures                         10.5        7.4        7.3        8.9        9.1        9.3
Interest Expense                              2.6        2.1        2.0        1.4        0.6        0.1
Total Debt                                   34.8       27.8       20.9       13.1        2.3        0.0
Total Capitalization                        109.3      102.7       97.3       92.5       86.2       89.8

Unadjusted Credit Statistics
EBITDA / Interest Expense                     6.6x       8.0x       9.0x      14.6x      36.2x     265.7x
EBITDA - CapEx / Interest Expense             2.6x       4.4x       5.4x       0.5x       3.3x       N.A.
Total Debt / EBITDA                           2.0x       1.7x       1.1x       0.6x       0.1x       0.0x
Total Debt / Total Capitalization           31.8%      27.1%      21.4%      14.1%       2.7%       0.0%
Cumulative Senior Debt Paydown                         20.0%      40.0%      62.4%      93.2%     100.0%

Adjusted Operating Statistics
EBITDAR                                     $53.3      $52.1      $54.5      $58.7      $63.2      $67.9
Adjusted Interest Expense                    14.6       13.9       14.1       14.1       14.0       14.1
Adjusted Total Debt                         322.1      312.5      311.2      317.9      322.5      336.1
Adjusted Total Capitalization               396.6      387.4      387.7      397.4      406.3      425.9

Adjusted Credit Statistics
EBITDAR / Adj. Interest Exp.                  3.6x       3.7x       3.9x       4.2x       4.5x       4.8x
EBITDAR - CapEx / Adj. Interest Exp.          2.9x       3.2x       3.3x       3.5x       3.9x       4.2x
Adj. Total Debt / EBITDAR                     6.0x       6.0x       5.7x       5.4x       5.1x       4.9x
Adj. Total Debt / Adj. Total Cap.           81.2%      80.7%      80.3%      80.0%      79.4%      78.9%

Adjustment Calculations
Rent Expense                                $35.9      $35.6      $36.3      $38.1      $40.0      $42.0
Rent Factor                                   8.0x       8.0x       8.0x       8.0x       8.0x       8.0x
 Adjustment to Total Debt                  $287.3     $284.7     $290.4     $304.9     $320.1     $336.1

Expense Attributable to Interest            33.3%      33.3%      33.3%      33.3%      33.3%      33.3%
 Adjustment to Interest Expense             $12.0      $11.9      $12.1      $12.7      $13.3      $14.0
Project Name
Operating Assumptions
($ in millions, except per share data)
                                            FY December 31,                             FY December 31,
                                           2006A     2007A       2008P      2009P      2010P     2011P       2012P      2013P
Income Statement
Revenue Growth                                 0.0%       3.2%     (0.1%)     (0.9%)      2.0%       5.0%       5.0%       5.0%
EBITDA Growth                               (12.2%)    (40.0%)    (14.7%)     (5.0%)     10.4%      13.0%      12.4%      11.9%
Net Income Growth                           (13.6%)    (53.7%)    (47.9%)    (90.0%)    324.5%      86.8%      51.7%      34.1%

COGS (% of Revenue)                          50.5%      53.7%      55.5%      56.0%      56.0%      56.0%      56.0%      56.0%
SG&A (% of Revenue)                          23.2%      25.7%      25.0%      24.8%      24.3%      23.8%      23.3%      22.8%
Rent Expense (% of Revenue)                  13.5%      13.1%      13.1%      13.1%      13.1%      13.1%      13.1%      13.1%
Interest Income (% of Cash)                               4.9%       1.6%      1.6%       1.6%       1.6%       1.6%       1.6%
Other Income (% of Revenue)                   0.0%      (0.1%)     (0.1%)      0.0%       0.0%       0.0%       0.0%       0.0%
Effective Tax Rate                           39.0%      34.6%      36.6%      37.5%      37.5%      37.5%      37.5%      37.5%

Gross Margin                                 49.5%      46.3%      44.5%      44.0%      44.0%      44.0%      44.0%      44.0%
EBITDA Margin                                12.8%       7.4%       6.3%       6.1%       6.6%       7.1%       7.6%       8.1%
Net Income Margin                             5.8%       2.6%       1.3%       0.1%       0.6%       1.0%       1.5%       1.9%

Balance Sheet
Accounts Receivable Days                                  6.4        6.4        6.6        6.6        6.6        6.6        6.6
Inventory Turnover                                        4.5x       5.5x       5.5x       5.5x       5.5x       5.5x       5.5x
Prepaid Expenses (% of Revenue)               2.7%       0.9%       2.0%       2.2%       2.2%       2.2%       2.2%       2.2%
Other Current Assets (% of Revenue)           0.0%       0.0%       0.0%       0.0%       0.0%       0.0%       0.0%       0.0%
Other Assets (% of Revenue)                   0.1%       0.1%       0.1%       0.1%       0.1%       0.1%       0.1%       0.1%

Accounts Payable Days                                    28.3       21.8       20.9       20.9       20.9       20.9       20.9
Accrued Expenses (% of Revenues)              0.6%       0.7%       1.0%       0.9%       0.9%       0.9%       0.9%       0.9%
Other Current Liabilities (% of Revenue)      4.3%       5.2%       3.8%       3.8%       3.8%       3.8%       3.8%       3.8%
Other Liabilities (% of Revenue)              6.7%       5.9%       6.0%       6.2%       6.2%       6.2%       6.2%       6.2%

Store Buildout
Beginning Number of Stores                     306        296        297        295        292        297        307        317
New Stores                                      17         10         14          5          5         10         10         10
Closed Stores                                   27          9         16          8          0          0          0          0
Stores Opened, net                             (10)         1         (2)        (3)         5         10         10         10
Ending Number of Stores                        296        297        295        292        297        307        317        327
Net Store Growth                             -3.3%       0.3%      -0.7%      -1.0%       1.7%       3.4%       3.3%       3.2%
New Store Capex                               $5.1       $3.0       $4.2       $1.5       $1.5       $3.0       $3.0       $3.0
Capex per New Store                           $0.3       $0.3       $0.3       $0.3       $0.3       $0.3       $0.3       $0.3

Maintenance Capex                             $7.2       $9.1       $6.3       $5.9       $5.8       $5.9       $6.1       $6.3
Maintenance Capex, per Existing Store        $0.02      $0.03      $0.02      $0.02      $0.02      $0.02      $0.02      $0.02

Total Capex                                  $12.3      $12.1      $10.5       $7.4       $7.3       $8.9       $9.1       $9.3
Project Name
Actual & Projected Income Statement
($ in millions, except per share data)

                                          FY December 31,                             FY December 31,
                                         2006A     2007A       2008P      2009P      2010P     2011P       2012P      2013P

Revenue                                   $265.9     $274.5     $274.0     $271.5     $276.9     $290.8     $305.3     $320.6
COGS                                       134.2      147.5      152.2      152.1      155.2      162.9      171.1      179.6
 Gross Profit                              131.7      127.0      121.9      119.4      121.8      127.9      134.3      141.0

SG&A                                        61.8       70.7       68.6       67.3       67.3       69.2       71.1       73.1
 EBITDAR                                   $69.9      $56.3      $53.3      $52.1      $54.5      $58.7      $63.2      $67.9

Rent Expense                                36.0       36.0       35.9       35.6       36.3       38.1       40.0       42.0
 EBITDA                                    $33.9      $20.4      $17.4      $16.5      $18.2      $20.6      $23.1      $25.9

Depreciation of Existing Assets             11.4       12.1       12.0       12.0       12.0       12.0       12.0       12.0
Depreciation of New CapEx                    0.0        0.0        0.0        0.0        0.4        1.2        2.1        3.0
Amortization of Intangibles                  0.0        0.0        0.0        1.3        1.3        1.3        1.3        1.3
 Total D&A                                  11.4       12.1       12.0       13.3       13.7       14.5       15.4       16.4
 EBIT                                      $22.6       $8.2       $5.4       $3.2       $4.5       $6.1       $7.7       $9.5

Other Income                                 0.0        0.2        0.3        0.0        0.0        0.0        0.0        0.0
Interest Income                             (2.5)      (2.8)      (0.7)      (0.1)      (0.1)      (0.1)      (0.1)      (0.2)
Unused Credit Line Fee                       0.0        0.0        0.0        0.0        0.0        0.0        0.0        0.0
Existing Debt Interest Expense               0.0        0.0        0.0        0.0        0.0        0.0        0.0        0.0
Line of Credit Interest Expense              0.0        0.0        0.0        0.0        0.0        0.0        0.0        0.0
Senior Debt - Term A Interest Expense        0.0        0.0        0.0        2.6        2.0        1.4        0.6        0.1
Senior Debt - Term B Interest Expense        0.0        0.0        0.0        0.0        0.0        0.0        0.0        0.0
Sub Debt Interest Expense                    0.0        0.0        0.0        0.0        0.0        0.0        0.0        0.0
  Total Other Expense                       (2.5)      (2.6)      (0.4)       2.6        2.0        1.4        0.6       (0.0)
  Pretax Income                             25.1       10.8        5.8        0.6        2.5        4.7        7.1        9.5

Income Taxes                                 9.8        3.7        2.1        0.2        0.9        1.8        2.7        3.6
  Net Income                               $15.3       $7.1       $3.7       $0.4       $1.6       $2.9       $4.4       $6.0
Project Name
Actual & Projected Balance Sheet
($ in millions, except per share data)

                                          FY December 31,               Current                                  FY December 31,
                                         2006A     2007A      2008P     Adjust.     2008PF     2009P     2010P        2011P      2012P     2013P
Assets
Cash & Equivalents                         $61.5      $50.1     $37.5     ($32.5)       $5.0      $3.0      $4.3         $5.0       $5.0     $15.6
Accounts Receivable                          4.8        4.8       4.8                    4.8       5.0       5.0          5.3        5.5       5.8
Inventory                                   34.8       30.5      25.0                   25.0      30.0      28.1         29.5       30.9      32.5
Prepaid Expenses                             7.2        2.5       5.6                    5.6       6.0       6.1          6.4        6.7       7.1
Other Current Assets                         0.0        0.0       0.0                    0.0       0.0       0.0          0.0        0.0       0.0
  Total Current Assets                     108.3       87.9      73.0      (32.5)       40.5      44.0      43.5         46.2       48.2      61.0

Net PP&E                                    50.5       49.3      46.4                   46.4      41.8      36.8         32.5       27.6      21.9
Existing Goodwill & Intangibles              0.1       11.5      11.4                   11.4      11.4      11.4         11.4       11.4      11.4
Acquisition Goodwill                         0.0        0.0       0.0       37.7        37.7      37.7      37.7         37.7       37.7      37.7
Acquisition Intangibles                      0.0        0.0       0.0        9.4         9.4       8.1       6.7          5.4        4.0       2.7
Other Assets                                 0.3        0.4       0.4                    0.4       0.4       0.4          0.4        0.4       0.5
 Total Assets                             $159.2     $149.1    $131.2      $14.6      $145.8    $143.4    $136.5       $133.6     $129.4    $135.2

Liabilities & Shareholders' Equity
Accounts Payable                           $11.7      $10.5      $7.0                   $7.0     $11.0      $8.9         $9.3       $9.8     $10.3
Accrued Expenses                             1.7        1.9       2.7                    2.7       2.5       2.6          2.7        2.8       3.0
Other Current Liabilities                   11.5       14.3      10.4                   10.4      10.4      10.6         11.1       11.7      12.2
  Total Current Liabilities                 24.9       26.7      20.0        0.0        20.0      23.9      22.0         23.1       24.3      25.5

Other Liabilities                           17.8       16.3      16.5                   16.5      16.8      17.2         18.0       18.9      19.9
Existing Debt                                0.0        5.9       4.7       (4.7)        0.0       0.0       0.0          0.0        0.0       0.0
New Line of Credit                           0.0        0.0       0.0        0.0         0.0       0.0       0.0          0.0        0.0       0.0
New Senior Debt - Term A                     0.0        0.0       0.0       34.8        34.8      27.8      20.9         13.1        2.3       0.0
New Senior Debt - Term B                     0.0        0.0       0.0        0.0         0.0       0.0       0.0          0.0        0.0       0.0
New Sub Debt                                 0.0        0.0       0.0        0.0         0.0       0.0       0.0          0.0        0.0       0.0
Accumulated PIK Interest                     0.0        0.0       0.0                    0.0       0.0       0.0          0.0        0.0       0.0
 Total Liabilities                          42.7       48.9      41.2       30.1        71.3      68.5      60.0         54.2       45.6      45.4

Existing Shareholders' Equity              116.5      100.3      90.0      (90.0)        0.0       0.0       0.0          0.0        0.0       0.0
New Common Stock                             0.0        0.0       0.0       74.5        74.5      74.5      74.5         74.5       74.5      74.5
New Retained Earnings                        0.0        0.0       0.0        0.0         0.0       0.4       1.9          4.9        9.3      15.3
 Total Shareholders' Equity                116.5      100.3      90.0      (15.4)       74.5      74.9      76.5         79.4       83.9      89.8
 Total Liabilities & Shlds. Equity        $159.2     $149.1    $131.2      $14.6      $145.8    $143.4    $136.5       $133.6     $129.4    $135.2
Project Name
Projected Cash Flow Statement
($ in millions, except per share data)
                                                      FY December 31,
                                         2009P    2010P      2011P      2012P     2013P

Net Income                                $0.4     $1.6       $2.9       $4.4      $6.0
Depreciation on Existing Assets           12.0     12.0       12.0       12.0      12.0
Depreciation on New CapEx                  0.0      0.4        1.2        2.1       3.0
Amortization of Intangibles                1.3      1.3        1.3        1.3       1.3
Change in Accounts Receivable             (0.2)    (0.0)      (0.3)      (0.3)     (0.3)
Change in Inventory                       (5.0)     2.0       (1.4)      (1.5)     (1.5)
Change in Prepaid Expenses                (0.4)    (0.1)      (0.3)      (0.3)     (0.3)
Change in Other Assets                    (0.0)    (0.0)      (0.0)      (0.0)     (0.0)
Change in Accounts Payable                 4.0     (2.1)       0.4        0.5       0.5
Change in Accrued Expenses                (0.2)     0.0        0.1        0.1       0.1
Change in Other Liabilities                0.4      0.5        1.4        1.5       1.5
 Cash Flow from Operations               $12.4    $15.6      $17.4      $19.9     $22.3

Capital Expenditures                     ($7.4)   ($7.3)      ($8.9)     ($9.1)   ($9.3)
 Cash Flow from Investing                ($7.4)   ($7.3)      ($8.9)     ($9.1)   ($9.3)

Repayments of Line of Credit              $0.0     $0.0        $0.0       $0.0     $0.0
Repayments of Senior Debt - Term A        (7.0)    (7.0)       (7.8)     (10.7)    (2.3)
Repayments of Senior Debt - Term B         0.0      0.0         0.0        0.0      0.0
Repayments of Sub Debt                     0.0      0.0         0.0        0.0      0.0
Additions to PIK Interest                  0.0      0.0         0.0        0.0      0.0
 Cash Flow from Financing                ($7.0)   ($7.0)      ($7.8)    ($10.7)   ($2.3)

Net Cash Flow                            ($2.0)    $1.3       $0.7       ($0.0)   $10.6
 Beginning Cash & Equivalents              5.0      3.0        4.3         5.0      5.0
Ending Cash & Equivalents                 $3.0     $4.3       $5.0        $5.0    $15.6
Project Name
Projected Debt Schedule
($ in millions, except per share data)
                                                      FY December 31,
                                         2009P    2010P      2011P      2012P    2013P    12 Month LIBOR              2.80%
Cash Flow Available to Repay Debt        $10.0    $11.2      $12.8      $15.7    $18.0
Minimum Cash Balance                       5.0      5.0        5.0        5.0      5.0
 Net Cash Available                       $5.0     $6.2       $7.8      $10.7    $13.0
                                                                                                     Terms
Line of Credit                                                                                       Availability     $17.5
Beginning Balance                         $0.0     $0.0       $0.0       $0.0     $0.0               Unused Fee       0.25%
Borrowings / (Repayment)                   0.0      0.0        0.0        0.0      0.0               Spread            2.8%
Ending Balance                             0.0      0.0        0.0        0.0      0.0               Total Rate        5.6%
Interest Expense                           0.0      0.0        0.0        0.0      0.0               Term            5 years
Unused Credit Line Fee                    $0.0     $0.0       $0.0       $0.0     $0.0               Type              Bullet

Senior Debt - Term A                                                                                 Terms
Beginning Balance                        $34.8    $27.8      $20.9      $13.1     $2.3               Spread            5.5%
Mandatory Amortization                   20.0%    20.0%      20.0%      20.0%    20.0%               Total Rate        8.3%
Mandatory Repayment                       (7.0)    (7.0)      (7.0)      (7.0)    (2.3)              Term            5 years
Additional Repayment                       0.0      0.0       (0.8)      (3.8)     0.0               Type           Amortize
Ending Balance                            27.8     20.9       13.1        2.3      0.0
Net Cash Available                        (2.0)    (0.7)       0.0        0.0     10.6
Interest Expense                          $2.6     $2.0       $1.4       $0.6     $0.1

Senior Debt - Term B                                                                                 Terms
Beginning Balance                         $0.0     $0.0       $0.0       $0.0     $0.0               Spread            6.5%
Mandatory Amortization                    0.0%     0.0%       0.0%       0.0%     0.0%               Total Rate        9.3%
Mandatory Repayment                        0.0      0.0        0.0        0.0      0.0               Term            8 years
Additional Repayment                       0.0      0.0        0.0        0.0      0.0               Type              Bullet
Ending Balance                             0.0      0.0        0.0        0.0      0.0
Net Cash Available                        (2.0)    (0.7)       0.0        0.0     10.6
Interest Expense                          $0.0     $0.0       $0.0       $0.0     $0.0

Sub Debt                                                                                             Terms
Beginning Balance                         $0.0     $0.0       $0.0       $0.0     $0.0               Spread            9.0%
Additional Repayment                       0.0      0.0        0.0        0.0      0.0               Total Rate       11.8%
Ending Balance                             0.0      0.0        0.0        0.0      0.0               PIK Interest      0.0%
Interest Expense                           0.0      0.0        0.0        0.0      0.0               Term           10 years
PIK Interest Expense                      $0.0     $0.0       $0.0       $0.0     $0.0               Type              Bullet

Total Cumulative Interest Expense         $2.6     $4.6       $6.0       $6.7      $6.8
Cumulative Senior Debt Paydown           20.0%    40.0%      62.4%      93.2%    100.0%

Flevy.com - LBO Model Template

  • 1.
    Project Name LBO TransactionSummary ($ in millions, except per share data) Transaction Assumptions Sources & Uses of Funds Transaction Date December 2008 Sources Amount Percent Rate Term Fees Months to End of Year 12 Existing Cash $32.5 22.9% Minimum Operating Cash $5.0 Line of Credit* 0.0 0.0% 5.6% 5 years 1.5% 12 Month LIBOR 2.80% Senior Debt - Term A 34.8 24.5% 8.3% 5 years 1.5% Senior Debt - Term B 0.0 0.0% 9.3% 8 years 1.5% Trading Information Sub Debt 0.0 0.0% 11.8% 10 years 2.0% Deal Current Rollover Debt 0.0 0.0% 0.0% 0 years 0.0% Share Price $10.00 $2.03 Equity 74.5 52.6% 1.0% Diluted Shares 13.3 13.2 Total Sources $141.8 100.0% Equity Market Value $132.9 $26.9 *Available Line of Credit Plus: Debt Outstanding 4.7 4.7 Uses $17.5 Less: Cash & Equivalents 37.5 37.5 Purchase of Equity $132.9 93.7% Enterprise Value $100.1 ($5.9) Debt Repayment 4.7 3.3% Working Capital 0.0 0.0% 2008P EBITDA Multiple 5.8x -0.3x Financing Fees 1.5 1.1% Transaction Expenses 2.7 1.9% 2.0% Debt Capacity Analysis Total Uses $141.8 100.0% 2008P EBITDA $17.4 Senior Debt / EBITDA Coverage 2.0x Equity IRR Calculation Senior Debt Capacity $34.8 Exit LTM EBITDA Multiple 2011 Exit 2012 Exit 2013 Exit Sub Debt / EBITDA Coverage 0.0x 5.0x 8.7% 12.5% 14.5% Sub Debt Capacity $0.0 6.0x 16.1% 17.7% 18.3% 7.0x 22.6% 22.2% 21.7% Goodwill Calculation 8.0x 28.5% 26.3% 24.7% Purchase Price of Equity $132.9 Plus: Transaction Costs 4.2 Credit Statistics Less: Book Value of Equity 90.0 2008PF 2009P 2010P Total Deal Goodwill $47.1 EBITDA / Interest Exp. 6.6x 8.0x 9.0x EBITDA - CapEx / Interest Exp. 2.6x 4.4x 5.4x % of Goodwill Allocated to Intangibles 20.0% Total Debt / EBITDA 2.0x 1.7x 1.1x Amount Allocated to Intangibles $9.4 EBITDAR / Adj. Interest Exp. 3.6x 3.7x 3.9x Amortization Period 7 years EBITDAR - CapEx / Adj. Interest Exp. 2.9x 3.2x 3.3x Annual Amortization of Intangibles $1.3 Adj. Total Debt / EBITDAR 6.0x 6.0x 5.7x Amount Allocated to Goodwill $37.7 Cumulative Senior 2009P 2010P 2011P 2012P 2013P Debt Paydown 20.0% 40.0% 62.4% 93.2% 100.0%
  • 2.
    Project Name Returns Analysis ($in millions, except per share data) 2011 Exit Analysis Sensitivity Analysis - 2011 Exit Years to Exit 3.0 Price LTM EBITDA Exit Multiple Premium Exit EBITDA Multiple 5.0x 6.0x 7.0x 8.0x 8.7% 5.0x 6.0x 7.0x Exit LTM EBITDA 20.6 20.6 20.6 20.6 $8.00 8.7% 8.7% 8.7% 294.1% Implied Enterprise Value $103.0 $123.6 $144.2 $164.7 $9.00 8.7% 8.7% 8.7% 343.3% $10.00 8.7% 8.7% 8.7% 392.6% Less: Debt Outstanding 13.1 13.1 13.1 13.1 $11.00 8.7% 8.7% 8.7% 441.9% Plus: Cash & Equivalents 5.0 5.0 5.0 5.0 $12.00 8.7% 8.7% 8.7% 491.1% Implied Equity Value $94.9 $115.5 $136.1 $156.7 Implied IRR 8.7% 16.1% 22.6% 28.5% Implied Return Multiple 1.3x 1.5x 1.8x 2.1x 2012 Exit Analysis Sensitivity Analysis - 2012 Exit Years to Exit 4.0 Price LTM EBITDA Exit Multiple Premium Exit EBITDA Multiple 5.0x 6.0x 7.0x 8.0x 12.5% 5.0x 6.0x 7.0x Exit LTM EBITDA 23.1 23.1 23.1 23.1 $8.00 12.5% 12.5% 12.5% 294.1% Implied Enterprise Value $115.7 $138.9 $162.0 $185.2 $9.00 12.5% 12.5% 12.5% 343.3% $10.00 12.5% 12.5% 12.5% 392.6% Less: Debt Outstanding 2.3 2.3 2.3 2.3 $11.00 12.5% 12.5% 12.5% 441.9% Plus: Cash & Equivalents 5.0 5.0 5.0 5.0 $12.00 12.5% 12.5% 12.5% 491.1% Implied Equity Value $118.4 $141.5 $164.7 $187.8 Implied IRR 12.5% 17.7% 22.2% 26.3% Implied Return Multiple 1.6x 1.9x 2.2x 2.5x 2013 Exit Analysis Sensitivity Analysis - 2013 Exit Years to Exit 5.0 Price LTM EBITDA Exit Multiple Premium Exit EBITDA Multiple 5.0x 6.0x 7.0x 8.0x 14.5% 5.0x 6.0x 7.0x Exit LTM EBITDA 25.9 25.9 25.9 25.9 $8.00 14.5% 14.5% 14.5% 294.1% Implied Enterprise Value $129.6 $155.5 $181.4 $207.3 $9.00 14.5% 14.5% 14.5% 343.3% $10.00 14.5% 14.5% 14.5% 392.6% Less: Debt Outstanding 0.0 0.0 0.0 0.0 $11.00 14.5% 14.5% 14.5% 441.9% Plus: Cash & Equivalents 15.6 15.6 15.6 15.6 $12.00 14.5% 14.5% 14.5% 491.1% Implied Equity Value $145.2 $171.1 $197.0 $222.9 Implied IRR 14.5% 18.3% 21.7% 24.7% Implied Return Multiple 1.9x 2.3x 2.6x 3.0x
  • 3.
    Project Name Summary Financialsand Credit Analysis ($ in millions, except per share data) FY December 31, 2008PF 2009P 2010P 2011P 2012P 2013P Unadjusted Operating Statistics Revenue $274.0 $271.5 $276.9 $290.8 $305.3 $320.6 EBITDA 17.4 16.5 18.2 20.6 23.1 25.9 EBIT 5.4 3.2 4.5 6.1 7.7 9.5 Capital Expenditures 10.5 7.4 7.3 8.9 9.1 9.3 Interest Expense 2.6 2.1 2.0 1.4 0.6 0.1 Total Debt 34.8 27.8 20.9 13.1 2.3 0.0 Total Capitalization 109.3 102.7 97.3 92.5 86.2 89.8 Unadjusted Credit Statistics EBITDA / Interest Expense 6.6x 8.0x 9.0x 14.6x 36.2x 265.7x EBITDA - CapEx / Interest Expense 2.6x 4.4x 5.4x 0.5x 3.3x N.A. Total Debt / EBITDA 2.0x 1.7x 1.1x 0.6x 0.1x 0.0x Total Debt / Total Capitalization 31.8% 27.1% 21.4% 14.1% 2.7% 0.0% Cumulative Senior Debt Paydown 20.0% 40.0% 62.4% 93.2% 100.0% Adjusted Operating Statistics EBITDAR $53.3 $52.1 $54.5 $58.7 $63.2 $67.9 Adjusted Interest Expense 14.6 13.9 14.1 14.1 14.0 14.1 Adjusted Total Debt 322.1 312.5 311.2 317.9 322.5 336.1 Adjusted Total Capitalization 396.6 387.4 387.7 397.4 406.3 425.9 Adjusted Credit Statistics EBITDAR / Adj. Interest Exp. 3.6x 3.7x 3.9x 4.2x 4.5x 4.8x EBITDAR - CapEx / Adj. Interest Exp. 2.9x 3.2x 3.3x 3.5x 3.9x 4.2x Adj. Total Debt / EBITDAR 6.0x 6.0x 5.7x 5.4x 5.1x 4.9x Adj. Total Debt / Adj. Total Cap. 81.2% 80.7% 80.3% 80.0% 79.4% 78.9% Adjustment Calculations Rent Expense $35.9 $35.6 $36.3 $38.1 $40.0 $42.0 Rent Factor 8.0x 8.0x 8.0x 8.0x 8.0x 8.0x Adjustment to Total Debt $287.3 $284.7 $290.4 $304.9 $320.1 $336.1 Expense Attributable to Interest 33.3% 33.3% 33.3% 33.3% 33.3% 33.3% Adjustment to Interest Expense $12.0 $11.9 $12.1 $12.7 $13.3 $14.0
  • 4.
    Project Name Operating Assumptions ($in millions, except per share data) FY December 31, FY December 31, 2006A 2007A 2008P 2009P 2010P 2011P 2012P 2013P Income Statement Revenue Growth 0.0% 3.2% (0.1%) (0.9%) 2.0% 5.0% 5.0% 5.0% EBITDA Growth (12.2%) (40.0%) (14.7%) (5.0%) 10.4% 13.0% 12.4% 11.9% Net Income Growth (13.6%) (53.7%) (47.9%) (90.0%) 324.5% 86.8% 51.7% 34.1% COGS (% of Revenue) 50.5% 53.7% 55.5% 56.0% 56.0% 56.0% 56.0% 56.0% SG&A (% of Revenue) 23.2% 25.7% 25.0% 24.8% 24.3% 23.8% 23.3% 22.8% Rent Expense (% of Revenue) 13.5% 13.1% 13.1% 13.1% 13.1% 13.1% 13.1% 13.1% Interest Income (% of Cash) 4.9% 1.6% 1.6% 1.6% 1.6% 1.6% 1.6% Other Income (% of Revenue) 0.0% (0.1%) (0.1%) 0.0% 0.0% 0.0% 0.0% 0.0% Effective Tax Rate 39.0% 34.6% 36.6% 37.5% 37.5% 37.5% 37.5% 37.5% Gross Margin 49.5% 46.3% 44.5% 44.0% 44.0% 44.0% 44.0% 44.0% EBITDA Margin 12.8% 7.4% 6.3% 6.1% 6.6% 7.1% 7.6% 8.1% Net Income Margin 5.8% 2.6% 1.3% 0.1% 0.6% 1.0% 1.5% 1.9% Balance Sheet Accounts Receivable Days 6.4 6.4 6.6 6.6 6.6 6.6 6.6 Inventory Turnover 4.5x 5.5x 5.5x 5.5x 5.5x 5.5x 5.5x Prepaid Expenses (% of Revenue) 2.7% 0.9% 2.0% 2.2% 2.2% 2.2% 2.2% 2.2% Other Current Assets (% of Revenue) 0.0% 0.0% 0.0% 0.0% 0.0% 0.0% 0.0% 0.0% Other Assets (% of Revenue) 0.1% 0.1% 0.1% 0.1% 0.1% 0.1% 0.1% 0.1% Accounts Payable Days 28.3 21.8 20.9 20.9 20.9 20.9 20.9 Accrued Expenses (% of Revenues) 0.6% 0.7% 1.0% 0.9% 0.9% 0.9% 0.9% 0.9% Other Current Liabilities (% of Revenue) 4.3% 5.2% 3.8% 3.8% 3.8% 3.8% 3.8% 3.8% Other Liabilities (% of Revenue) 6.7% 5.9% 6.0% 6.2% 6.2% 6.2% 6.2% 6.2% Store Buildout Beginning Number of Stores 306 296 297 295 292 297 307 317 New Stores 17 10 14 5 5 10 10 10 Closed Stores 27 9 16 8 0 0 0 0 Stores Opened, net (10) 1 (2) (3) 5 10 10 10 Ending Number of Stores 296 297 295 292 297 307 317 327 Net Store Growth -3.3% 0.3% -0.7% -1.0% 1.7% 3.4% 3.3% 3.2% New Store Capex $5.1 $3.0 $4.2 $1.5 $1.5 $3.0 $3.0 $3.0 Capex per New Store $0.3 $0.3 $0.3 $0.3 $0.3 $0.3 $0.3 $0.3 Maintenance Capex $7.2 $9.1 $6.3 $5.9 $5.8 $5.9 $6.1 $6.3 Maintenance Capex, per Existing Store $0.02 $0.03 $0.02 $0.02 $0.02 $0.02 $0.02 $0.02 Total Capex $12.3 $12.1 $10.5 $7.4 $7.3 $8.9 $9.1 $9.3
  • 5.
    Project Name Actual &Projected Income Statement ($ in millions, except per share data) FY December 31, FY December 31, 2006A 2007A 2008P 2009P 2010P 2011P 2012P 2013P Revenue $265.9 $274.5 $274.0 $271.5 $276.9 $290.8 $305.3 $320.6 COGS 134.2 147.5 152.2 152.1 155.2 162.9 171.1 179.6 Gross Profit 131.7 127.0 121.9 119.4 121.8 127.9 134.3 141.0 SG&A 61.8 70.7 68.6 67.3 67.3 69.2 71.1 73.1 EBITDAR $69.9 $56.3 $53.3 $52.1 $54.5 $58.7 $63.2 $67.9 Rent Expense 36.0 36.0 35.9 35.6 36.3 38.1 40.0 42.0 EBITDA $33.9 $20.4 $17.4 $16.5 $18.2 $20.6 $23.1 $25.9 Depreciation of Existing Assets 11.4 12.1 12.0 12.0 12.0 12.0 12.0 12.0 Depreciation of New CapEx 0.0 0.0 0.0 0.0 0.4 1.2 2.1 3.0 Amortization of Intangibles 0.0 0.0 0.0 1.3 1.3 1.3 1.3 1.3 Total D&A 11.4 12.1 12.0 13.3 13.7 14.5 15.4 16.4 EBIT $22.6 $8.2 $5.4 $3.2 $4.5 $6.1 $7.7 $9.5 Other Income 0.0 0.2 0.3 0.0 0.0 0.0 0.0 0.0 Interest Income (2.5) (2.8) (0.7) (0.1) (0.1) (0.1) (0.1) (0.2) Unused Credit Line Fee 0.0 0.0 0.0 0.0 0.0 0.0 0.0 0.0 Existing Debt Interest Expense 0.0 0.0 0.0 0.0 0.0 0.0 0.0 0.0 Line of Credit Interest Expense 0.0 0.0 0.0 0.0 0.0 0.0 0.0 0.0 Senior Debt - Term A Interest Expense 0.0 0.0 0.0 2.6 2.0 1.4 0.6 0.1 Senior Debt - Term B Interest Expense 0.0 0.0 0.0 0.0 0.0 0.0 0.0 0.0 Sub Debt Interest Expense 0.0 0.0 0.0 0.0 0.0 0.0 0.0 0.0 Total Other Expense (2.5) (2.6) (0.4) 2.6 2.0 1.4 0.6 (0.0) Pretax Income 25.1 10.8 5.8 0.6 2.5 4.7 7.1 9.5 Income Taxes 9.8 3.7 2.1 0.2 0.9 1.8 2.7 3.6 Net Income $15.3 $7.1 $3.7 $0.4 $1.6 $2.9 $4.4 $6.0
  • 6.
    Project Name Actual &Projected Balance Sheet ($ in millions, except per share data) FY December 31, Current FY December 31, 2006A 2007A 2008P Adjust. 2008PF 2009P 2010P 2011P 2012P 2013P Assets Cash & Equivalents $61.5 $50.1 $37.5 ($32.5) $5.0 $3.0 $4.3 $5.0 $5.0 $15.6 Accounts Receivable 4.8 4.8 4.8 4.8 5.0 5.0 5.3 5.5 5.8 Inventory 34.8 30.5 25.0 25.0 30.0 28.1 29.5 30.9 32.5 Prepaid Expenses 7.2 2.5 5.6 5.6 6.0 6.1 6.4 6.7 7.1 Other Current Assets 0.0 0.0 0.0 0.0 0.0 0.0 0.0 0.0 0.0 Total Current Assets 108.3 87.9 73.0 (32.5) 40.5 44.0 43.5 46.2 48.2 61.0 Net PP&E 50.5 49.3 46.4 46.4 41.8 36.8 32.5 27.6 21.9 Existing Goodwill & Intangibles 0.1 11.5 11.4 11.4 11.4 11.4 11.4 11.4 11.4 Acquisition Goodwill 0.0 0.0 0.0 37.7 37.7 37.7 37.7 37.7 37.7 37.7 Acquisition Intangibles 0.0 0.0 0.0 9.4 9.4 8.1 6.7 5.4 4.0 2.7 Other Assets 0.3 0.4 0.4 0.4 0.4 0.4 0.4 0.4 0.5 Total Assets $159.2 $149.1 $131.2 $14.6 $145.8 $143.4 $136.5 $133.6 $129.4 $135.2 Liabilities & Shareholders' Equity Accounts Payable $11.7 $10.5 $7.0 $7.0 $11.0 $8.9 $9.3 $9.8 $10.3 Accrued Expenses 1.7 1.9 2.7 2.7 2.5 2.6 2.7 2.8 3.0 Other Current Liabilities 11.5 14.3 10.4 10.4 10.4 10.6 11.1 11.7 12.2 Total Current Liabilities 24.9 26.7 20.0 0.0 20.0 23.9 22.0 23.1 24.3 25.5 Other Liabilities 17.8 16.3 16.5 16.5 16.8 17.2 18.0 18.9 19.9 Existing Debt 0.0 5.9 4.7 (4.7) 0.0 0.0 0.0 0.0 0.0 0.0 New Line of Credit 0.0 0.0 0.0 0.0 0.0 0.0 0.0 0.0 0.0 0.0 New Senior Debt - Term A 0.0 0.0 0.0 34.8 34.8 27.8 20.9 13.1 2.3 0.0 New Senior Debt - Term B 0.0 0.0 0.0 0.0 0.0 0.0 0.0 0.0 0.0 0.0 New Sub Debt 0.0 0.0 0.0 0.0 0.0 0.0 0.0 0.0 0.0 0.0 Accumulated PIK Interest 0.0 0.0 0.0 0.0 0.0 0.0 0.0 0.0 0.0 Total Liabilities 42.7 48.9 41.2 30.1 71.3 68.5 60.0 54.2 45.6 45.4 Existing Shareholders' Equity 116.5 100.3 90.0 (90.0) 0.0 0.0 0.0 0.0 0.0 0.0 New Common Stock 0.0 0.0 0.0 74.5 74.5 74.5 74.5 74.5 74.5 74.5 New Retained Earnings 0.0 0.0 0.0 0.0 0.0 0.4 1.9 4.9 9.3 15.3 Total Shareholders' Equity 116.5 100.3 90.0 (15.4) 74.5 74.9 76.5 79.4 83.9 89.8 Total Liabilities & Shlds. Equity $159.2 $149.1 $131.2 $14.6 $145.8 $143.4 $136.5 $133.6 $129.4 $135.2
  • 7.
    Project Name Projected CashFlow Statement ($ in millions, except per share data) FY December 31, 2009P 2010P 2011P 2012P 2013P Net Income $0.4 $1.6 $2.9 $4.4 $6.0 Depreciation on Existing Assets 12.0 12.0 12.0 12.0 12.0 Depreciation on New CapEx 0.0 0.4 1.2 2.1 3.0 Amortization of Intangibles 1.3 1.3 1.3 1.3 1.3 Change in Accounts Receivable (0.2) (0.0) (0.3) (0.3) (0.3) Change in Inventory (5.0) 2.0 (1.4) (1.5) (1.5) Change in Prepaid Expenses (0.4) (0.1) (0.3) (0.3) (0.3) Change in Other Assets (0.0) (0.0) (0.0) (0.0) (0.0) Change in Accounts Payable 4.0 (2.1) 0.4 0.5 0.5 Change in Accrued Expenses (0.2) 0.0 0.1 0.1 0.1 Change in Other Liabilities 0.4 0.5 1.4 1.5 1.5 Cash Flow from Operations $12.4 $15.6 $17.4 $19.9 $22.3 Capital Expenditures ($7.4) ($7.3) ($8.9) ($9.1) ($9.3) Cash Flow from Investing ($7.4) ($7.3) ($8.9) ($9.1) ($9.3) Repayments of Line of Credit $0.0 $0.0 $0.0 $0.0 $0.0 Repayments of Senior Debt - Term A (7.0) (7.0) (7.8) (10.7) (2.3) Repayments of Senior Debt - Term B 0.0 0.0 0.0 0.0 0.0 Repayments of Sub Debt 0.0 0.0 0.0 0.0 0.0 Additions to PIK Interest 0.0 0.0 0.0 0.0 0.0 Cash Flow from Financing ($7.0) ($7.0) ($7.8) ($10.7) ($2.3) Net Cash Flow ($2.0) $1.3 $0.7 ($0.0) $10.6 Beginning Cash & Equivalents 5.0 3.0 4.3 5.0 5.0 Ending Cash & Equivalents $3.0 $4.3 $5.0 $5.0 $15.6
  • 8.
    Project Name Projected DebtSchedule ($ in millions, except per share data) FY December 31, 2009P 2010P 2011P 2012P 2013P 12 Month LIBOR 2.80% Cash Flow Available to Repay Debt $10.0 $11.2 $12.8 $15.7 $18.0 Minimum Cash Balance 5.0 5.0 5.0 5.0 5.0 Net Cash Available $5.0 $6.2 $7.8 $10.7 $13.0 Terms Line of Credit Availability $17.5 Beginning Balance $0.0 $0.0 $0.0 $0.0 $0.0 Unused Fee 0.25% Borrowings / (Repayment) 0.0 0.0 0.0 0.0 0.0 Spread 2.8% Ending Balance 0.0 0.0 0.0 0.0 0.0 Total Rate 5.6% Interest Expense 0.0 0.0 0.0 0.0 0.0 Term 5 years Unused Credit Line Fee $0.0 $0.0 $0.0 $0.0 $0.0 Type Bullet Senior Debt - Term A Terms Beginning Balance $34.8 $27.8 $20.9 $13.1 $2.3 Spread 5.5% Mandatory Amortization 20.0% 20.0% 20.0% 20.0% 20.0% Total Rate 8.3% Mandatory Repayment (7.0) (7.0) (7.0) (7.0) (2.3) Term 5 years Additional Repayment 0.0 0.0 (0.8) (3.8) 0.0 Type Amortize Ending Balance 27.8 20.9 13.1 2.3 0.0 Net Cash Available (2.0) (0.7) 0.0 0.0 10.6 Interest Expense $2.6 $2.0 $1.4 $0.6 $0.1 Senior Debt - Term B Terms Beginning Balance $0.0 $0.0 $0.0 $0.0 $0.0 Spread 6.5% Mandatory Amortization 0.0% 0.0% 0.0% 0.0% 0.0% Total Rate 9.3% Mandatory Repayment 0.0 0.0 0.0 0.0 0.0 Term 8 years Additional Repayment 0.0 0.0 0.0 0.0 0.0 Type Bullet Ending Balance 0.0 0.0 0.0 0.0 0.0 Net Cash Available (2.0) (0.7) 0.0 0.0 10.6 Interest Expense $0.0 $0.0 $0.0 $0.0 $0.0 Sub Debt Terms Beginning Balance $0.0 $0.0 $0.0 $0.0 $0.0 Spread 9.0% Additional Repayment 0.0 0.0 0.0 0.0 0.0 Total Rate 11.8% Ending Balance 0.0 0.0 0.0 0.0 0.0 PIK Interest 0.0% Interest Expense 0.0 0.0 0.0 0.0 0.0 Term 10 years PIK Interest Expense $0.0 $0.0 $0.0 $0.0 $0.0 Type Bullet Total Cumulative Interest Expense $2.6 $4.6 $6.0 $6.7 $6.8 Cumulative Senior Debt Paydown 20.0% 40.0% 62.4% 93.2% 100.0%