Mulki Call Girls 7001305949 WhatsApp Number 24x7 Best Services
AMBUJA CEMENTS 3Q RESULT
1. Please refer to important disclosures at the end of this report 1
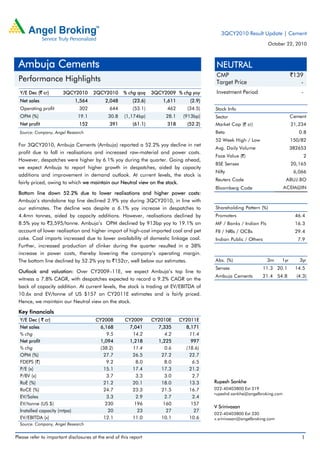
Y/E Dec (` cr) 3QCY2010 2QCY2010 % chg qoq 3QCY2009 % chg yoy
Net sales 1,564 2,048 (23.6) 1,611 (2.9)
Operating profit 302 644 (53.1) 462 (34.5)
OPM (%) 19.1 30.8 (1,174bp) 28.1 (913bp)
Net profit 152 391 (61.1) 318 (52.2)
Source: Company, Angel Research
For 3QCY2010, Ambuja Cements (Ambuja) reported a 52.2% yoy decline in net
profit due to fall in realisations and increased raw-material and power costs.
However, despatches were higher by 6.1% yoy during the quarter. Going ahead,
we expect Ambuja to report higher growth in despatches, aided by capacity
additions and improvement in demand outlook. At current levels, the stock is
fairly priced, owing to which we maintain our Neutral view on the stock.
Bottom line down 52.2% due to lower realisations and higher power costs:
Ambuja’s standalone top line declined 2.9% yoy during 3QCY2010, in line with
our estimates. The decline was despite a 6.1% yoy increase in despatches to
4.4mn tonnes, aided by capacity additions. However, realisations declined by
8.5% yoy to `3,595/tonne. Ambuja’s OPM declined by 913bp yoy to 19.1% on
account of lower realisation and higher import of high-cost imported coal and pet
coke. Coal imports increased due to lower availability of domestic linkage coal.
Further, increased production of clinker during the quarter resulted in a 38%
increase in power costs, thereby lowering the company’s operating margin.
The bottom line declined by 52.2% yoy to `152cr, well below our estimates.
Outlook and valuation: Over CY2009–11E, we expect Ambuja’s top line to
witness a 7.8% CAGR, with despatches expected to record a 9.2% CAGR on the
back of capacity addition. At current levels, the stock is trading at EV/EBITDA of
10.6x and EV/tonne of US $157 on CY2011E estimates and is fairly priced.
Hence, we maintain our Neutral view on the stock.
Key financials
Y/E Dec ( ` cr) CY2008 CY2009 CY2010E CY2011E
Net sales 6,168 7,041 7,335 8,171
% chg 9.5 14.2 4.2 11.4
Net profit 1,094 1,218 1,225 997
% chg (38.2) 11.4 0.6 (18.6)
OPM (%) 27.7 26.5 27.2 22.7
FDEPS (`) 9.2 8.0 8.0 6.5
P/E (x) 15.1 17.4 17.3 21.2
P/BV (x) 3.7 3.3 3.0 2.7
RoE (%) 21.2 20.1 18.0 13.3
RoCE (%) 24.7 23.3 21.5 16.7
EV/Sales 3.3 2.9 2.7 2.4
EV/tonne (US $) 230 196 160 157
Installed capacity (mtpa) 20 23 27 27
EV/EBITDA (x) 12.1 11.0 10.1 10.6
Source: Company, Angel Research
NEUTRAL
CMP `139
Target Price -
Investment Period -
Stock Info
Sector
Bloomberg Code
Shareholding Pattern (%)
Promoters 46.4
MF / Banks / Indian Fls 16.3
FII / NRIs / OCBs 29.4
Indian Public / Others 7.9
Abs. (%) 3m 1yr 3yr
Sensex 11.3 20.1 14.5
Ambuja Cements 21.4 54.8 (4.3)
21,234
0.8
150/82
382653
Cement
Avg. Daily Volume
Market Cap (` cr)
Beta
52 Week High / Low
2
20,165
6,066
ABUJ.BO
ACEM@IN
Face Value (`)
BSE Sensex
Nifty
Reuters Code
Rupesh Sankhe
022-40403800 Ext 319
rupeshd.sankhe@angelbroking.com
V Srinivasan
022-40403800 Ext 330
v.srinivasan@angelbroking.com
Ambuja Cements
Performance Highlights
3QCY2010 Result Update | Cement
October 22, 2010
3. Ambuja Cements | 3QCY2010 Result Update
October 22, 2010 3
Exhibit 3: 3QCY2010 – Actual v/s Angel estimates
(` cr) Actual Estimates Variation (%)
Net sales 1,564 1,585 (1.3)
Operating profit 302.2 411.3 (26.5)
Net profit 152.1 262.8 (42.1)
Source: Company, Angel Research
Operational highlights
For 3QCY2010, Ambuja’s realisation/tonne declined by 8.5% on a yoy basis to
`3,595. However, on a positive note, raw-material cost/tonne was down to `140
(`491 in 3QCY2009) due to the avoidance of external clinker purchase during the
quarter as against `157cr of purchase in 3QCY2009. Power and fuel costs/tonne
were higher by 29.7% yoy due to higher clinker production. However, freight
costs/tonne rose by 6.6% yoy due increased diesel costs and higher internal
material transfer. Depreciation cost also moved up by 33.4% yoy, following an
increase in capacity. Operating profit/tonne stood at `651, down 37.9% yoy.
Net profit/tonne for the quarter stood at `306, down 56.3% yoy.
Exhibit 4: Per tonne analysis
(`) 3QCY10 2QCY10 3QCY09 % chg (yoy) % chg (qoq)
Realisation/tonne 3,595 3,834 3,929 (8.5) (6.2)
Power and fuel cost/tonne 1,017 849 785 29.7 19.8
Freight and forwarding
cost/tonne
787 838 739 6.6 (6.0)
Operating profit/tonne 651 1,130 1,049 (37.9) (42.4)
Depreciation/tonne 234 187 175 33.4 24.9
Net profit/tonne 306 656 700 (56.3) (53.4)
Source: Company, Angel Research
4. Ambuja Cements | 3QCY2010 Result Update
October 22, 2010 4
Investment arguments
Capacity addition to maintain robust volume growth
During 1QCY2010, Ambuja expanded its clinker capacity by 4.4mn tonnes per
annum (mtpa) by setting up clinker plants with capacity of 2.2mtpa each at
Bhatapara and Rauri. The company had also commissioned grinding units at
Nalagarh and Dadri (with capacities of 1.5mn tonnes each) in 1QCY2010.
Further, the company will be adding 2mtpa of total grinding capacity at Bhatapara
and Maratha. Ambuja is expected to have overall capacity of 27mn tonnes by the
end of CY2010 post its proposed capacity additions. Going ahead, we expect
capacity additions done by the company to drive growth.
Exhibit 5: Installed capacity
Source: Company, Angel Research
Presence in high-growth regions to ensure better realisations
Ambuja currently derives close to 80% of its revenue from the western and
northern regions, with both the regions having almost equal shares. The remaining
20% is derived from the eastern region. Thus, we expect Ambuja to enjoy better
profitability as compared to players with significant exposure to the south due to
the presence in the high-growth northern and eastern regions.
Setting up of new capacities to improve margins substantially from CY2010
During CY2009, Ambuja’s OPM was affected by 400bp due to external purchase
of close to 1.7mn tonnes of high-cost clinker. However, going ahead, we expect
Ambuja to enjoy significant margin expansion due to the commissioning of
4.4mtpa of clinker capacities in 1QCY2010. Production at the company’s clinker
plants has stabilised, resulting in the elimination of external clinker purchase in
3QCY2010. Ambuja is also expected to record savings in energy cost, with the
commissioning of new captive power capacities. The company, which
commissioned a 33MW captive power at Bhatapara (33MW), has set up another
30MW power plant at Ambuja Nagar, which would take its overall captive power
capacity beyond 400MW.
19
22
24
27 27
0
5
10
15
20
25
30
CY2007 CY2008 CY2009 CY2010E CY2011E
(mtpa)
5. Ambuja Cements | 3QCY2010 Result Update
October 22, 2010 5
Outlook and valuation
We expect Ambuja’s top line to register a 7.8% CAGR over CY2009–11E, with
despatches expected to record a 9.2% CAGR on the back of capacity addition.
At current levels, the stock is trading at EV/EBITDA of 10.6x and EV/tonne of
US $157 on CY2011E estimates and is fairly priced. Hence, we maintain our
Neutral view on the stock.
Exhibit 6: Change in estimates
CY10E CY11E
(` cr) Earlier Revised Chg (%) Earlier Revised Chg (%)
Net sales 7,277 7,335 0.8 8,033 8,171 1.7
Operating exp. 5,494 5,337 (2.9) 5,991 6,314 5.4
Operating profit 1,783 1,998 12.1 2,042 1,858 (9.0)
Depreciation 388 388 0.0 443 481 8.6
Interest 15 15 0.0 19 21 12.1
PBT 1,599 1,815 13.5 1,842 1,478 (19.8)
Tax 520 590 13.5 599 480 (19.8)
PAT 1,079 1,225 13.6 1,243 997 (19.8)
Source: Angel Research
Exhibit 7: Key assumptions
Earlier estimates Revised estimates
CY10E CY11E CY10E CY11E
Installed capacity (mtpa) 25 27 27 27
Growth (%) 11 8 20 0
Utilisation (%) 83 85 77 85
Despatches (mn tonnes) 20.8 23 20.8 23
Net realisation/tonne (`) 3,500 3,500 3,575 3,646
Growth (%) (6) - (4) 2
Raw-material costs/tonne (`) 420 357 420 510
Power cost/tonne (`) 768 775 768 800
EBITDA/tonne (`) 858 846 974 829
Source: Angel Research
11. Ambuja Cements | 3QCY2010 Result Update
October 22, 2010 11
Research Team Tel: 022 - 4040 3800 E-mail: research@angeltrade.com Website: www.angeltrade.com
DISCLAIMER
This document is solely for the personal information of the recipient, and must not be singularly used as the basis of any investment
decision. Nothing in this document should be construed as investment or financial advice. Each recipient of this document should make
such investigations as they deem necessary to arrive at an independent evaluation of an investment in the securities of the companies
referred to in this document (including the merits and risks involved), and should consult their own advisors to determine the merits and
risks of such an investment.
Angel Broking Limited, its affiliates, directors, its proprietary trading and investment businesses may, from time to time, make
investment decisions that are inconsistent with or contradictory to the recommendations expressed herein. The views contained in this
document are those of the analyst, and the company may or may not subscribe to all the views expressed within.
Reports based on technical and derivative analysis center on studying charts of a stock's price movement, outstanding positions and
trading volume, as opposed to focusing on a company's fundamentals and, as such, may not match with a report on a company's
fundamentals.
The information in this document has been printed on the basis of publicly available information, internal data and other reliable
sources believed to be true, but we do not represent that it is accurate or complete and it should not be relied on as such, as this
document is for general guidance only. Angel Broking Limited or any of its affiliates/ group companies shall not be in any way
responsible for any loss or damage that may arise to any person from any inadvertent error in the information contained in this report.
Angel Broking Limited has not independently verified all the information contained within this document. Accordingly, we cannot testify,
nor make any representation or warranty, express or implied, to the accuracy, contents or data contained within this document. While
Angel Broking Limited endeavours to update on a reasonable basis the information discussed in this material, there may be regulatory,
compliance, or other reasons that prevent us from doing so.
This document is being supplied to you solely for your information, and its contents, information or data may not be reproduced,
redistributed or passed on, directly or indirectly.
Angel Broking Limited and its affiliates may seek to provide or have engaged in providing corporate finance, investment banking or
other advisory services in a merger or specific transaction to the companies referred to in this report, as on the date of this report or in
the past.
Neither Angel Broking Limited, nor its directors, employees or affiliates shall be liable for any loss or damage that may arise from or in
connection with the use of this information.
Note: Please refer to the important `Stock Holding Disclosure' report on the Angel website (Research Section). Also, please
refer to the latest update on respective stocks for the disclosure status in respect of those stocks. Angel Broking Limited and
its affiliates may have investment positions in the stocks recommended in this report.
Disclosure of Interest Statement Ambuja Cements
1. Analyst ownership of the stock No
2. Angel and its Group companies ownership of the stock No
3. Angel and its Group companies' Directors ownership of the stock No
4. Broking relationship with company covered No
Note: We have not considered any Exposure below `1 lakh for Angel, its Group companies and Directors.
Ratings (Returns) : Buy (> 15%) Accumulate (5% to 15%) Neutral (-5 to 5%)
Reduce (-5% to 15%) Sell (< -15%)