Call Girls Service Nagpur Maya Call 7001035870 Meet With Nagpur Escorts
Asian paints ru2 qfy2011-271010
1. Please refer to important disclosures at the end of this report 1
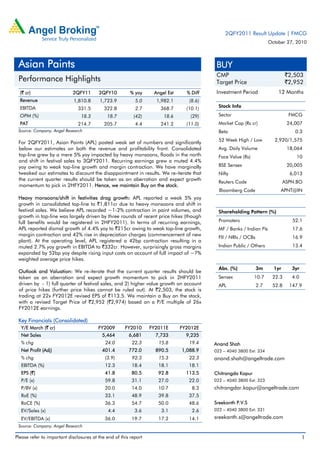
(` cr) 2QFY11 2QFY10 % yoy Angel Est % Diff
Revenue 1,810.8 1,723.9 5.0 1,982.1 (8.6)
EBITDA 331.5 322.8 2.7 368.7 (10.1)
OPM (%) 18.3 18.7 (42) 18.6 (29)
PAT 214.7 205.7 4.4 241.2 (11.0)
Source: Company, Angel Research
For 2QFY2011, Asian Paints (APL) posted weak set of numbers and significantly
below our estimates on both the revenue and profitability front. Consolidated
top-line grew by a mere 5% yoy impacted by heavy monsoons, floods in the north
and shift in festival sales to 3QFY2011. Recurring earnings grew a muted 4.4%
yoy owing to weak top-line growth and margin contraction. We have marginally
tweaked our estimates to discount the disappointment in results. We re-iterate that
the current quarter results should be taken as an aberration and expect growth
momentum to pick in 2HFY2011. Hence, we maintain Buy on the stock.
Heavy monsoons/shift in festivities drag growth: APL reported a weak 5% yoy
growth in consolidated top-line to `1,811cr due to heavy monsoons and shift in
festival sales. We believe APL recorded ~1-2% contraction in paint volumes, and
growth in top-line was largely driven by three rounds of recent price hikes (though
full benefits would be registered in 2HFY2011). In terms of recurring earnings,
APL reported dismal growth of 4.4% yoy to `215cr owing to weak top-line growth,
margin contraction and 42% rise in depreciation charges (commencement of new
plant). At the operating level, APL registered a 42bp contraction resulting in a
muted 2.7% yoy growth in EBITDA to `332cr. However, surprisingly gross margins
expanded by 52bp yoy despite rising input costs on account of full impact of ~7%
weighted average price hikes.
Outlook and Valuation: We re-iterate that the current quarter results should be
taken as an aberration and expect growth momentum to pick in 2HFY2011
driven by - 1) full quarter of festival sales, and 2) higher value growth on account
of price hikes (further price hikes cannot be ruled out). At `2,503, the stock is
trading at 22x FY2012E revised EPS of `113.5. We maintain a Buy on the stock,
with a revised Target Price of `2,952 (`2,974) based on a P/E multiple of 26x
FY2012E earnings.
Key Financials (Consolidated)
Y/E March (` cr) FY2009 FY2010 FY2011E FY2012E
Net Sales 5,464 6,681 7,733 9,235
% chg 24.0 22.3 15.8 19.4
Net Profit (Adj) 401.4 772.0 890.5 1,088.9
% chg (3.9) 92.3 15.3 22.3
EBITDA (%) 12.3 18.4 18.1 18.1
EPS (`) 41.8 80.5 92.8 113.5
P/E (x) 59.8 31.1 27.0 22.0
P/BV (x) 20.0 14.0 10.7 8.3
RoE (%) 33.1 48.9 39.8 37.5
RoCE (%) 36.3 54.7 50.0 48.6
EV/Sales (x) 4.4 3.6 3.1 2.6
EV/EBITDA (x) 36.0 19.7 17.2 14.1
Source: Company, Angel Research
BUY
CMP `2,503
Target Price `2,952
Investment Period 12 Months
Stock Info
Sector FMCG
Market Cap (Rs cr) 24,007
Beta 0.3
52 Week High / Low 2,920/1,575
Avg. Daily Volume 18,064
Face Value (Rs) 10
BSE Sensex 20,005
Nifty 6,013
Reuters Code ASPN.BO
Bloomberg Code APNT@IN
Shareholding Pattern (%)
Promoters 52.1
MF / Banks / Indian Fls 17.6
FII / NRIs / OCBs 16.9
Indian Public / Others 13.4
Abs. (%) 3m 1yr 3yr
Sensex 10.7 22.3 4.0
APL 2.7 52.8 147.9
Anand Shah
022 – 4040 3800 Ext: 334
anand.shah@angeltrade.com
Chitrangda Kapur
022 – 4040 3800 Ext: 323
chitrangdar.kapur@angeltrade.com
Sreekanth P.V.S
022 – 4040 3800 Ext: 331
sreekanth.s@angeltrade.com
Asian Paints
Performance Highlights
2QFY2011 Result Update | FMCG
October 27, 2010
2. 2QFY2011 Result Update | FMCG
October 27, 2010 2
Exhibit 1: Quarterly Performance (Consolidated)
Y/E March (Rs cr) 2QFY11 2QFY10 % chg H1FY11 H1FY10 % chg
Net Sales 1,810.8 1,723.9 5.0 3,641.0 3,184.2 14.3
Consumption of RM 1,019.7 979.8 4.1 2,068.5 1,798.9 15.0
(% of Sales) 56.3 56.8 56.8 56.5
Staff Costs 108.6 96.5 12.6 227.5 200.8 13.3
(% of Sales) 6.0 5.6 6.2 6.3
Other Expenses 350.9 324.9 8.0 666.4 585.9 13.8
(% of Sales) 19.4 18.8 18.3 18.4
Total Expenditure 1,479.3 1,401.2 5.6 2,962.4 2,585.6 14.6
Operating Profit 331.5 322.8 2.7 678.6 598.6 13.4
OPM (%) 18.3 18.7 18.6 18.8
Interest 4.6 6.4 (29.2) 8.8 13.6 (35.5)
Dep. & Amortisation 28.4 20.0 42.2 55.3 39.8 39.1
Other Income 24.9 24.7 0.8 43.3 40.3 7.4
Profit/Loss from Associate - - 43.31 40.32
PBT (excl. Extr Items) 323.4 321.1 0.7 701.1 625.8 12.0
(% of Sales) 17.9 18.6 19.3 19.7
Provision for Taxation 98.4 106.5 (7.6) 199.7 190.9 4.6
(% of PBT) 30.4 33.2 28.5 30.5
Minority Interest 10.3 8.9 21.2 12.9
Recurring PAT (After MI) 214.7 205.7 4.4 480.2 422.1 13.8
Extr Income/(Expense) - (62.7) - (62.7)
Prior Period Items 0.0 0.0 0.0 0.0
Reported PAT 214.7 268.4 (20.0) 480.2 484.8 (0.9)
PATM (%) 11.9 15.6 13.2 15.2
Equity shares (cr) 9.6 9.6 9.6 9.6
Adjusted EPS (Rs) 22.4 28.0 (20.0) 50.1 50.5 (0.9)
Source: Company, Angel Research
Top-line growth weak due to heavy monsoons and shift in festivities
APL reported a weak growth of 5% yoy in consolidated top-line to `1,811cr
(`1,724cr) impacted largely due to heavy monsoons, floods in north and shift in
festivities (all festival sales to be recorded in 3QFY2011 vis-à-vis 2QFY2010 which
recorded partial sales from festivities). We believe APL recorded a ~1-2% contraction
in paint volumes and growth in top-line was largely driven by the three rounds of
recent price hikes (though full benefits would be registered in 2HFY2011).
Standalone paint sales registered a growth of 6% yoy in value terms. Management
highlighted that retail demand continues to be robust (especially in the south and
east) and volumes were strong till July. However, August and September witnessed
poor off-take due to heavy rains across the country and the same also impacted
industrial paints demand due to delayed projects.
3. 2QFY2011 Result Update | FMCG
October 27, 2010 3
Exhibit 2: Heavy monsoons/shift in festivities impact top-line growth
Source: Company, Angel Research
Recurring earnings up 4%, reported declines
APL reported a dismal growth of 4.4% yoy in recurring earnings to `215cr (`206cr),
despite the 273bp decline in the tax rate (partially owing to higher contribution of
international business) owing to weak top-line growth, margin contraction and 42%
rise in depreciation charges (commencement of new plant). However, on a reported
basis, APL posted a decline of 20% yoy in earnings to `215cr (`268cr) owing to the
extraordinary gain of `62.7cr in 2QFY2010 due to the partial stake sale in ICI.
OPM contracts despite gross margin expansion
At the operating level, APL registered a 42bp contraction in OPM which coupled with
weak top-line growth resulted in a muted 2.7% yoy growth in EBITDA to `332cr
(`323cr). However, surprisingly gross margins expanded by 52bp yoy despite rising
input costs on account of full impact of the ~7% weighted average price hikes (taken
in three rounds in May, July and August). Nonetheless, higher staff costs (up 40bp
yoy) and other expenses (up 53bp yoy) dragged operating margins.
Exhibit 3: Earnings impacted by weak top-line
Source: Company, Angel Research
Exhibit 4: Gross margins expand due to price hikes
Source: Company, Angel Research
-
5.0
10.0
15.0
20.0
25.0
30.0
35.0
-
200
400
600
800
1,000
1,200
1,400
1,600
1,800
2,000
2Q09 3Q09 4Q09 1Q10 2Q10 3Q10 4Q10 1Q11 2Q11
(yoy%)
(`cr)
Top-line (LHS) YoY growth (RHS)
(100.0)
(50.0)
-
50.0
100.0
150.0
200.0
250.0
300.0
10
60
110
160
210
260
310
2Q09
3Q09
4Q09
1Q10
2Q10
3Q10
4Q10
1Q11
2Q11
(yoy%)
(`cr)
PAT (LHS) YoY growth (RHS)
14.2
8.3
12.4
18.9 18.7 19.6
16.6
19.0 18.3
38.9
36.2 38.6
43.9 43.2 43.7 44.2 42.7 43.7
-
10.0
20.0
30.0
40.0
50.0
2Q09
3Q09
4Q09
1Q10
2Q10
3Q10
4Q10
1Q11
2Q11
(%)
OPM Gross Margin
4. 2QFY2011 Result Update | FMCG
October 27, 2010 4
Analyst Meet - Key Takeaways
2QFY2011 impacted due to one-off factors: Current quarter result was impacted
by one-off factors like: 1) sluggish demand in August-September due to heavy
monsoons (management indicated that recovery is on track, October has been
good and expects 2HFY2011 to be significantly better), 2) shift in festival sales to
3QFY2011 vis-à-vis festival sales recorded in base quarter of 2QFY2010, and
3) pipeline correction in inventory by dealers ahead of price hikes taken in the
last 3-5 months.
Demand conditions robust: Management highlighted that retail demand
continues to be robust especially in the south and east. Moreover, rural demand
is significantly better than the larger towns. In terms of segments, both interior
and exterior emulsions continue to post good growth.
Raw material prices on uptrend: Raw material prices continue to inch up. APL’s
material price index for the quarter moved to 112.36 from 106.48 in 1Q
(FY2010 taken as a base of 100). The material index for 1HFY2011 stood at
109.59.
Roll-out of retail initiatives on track: APL has already installed 17,000
Colourworld outlets which have become an essential part of dealer network.
Signature stores continue to receive good response and a second outlet is being
set up in NCR. Colour Ideas stores also continue to receive tremendous response
and 5 more stores will be commissioned soon (in addition to 8 till March 2010).
Capex on track: Management highlighted that the new plant in Khandala is on
track and has already received environmental clearance. Phase I is expected to
get commissioned in 4QFY2013 with capacity of 300,000KL at a cost of
Rs1,000cr (including cost of land) with Rs100cr capex would be incurred in
FY2011. Management has guided for total capex of Rs250cr.
International business witnessing signs of slowdown: Management highlighted
that several subsidiaries continue to face uncertain and challenging market
conditions. Amongst geographies, Caribbean (no immediate revival expected),
Bahrain and UAE (facing market stagnation) and Singapore have witnessed
sluggish demand. However, South Asia continues to witness good demand. For
1HFY2011, international business revenues witnessed a decline of 2.9% yoy
(growth adjusted for exchange rate impact was 2% yoy), whereas EBIT declined
8% yoy (adjusted for exchange rate impact, decline was 3.3% yoy).
5. 2QFY2011 Result Update | FMCG
October 27, 2010 5
Investment Rationale
Demand conditions robust, model in volume CAGR of 15.5% over FY2010-12E:
Underlying demand conditions in decorative paints continues to be robust across
markets (2QFY2011 an aberration due to heavy monsoons and shift in festival
sales) driven by: 1) economic recovery, 2) shorter repainting cycles, and 3)
continuing strong demand in tier-II and III cities. For APL, we have modeled in a
15.5% CAGR in paint volumes over FY2010-12E driven by robust demand
conditions and market share gains.
Margins to sustain at ~18% levels aided by price hikes and mixed improvement:
We expect APL to sustain its OPM at ~18% levels (marginal decline of 30bp over
FY2010-12E) aided by: 1) strong pricing power as reflected in three rounds of
recent price hikes amounting to cumulative hike of ~8%, 2) superior product mix
(higher proportion of emulsions), 3) higher operating leverage (driven by strong
top-line growth), and 4) improvement in profitability of international operations
(aided by closure of loss-making subsidiaries in South East Asia).
Outlook and Valuation
Post the 2QFY2011 results, we have marginally tweaked our FY2011E and FY2012E
estimates downwards to discount the disappointment in results. Nonetheless, we
re-iterate that the current quarter results should be taken as an aberration and
expect growth momentum to pick up in 2HFY2011 driven by: 1) full quarter of
festival sales, and 2) higher value growth on account of price hikes (further price
hikes cannot be ruled out). However, sluggish growth in international business from
markets like Caribbean, Middle East and Singapore remains a concern.
Exhibit 5: Change in Estimates
Old Estimate New Estimate % chg
(` cr) FY11E FY12E FY11E FY12E FY11E FY12E
Revenue 7,849 9,322 7,733 9,235 (1.5) (0.9)
OPM (%) 18.2 18.1 18.1 18.1 (15bp) (3bp)
EPS (`) 95.8 114.4 92.8 113.5 (3.1) (0.8)
Source: Company, Angel Research
At `2,503, the stock is trading at 22x FY2012E revised EPS of `113.5. We maintain
a Buy on the stock, with a revised Target Price of `2,952 (`2,974)) based on P/E
multiple of 26x FY2012E earnings (~20-25% premium to its historical valuations),
justified due to the sustained double-digit volume growth (2QFY2011 an aberration),
stronger pricing power (as reflected in recent round of price hikes) and stable
margins.
6. 2QFY2011 Result Update | FMCG
October 27, 2010 6
Exhibit 6: Key Assumptions (Consolidated)
Y/e March (` cr) FY2009 FY2010 FY2011E FY2012E
Paints India (Gross Sales) 4,864 5,603 7,005 8,523
Volume growth (%) 13.4 16.4 14.7 17.0
Realisation growth (%) 9.8 (1.0) 9.0 4.0
Others 139 150 176 200
Standalone Net Sales (Less of Excise) 4,270 5,125 6,327 7,691
APPG (Automotive 50:50 JV) 192 218 247 282
APICL (Industrial) 60 71 82 92
International Business 947 1,264 1,078 1,170
Consolidated Net Sales 5,463 6,681 7,733 9,235
YoY growth (%)
Paints India (Gross Sales) 24.5 15.2 25.0 21.7
Others (11.1) 7.9 17.2 13.6
Standalone Net Sales (Less of Excise) 24.9 20.0 23.5 21.6
APPG (Automotive 50:50 JV) (2.7) 13.9 13.1 14.0
APICL (Industrial) 2.2 18.4 15.0 13.0
International Business 28.5 33.4 (14.7) 8.6
Consolidated Net Sales 24.0 22.3 15.8 19.4
Source: Company, Angel Research
11. 2QFY2011 Result Update | FMCG
October 27, 2010 11
Research Team Tel: 022 - 4040 3800 E-mail: research@angeltrade.com Website: www.angeltrade.com
Disclaimer
This document is solely for the personal information of the recipient, and must not be singularly used as the basis of any investment
decision. Nothing in this document should be construed as investment or financial advice. Each recipient of this document should make
such investigations as they deem necessary to arrive at an independent evaluation of an investment in the securities of the companies
referred to in this document (including the merits and risks involved), and should consult their own advisors to determine the merits and
risks of such an investment.
Angel Broking Limited, its affiliates, directors, its proprietary trading and investment businesses may, from time to time, make
investment decisions that are inconsistent with or contradictory to the recommendations expressed herein. The views contained in this
document are those of the analyst, and the company may or may not subscribe to all the views expressed within.
Reports based on technical and derivative analysis center on studying charts of a stock's price movement, outstanding positions and
trading volume, as opposed to focusing on a company's fundamentals and, as such, may not match with a report on a company's
fundamentals.
The information in this document has been printed on the basis of publicly available information, internal data and other reliable
sources believed to be true, but we do not represent that it is accurate or complete and it should not be relied on as such, as this
document is for general guidance only. Angel Broking Limited or any of its affiliates/ group companies shall not be in any way
responsible for any loss or damage that may arise to any person from any inadvertent error in the information contained in this report.
Angel Broking Limited has not independently verified all the information contained within this document. Accordingly, we cannot testify,
nor make any representation or warranty, express or implied, to the accuracy, contents or data contained within this document. While
Angel Broking Limited endeavours to update on a reasonable basis the information discussed in this material, there may be regulatory,
compliance, or other reasons that prevent us from doing so.
This document is being supplied to you solely for your information, and its contents, information or data may not be reproduced,
redistributed or passed on, directly or indirectly.
Angel Broking Limited and its affiliates may seek to provide or have engaged in providing corporate finance, investment banking or
other advisory services in a merger or specific transaction to the companies referred to in this report, as on the date of this report or in
the past.
Neither Angel Broking Limited, nor its directors, employees or affiliates shall be liable for any loss or damage that may arise from or in
connection with the use of this information.
Note: Please refer to the important `Stock Holding Disclosure' report on the Angel website (Research Section). Also, please refer to the
latest update on respective stocks for the disclosure status in respect of those stocks. Angel Broking Limited and its affiliates may have
investment positions in the stocks recommended in this report.
Disclosure of Interest Statement Asian Paints
1. Analyst ownership of the stock No
2. Angel and its Group companies ownership of the stock Yes
3. Angel and its Group companies' Directors ownership of the stock No
4. Broking relationship with company covered No
Note: We have not considered any Exposure below ` 1 lakh for Angel, its Group companies and Directors.
Ratings (Returns): Buy (> 15%) Accumulate (5% to 15%) Neutral (-5 to 5%)
Reduce (-5% to 15%) Sell (< -15%)