1. Derivative Report
India Research
April 23, 2010
Comments
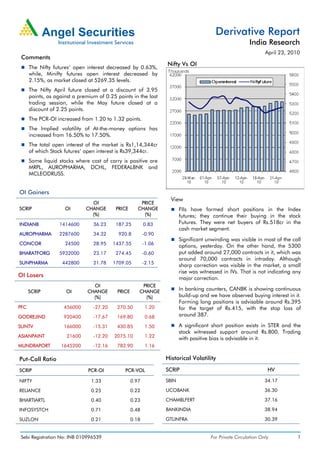
Nifty Vs OI
The Nifty futures’ open interest decreased by 0.63%,
while, Minifty futures open interest decreased by
2.15%, as market closed at 5269.35 levels.
The Nifty April future closed at a discount of 3.95
points, as against a premium of 0.25 points in the last
trading session, while the May future closed at a
discount of 2.25 points.
The PCR-OI increased from 1.20 to 1.32 points.
The Implied volatility of At-the-money options has
increased from 16.50% to 17.50%.
The total open interest of the market is Rs1,14,344cr
of which Stock futures’ open interest is Rs39,344cr.
Some liquid stocks where cost of carry is positive are
MRPL, AUROPHARMA, DCHL, FEDERALBNK and
MCLEODRUSS.
OI Gainers
View
OI PRICE
SCRIP OI CHANGE PRICE CHANGE FIIs have formed short positions in the Index
(%) (%) futures; they continue their buying in the stock
INDIANB 1414600 36.23 187.25 0.83 Futures. They were net buyers of Rs.518cr in the
cash market segment.
AUROPHARMA 2287600 34.32 920.8 -0.90
Significant unwinding was visible in most of the call
CONCOR 24500 28.95 1437.55 -1.06
options, yesterday. On the other hand, the 5300
BHARATFORG 5932000 23.17 274.45 -0.60 put added around 27,000 contracts in it, which was
around 70,000 contracts in intraday. Although
SUNPHARMA 442800 21.78 1709.05 -2.15
sharp correction was visible in the market, a small
rise was witnessed in IVs. That is not indicating any
OI Losers major correction.
OI PRICE
SCRIP OI CHANGE PRICE CHANGE
In banking counters, CANBK is showing continuous
(%) (%) build-up and we have observed buying interest in it.
Forming long positions is advisable around Rs.395
PFC 456000 -27.20 270.50 1.20 for the target of Rs.415, with the stop loss of
GODREJIND 920400 -17.67 169.80 0.68 around 387.
SUNTV 166000 -15.31 430.85 1.50 A significant short position exists in STER and the
stock witnessed support around Rs.800. Trading
ASIANPAINT 21600 -12.20 2075.10 1.22 with positive bias is advisable in it.
MUNDRAPORT 1645200 -12.16 782.90 1.16
Put-Call Ratio Historical Volatility
SCRIP PCR-OI PCR-VOL SCRIP HV
NIFTY 1.33 0.97 SBIN 34.17
RELIANCE 0.25 0.22 UCOBANK 36.30
BHARTIARTL 0.40 0.23 CHAMBLFERT 37.16
INFOSYSTCH 0.71 0.48 BANKINDIA 38.94
SUZLON 0.21 0.18 GTLINFRA 30.39
Sebi Registration No: INB 010996539 For Private Circulation Only 1
2. Derivative Report | India Research
FII Statistics for 22-April-2010 Turnover on 22-April-2010
Open Interest
No. of Turnover Change
Detail Buy Sell Net Instrument
Contracts (Rs. in cr.) (%)
Contracts Value Change
(Rs. in cr.) (%)
INDEX Index Futures 1032773 26479.88 159.42
3407.07 3851.26 (444.18) 556441 14861.66 1.17
FUTURES
INDEX Stock Futures 741041 26818.94 37.18
5670.87 4614.61 1,056.26 1621024 42744.48 2.31
OPTIONS
STOCK Index Options 3269708 86732.92 140.51
4136.74 3790.06 346.68 963038 31965.98 1.88
FUTURES
STOCK Stock Options 143047 5776.86 47.33
464.70 565.59 (100.89) 35124 1148.59 14.69
OPTIONS
TOTAL 13679.38 12821.51 857.87 3175627 90720.71 2.10 Total 5186569 145808.60 109.07
Nifty Spot = 5269.35 Lot Size = 50
Bull-Call Spreads Bear-Put Spreads
Action Strike Price Risk Reward BEP Action Strike Price Risk Reward BEP
Buy 5300 32.05 Buy 5200 27.95
24.65 75.35 5324.65 16.70 83.30 5183.30
Sell 5400 7.40 Sell 5100 11.25
Buy 5300 32.05 Buy 5200 27.95
30.25 169.75 5330.25 22.95 177.05 5177.05
Sell 5500 1.80 Sell 5000 5.00
Buy 5400 7.40 Buy 5100 11.25
5.60 94.40 5405.60 6.25 93.75 5093.75
Sell 5500 1.80 Sell 5000 5.00
Note: Above mentioned Bullish or Bearish Spreads in Nifty (April Series) are given as an information and not as a recommendation
Nifty Put-Call Analysis
For Private Circulation Only Sebi Registration No: INB 010996539 2
3. Derivative Report | India Research
Strategy Date Scrip Strategy Status
29-March-2010 SUZLON Long Call Continue
29-March-2010 IDBI Long Call Profit Booked on 06-Apr-2010
05-April-2010 RNRL Long Call Continue
05-April-2010 HUL Long Put Profit Booked on 08-Apr-2010
12-April-2010 JPASSOCIAT Ratio Call Spread Continue
19-April-2010 BHARTIARTL Long Call Did not trigger
DISCLAIMER:
This document is not for public distribution and has been furnished to you solely for your information and must not be reproduced or redistributed to any other person.
Persons into whose possession this document may come are required to observe these restrictions.
Opinion expressed is our current opinion as of the date appearing on this material only. While we endeavor to update on a reasonable basis the information discussed in
this material, there may be regulatory, compliance, or other reasons that prevent us from doing so. Prospective investors and others are cautioned that any forward-
looking statements are not predictions and may be subject to change without notice. Our proprietary trading and investment businesses may make investment decisions
that are inconsistent with the recommendations expressed herein.
The information in this document has been printed on the basis of publicly available information, internal data and other reliable sources believed to be true and are for
general guidance only. While every effort is made to ensure the accuracy and completeness of information contained, the company takes no guarantee and assumes no
liability for any errors or omissions of the information. No one can use the information as the basis for any claim, demand or cause of action.
Recipients of this material should rely on their own investigations and take their own professional advice. Each recipient of this document should make such investigations
as it deems necessary to arrive at an independent evaluation of an investment in the securities of companies referred to in this document (including the merits and risks
involved), and should consult their own advisors to determine the merits and risks of such an investment. Price and value of the investments referred to in this material may
go up or down. Past performance is not a guide for future performance.
Certain transactions - futures, options and other derivatives as well as non-investment grade securities - involve substantial risks and are not suitable for all investors.
Reports based on technical analysis centers on studying charts of a stock's price movement and trading volume, as opposed to focusing on a company's fundamentals and
as such, may not match with a report on a company's fundamentals.
We do not undertake to advise you as to any change of our views expressed in this document. While we would endeavor to update the information herein on a reasonable
basis, Angel Broking, its subsidiaries and associated companies, their directors and employees are under no obligation to update or keep the information current. Also
there may be regulatory, compliance, or other reasons that may prevent Angel Broking and affiliates from doing so. Prospective investors and others are cautioned that
any forward-looking statements are not predictions and may be subject to change without notice.
Angel Broking Limited and affiliates, including the analyst who has issued this report, may, on the date of this report, and from time to time, have long or short positions
in, and buy or sell the securities of the companies mentioned herein or engage in any other transaction involving such securities and earn brokerage or compensation or
act as advisor or have other potential conflict of interest with respect to company/ies mentioned herein or inconsistent with any recommendation and related information
and opinions.
Angel Broking Limited and affiliates may seek to provide or have engaged in providing corporate finance, investment banking or other advisory services in a merger or
specific transaction to the companies referred to in this report, as on the date of this report or in the past.
Sebi Registration No.: INB 010996539
Derivative Research Team derivatives.desk@angeltrade.com
For Private Circulation Only Sebi Registration No: INB 010996539 3