Mira Road Awesome 100% Independent Call Girls NUmber-9833754194-Dahisar Inter...
Ipca ru2 qfy2011-221010
1. Please refer to important disclosures at the end of this report 1
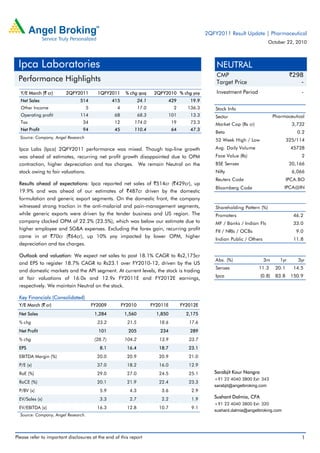
Y/E March (` cr) 2QFY2011 1QFY2011 % chg qoq 2QFY2010 % chg yoy
Net Sales 514 415 24.1 429 19.9
Other Income 5 4 17.0 2 136.3
Operating profit 114 68 68.3 101 13.3
Tax 34 12 174.0 19 73.3
Net Profit 94 45 110.4 64 47.3
Source: Company, Angel Research
Ipca Labs (Ipca) 2QFY2011 performance was mixed. Though top-line growth
was ahead of estimates, recurring net profit growth disappointed due to OPM
contraction, higher depreciation and tax charges. We remain Neutral on the
stock owing to fair valuations.
Results ahead of expectations: Ipca reported net sales of `514cr (`429cr), up
19.9% and was ahead of our estimates of `487cr driven by the domestic
formulation and generic export segments. On the domestic front, the company
witnessed strong traction in the anti-malarial and pain-management segments,
while generic exports were driven by the tender business and US region. The
company clocked OPM of 22.2% (23.5%), which was below our estimate due to
higher employee and SG&A expenses. Excluding the forex gain, recurring profit
came in at `70cr (`64cr), up 10% yoy impacted by lower OPM, higher
depreciation and tax charges.
Outlook and valuation: We expect net sales to post 18.1% CAGR to Rs2,175cr
and EPS to register 18.7% CAGR to Rs23.1 over FY2010-12, driven by the US
and domestic markets and the API segment. At current levels, the stock is trading
at fair valuations of 16.0x and 12.9x FY2011E and FY2012E earnings,
respectively. We maintain Neutral on the stock.
Key Financials (Consolidated)
Y/E March (` cr) FY2009 FY2010 FY2011E FY2012E
Net Sales 1,284 1,560 1,850 2,175
% chg 23.2 21.5 18.6 17.6
Net Profit 101 205 234 289
% chg (28.7) 104.2 13.9 23.7
EPS 8.1 16.4 18.7 23.1
EBITDA Margin (%) 20.0 20.9 20.9 21.0
P/E (x) 37.0 18.2 16.0 12.9
RoE (%) 29.0 27.0 24.5 25.1
RoCE (%) 20.1 21.9 22.4 23.3
P/BV (x) 5.9 4.3 3.6 2.9
EV/Sales (x) 3.3 2.7 2.2 1.9
EV/EBITDA (x) 16.3 12.8 10.7 9.1
Source: Company, Angel Research.
NEUTRAL
CMP `298
Target Price -
Investment Period -
Stock Info
Sector
Bloomberg Code
Shareholding Pattern (%)
Promoters 46.2
MF / Banks / Indian Fls 33.0
FII / NRIs / OCBs 9.0
Indian Public / Others 11.8
Abs. (%) 3m 1yr 3yr
Sensex 11.3 20.1 14.5
Ipca (0.8) 83.8 150.9
2
20,166
6,066
IPCA.BO
IPCA@IN
3,732
0.2
325/114
45728
Pharmaceutical
Avg. Daily Volume
Market Cap (Rs cr)
Beta
52 Week High / Low
Face Value (Rs)
BSE Sensex
Nifty
Reuters Code
Sarabjit Kour Nangra
+91 22 4040 3800 Ext: 343
sarabjit@angelbroking.com
Sushant Dalmia, CFA
+91 22 4040 3800 Ext: 320
sushant.dalmia@angelbroking.com
Ipca Laboratories
Performance Highlights
2QFY2011 Result Update | Pharmaceutical
October 22, 2010
2. Ipca Laboratories | 2QFY2011 Result Update
October 22, 2010 2
Exhibit 1: 2QFY2011 performance
Y/E March (` cr) 2QFY2011 1QFY2011 % chg 2QFY2010 % chg 1HFY2011 1HFY2010 % chg
Net Sales 514 415 24.1 429 19.9 929 787 18.1
Other Income 5 4 17.0 2 136.3 9 7 20.9
Total Income 519 419 24.0 431 20.5 937.6 793.8 18.1
Gross profit 310 240 29.3 255 21.4 550 464 18.5
Gross margins (%) 60.2 57.8 59.5 59.2 59.0
Operating profit 114 68 68.3 101 13.3 182 171 6.1
Operating Margin (%) 22.2 16.3 23.5 19.6 21.8
Interest 6 5 27.6 7 (12.2) 11 15 (24.7)
Depreciation 14 13 6.2 12 16.9 27 23 17.0
PBT 99 54 82.9 84 17.9 153 141 8.3
Provision for Taxation 34 12 174.0 19 73.3 46 33 38.6
PAT before Extra-ordinary item 65 42 56.0 64 1.1 107 108 (1.0)
Less: Exceptional Items (29) (3) - 1 - (26) (6)
PAT after Extra-ordinary item & MI 94 45 110.4 64 47.3 133 114 17.0
EPS (`) 7.5 3.1 5.1 10.6 9.1
Source: Company, Angel Research
Exhibit 2: 2QFY2011- Actual v/s Angel estimates
` cr Actual Estimate Variation %
Net Sales 514 487 5.6
Other Income 5 4 18.8
Operating Profit 114 110 3.6
Interest 6 6 12.7
Tax 34 23 46.5
Net Profit 94 73 28.9
Source: Company, Angel Research
Revenue beats estimates, up 20%: Ipca reported net sales of `514cr (`429cr), up
19.9% and was ahead of our estimate of `487cr. On the domestic front,
formulation sales grew 29.4% to `222cr (`171cr) driven by anti-malarial and
pain-management segments. The domestic API sales grew by 8.1% to ` 41cr
(` 38cr).
On the export front, formulation sales grew by a strong 27.1% to ` 175cr (`138cr)
driven by the generic business. In generics, the company witnessed strong traction
in the tender business with sales growing 3x yoy to `26cr (`8cr), while sales in the
US increased by 55.3% to `24cr (` 15cr). The company expects the tender
business to clock `40-45cr in 2HFY2011. In the US, the company has filed for 20
ANDAs and has 10 approvals. Ipca, with the launch of seven products in the US,
has been able to clock US $3mn revenue per product. However, UK sales grew by
a mere 11.0% to `70cr (`63cr) on the back of currency appreciation. The branded
generic business sales was flat at `45cr (`43cr) as sales in Russia was impacted by
labeling revision. API exports declined 7% to `76cr (`82cr).
3. Ipca Laboratories | 2QFY2011 Result Update
October 22, 2010 3
Exhibit 3: Domestic sales trend
Source: Company, Angel Research
Exhibit 4: Export sales trend
Source: Company, Angel Research
OPM contracts on the back of higher employee and SG&A expenses: The
company clocked OPM of 22.2% (23.5%), which was below our estimates. Though
gross margins were flat at 60.2%, OPM was impacted by higher employee, export
freight and promotional expenses. Ipca hired 1,000 MRs in 4QFY2010 owing to
which employee expenses for the quarter grew 21.8% to `70cr (`57cr). Ipca now
has 4,000 MRs on the domestic front and a 500 strong sales force on the
international front, which would aid growth going forward. Similarly, SG&A
expenses grew 29.7% to `126cr (`97cr) due to higher export freight and
promotional expenses.
171
159
121
168
222
38 34 32 36 41
0
40
80
120
160
200
240
2QFY2010 3QFY2010 4QFY2010 1QFY2011 2QFY2011
Formulation API
(`cr)
138
126 131
122
175
82
75 79
88
76
0
40
80
120
160
200
2QFY2010 3QFY2010 4QFY2010 1QFY2011 2QFY2011
Formulation API
(`cr)
4. Ipca Laboratories | 2QFY2011 Result Update
October 22, 2010 4
Exhibit 5: OPM trend
Source: Company, Angel Research
Recurring profit disappoints: The company reported net profit of `94cr (`64cr), up
47.3% yoy which was boosted by forex translation gains of `29cr. Excluding gains
recurring profit came in at `70cr (`64cr), up by a mere 10% yoy impacted by lower
OPM, higher depreciation and tax charges. From forex gains of `29cr, the
company registered realised gains of `15cr.
Exhibit 6: Net profit trend
Source: Company, Angel Research
Concall takeaways
On the capex front, the company expects to incur expenses to the tune of
`220cr in FY2011 and `200cr in FY2012 for its formulation plant at Sikkim
and API plant at Ratlam.
On the forex front, Ipca has forward cover of US $124mn at 47.8/US$.
The company’s facility at the Indore SEZ has received the UK MHRA approval
and expects to receive US FDA approval by 4QFY2011. The company expects
its fixed cost to be recovered with the commencement of sales to the UK
region. The plant is specifically dedicated to cater to the US region.
23.5
22.5
17.8
16.3
22.2
10.0
13.0
16.0
19.0
22.0
25.0
2QFY2010 3QFY2010 4QFY2010 1QFY2011 2QFY2011
(%)
64
58
37 39
94
0
20
40
60
80
100
2QFY2010 3QFY2010 4QFY2010 1QFY2011 2QFY2011
(`cr)
5. Ipca Laboratories | 2QFY2011 Result Update
October 22, 2010 5
Recommendation Rationale
Domestic formulations business the cash cow: Ipca has been successful in
changing its business focus to the high-margin chronic and lifestyle segments from
the low-margin anti-malarial segment. The chronic and lifestyle segments
comprising CVS, anti-diabetics, pain-management, CNS and dermatology
products constitute more than 50% of its domestic formulation sales. Management
has ramp up its field force significantly by 1,000 MRs (30% increase) by adding
three more divisions in the domestic formulation segment, taking the total strength
to nearly 4,000 MRs by end FY2010.
Exports to be the next avenue for growth: On the formulations front, the company
has been increasing its penetration in the regulated markets, viz. Europe and US
by expanding the list of generic drugs backed by its own API. In the emerging and
semi-regulated markets, Ipca plans to focus on building brands in the CVS, CNS,
pain-management, anti-malarial segments and tapping new geographies. On the
API front where it is among the low-cost producers, the company is aggressively
pursuing supply tie-ups with the MNC pharma companies.
Indore SEZ approval and tender business to enhance momentum: Ipca is awaiting
US FDA approval for its Indore SEZ. Once approved, the facility would cater to the
US generic market and could clock sales to the tune of Rs300-350cr (19% of its
FY2010 revenues). Further, the company has received approval from the WHO for
its anti-malarial product making it eligible to participate in global tender worth
US $300mn along with three other players.
Valuation: We expect net sales to post 18.1% CAGR to Rs2,175cr and EPS to
register 18.7% CAGR to Rs23.1 over FY2010-12 driven by the US and domestic
markets and the API segment. At current levels, the stock is trading at fair
valuations of 16.0x and 12.9x FY2011E and FY2012E earnings, respectively. We
maintain Neutral on the stock.
Exhibit 7: Key assumptions
FY2011E FY2012E
Domestic Sales Growth (%) 18.2 14.6
Export Sales Growth (%) 20.6 20.2
Growth in Employee Expenses (%) 24.6 17.2
R&D as % of Sales 4.0 4.0
Operating Margins (%) 20.9 21.0
Capex (Rs) 200 180
Net Debt/Equity (x) 0.4 0.3
Source: Company, Angel Research
10. Ipca Laboratories | 2QFY2011 Result Update
October 22, 2010 10
Research Team Tel: 022 - 4040 3800 E-mail: research@angeltrade.com Website: www.angeltrade.com
DISCLAIMER
This document is solely for the personal information of the recipient, and must not be singularly used as the basis of any investment
decision. Nothing in this document should be construed as investment or financial advice. Each recipient of this document should make
such investigations as they deem necessary to arrive at an independent evaluation of an investment in the securities of the companies
referred to in this document (including the merits and risks involved), and should consult their own advisors to determine the merits and
risks of such an investment.
Angel Broking Limited, its affiliates, directors, its proprietary trading and investment businesses may, from time to time, make
investment decisions that are inconsistent with or contradictory to the recommendations expressed herein. The views contained in this
document are those of the analyst, and the company may or may not subscribe to all the views expressed within.
Reports based on technical and derivative analysis center on studying charts of a stock's price movement, outstanding positions and
trading volume, as opposed to focusing on a company's fundamentals and, as such, may not match with a report on a company's
fundamentals.
The information in this document has been printed on the basis of publicly available information, internal data and other reliable
sources believed to be true, but we do not represent that it is accurate or complete and it should not be relied on as such, as this
document is for general guidance only. Angel Broking Limited or any of its affiliates/ group companies shall not be in any way
responsible for any loss or damage that may arise to any person from any inadvertent error in the information contained in this report.
Angel Broking Limited has not independently verified all the information contained within this document. Accordingly, we cannot testify,
nor make any representation or warranty, express or implied, to the accuracy, contents or data contained within this document. While
Angel Broking Limited endeavours to update on a reasonable basis the information discussed in this material, there may be regulatory,
compliance, or other reasons that prevent us from doing so.
This document is being supplied to you solely for your information, and its contents, information or data may not be reproduced,
redistributed or passed on, directly or indirectly.
Angel Broking Limited and its affiliates may seek to provide or have engaged in providing corporate finance, investment banking or
other advisory services in a merger or specific transaction to the companies referred to in this report, as on the date of this report or in
the past.
Neither Angel Broking Limited, nor its directors, employees or affiliates shall be liable for any loss or damage that may arise from or in
connection with the use of this information.
Note: Please refer to the important `Stock Holding Disclosure' report on the Angel website (Research Section). Also, please
refer to the latest update on respective stocks for the disclosure status in respect of those stocks. Angel Broking Limited and
its affiliates may have investment positions in the stocks recommended in this report.
Disclosure of Interest Statement Ipca Laboratories
1. Analyst ownership of the stock No
2. Angel and its Group companies ownership of the stock No
3. Angel and its Group companies' Directors ownership of the stock No
4. Broking relationship with company covered No
Note: We have not considered any Exposure below ` 1 lakh for Angel, its Group companies and Directors.
Ratings (Returns): Buy (> 15%) Accumulate (5% to 15%) Neutral (-5 to 5%)
Reduce (-5% to 15%) Sell (< -15%)