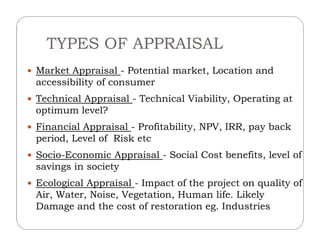
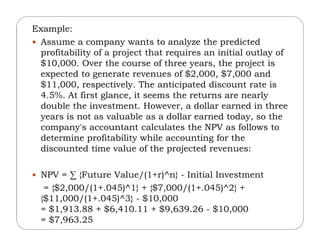
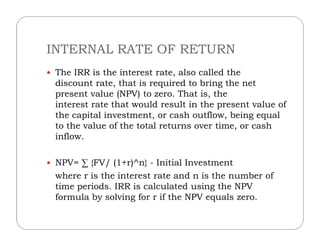
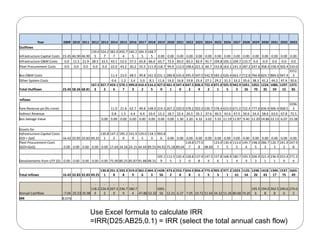
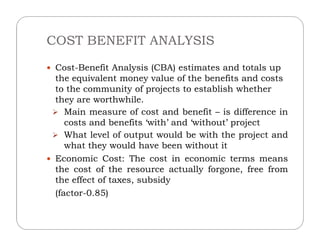
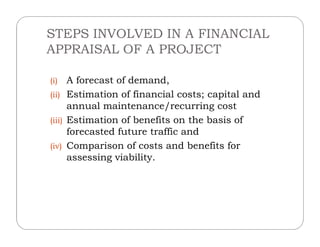
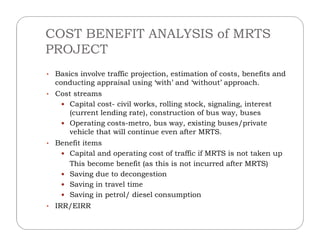
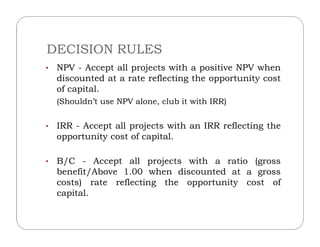
Subject:
FINANCIAL APPRAISAL
Subject:
URBAN FINANCE
Dhwani Shah, Assistant Professor
Bhaikaka Centre for Human Settlements,
APIED, Vallabh Vidyanagar.
Date- 17/12/2015
TYPES OF APPRAISAL
 Market Appraisal - Potential market, Location and
accessibility of consumer
 Technical Appraisal - Technical Viability, Operating at
optimum level?
 Financial Appraisal - Profitability, NPV, IRR, pay back Financial Appraisal - Profitability, NPV, IRR, pay back
period, Level of Risk etc
 Socio-Economic Appraisal - Social Cost benefits, level of
savings in society
 Ecological Appraisal - Impact of the project on quality of
Air, Water, Noise, Vegetation, Human life. Likely
Damage and the cost of restoration eg. Industries
FINANCIAL APPRAISAL
The Financial Appraisal test demonstrates-
methods for analyzing and evaluating a
range of fictional accounting ratios and other
commercial data to enable the candidate tocommercial data to enable the candidate to
assess the potential risks and returns of
applications and to make preliminary
recommendations on whether or not to
advance funds.
WHY NECESSARY?
• Main problem– unlimited wants/limited
resources.
• Judicious decision required – how much to
invest/where to invest/when to invest ininvest/where to invest/when to invest in
each sector of economy to achieve highest
growth of economy.
• All sectors are required to be developed at
minimum cost while achieving highest
overall economic growth
INVESTMENT CRITERIA
To investigate efficiency and profitability of
investment in a project. Two Categories of
Investment Criteria are used :
i. Non- Discounting Cash Flow Methodsi. Non- Discounting Cash Flow Methods
ii. Discounting Cash Flow Methods (DCF
method)
NON- DISCOUNTING CASH FLOW
METHODS
• Pay back period
• Rate of Return
• Annual Equivalent Method• Annual Equivalent Method
PAY BACK PERIOD
o Time in years, necessary to accumulate from
annual cash flow (cash receipts minus cash
payments – but not depreciation) – an
amount equal to initial investment.
o Simple – but ignores time value of money.
RATE OF RETURN
o Expresses profit as percentage of Capital
employed.
o Relates average annual expected incomeo Relates average annual expected income
to total initial investment.
o Both Pay back period and ROR are
popular in private industry.
ANNUAL EQUIVALENT METHOD
Total cost is converted into total annual
amounts by replacing the investment cost
with an annual equivalent cost, adding
annual operating cost, and getting the ratioannual operating cost, and getting the ratio
between the annual benefits and the total
annual cost.
DISCOUNTING CASH FLOW METHODS
 Concept: Taking time value of money
Rs. 100 today at 10% annual interest would be Rs.
110/- after a year, Rs. 121/- after 2 years , Rs.
133/- after 3 years
 Techniques:
• Net Present Values (NPV)
• Internal Rate of Return
• Benefit/Cost Ratio.
CASH FLOW
The total amount of money being transferred into and out of a business.
Year 2012 2013 2014 2015 2016
Outflows
Infrastructure Capital Costs 139.05 324.27 382.07 450.74 340.25
Infrastructure O&M Costs 28.5 33.5 43.1 52.0 57.5
Fleet Procurement Costs 0.0 0.0 22.0 43.2 30.2
Bus O&M Costs 11.4 23.0 68.5
Other System Costs 0.6 1.2 3.4
Total Outflows 167.53 357.72 459.16 570.17 499.83Total Outflows 167.53 357.72 459.16 570.17 499.83
Inflows
Fare Revenue pa (Rs crore) 11.0 21.8 62.7
Indirect Revenue 0.8 1.5 4.4
Bus Salvage Value 0.00 0.00 0.00 0.00
Grants for
Infrastructure Capital Costs- GOI + GoG 49.25 130.81 147.22 195.29 141.99
Fleet Procurement Costs (GOI+GoG) 0.00 0.00 17.64 34.56 24.15
Devolvements from UTF (D) 0.00 0.00 75.00 80.25 85.87
Total Inflows 49.25 130.81 251.58 333.38 319.09
Annual Cashflow -118.29 -226.92 -207.59 -236.79 -180.74
PRESENT VALUE (PV)
 The value in the present of a sum of money, in
contrast to some future value it will have when it
has been invested at compound interest.
 PV = FV / (1+r)n
 PV is Present Value
 FV is Future Value
 r is the interest rate (as a decimal, so 0.10, not 10%)
 n is the number of years
instead of "adding 10%" to each year it is easier to
multiply by 1.10
Future Back to Now: what money in the future is worth now, go
backwards (dividing by 1.10 each year instead of multiplying):
Examples:
1) Sam promises you $500 next year, what is the Present
Value? (r=10%)
To take a future payment backwards one year divide by
1.10
So $500 next year is $500 ÷ 1.10 = $454.55 now
The Present Value is $454.55
PV = FV / (1+r)n
2) Alex promises you $900 in 3 years, what is the Present
Value? (r=10%)
To take a future payment backwards three years divide by
1.10 three times
So $900 in 3 years is:
$900 ÷ 1.10 ÷ 1.10 ÷ 1.10
$900 ÷ (1.10 × 1.10 × 1.10)
$900 ÷ (1.10)^3
$900 ÷ 1.331
$676.18 now
NET PRESENT VALUE
 Net Present Value (NPV) is the difference
between the present value of cash inflows and
the present value of cash outflows. NPV is used
in capital budgeting to analyze the profitability
of a projected investment or project.of a projected investment or project.
 NPV = ∑ {Future Value/(1+r)^n} - Initial
Investment
where r is the rate of return and n is the number
of time periods.
Example:
 Assume a company wants to analyze the predicted
profitability of a project that requires an initial outlay of
$10,000. Over the course of three years, the project is
expected to generate revenues of $2,000, $7,000 and
$11,000, respectively. The anticipated discount rate is
4.5%. At first glance, it seems the returns are nearly
double the investment. However, a dollar earned in three
years is not as valuable as a dollar earned today, so the
company's accountant calculates the NPV as follows tocompany's accountant calculates the NPV as follows to
determine profitability while accounting for the
discounted time value of the projected revenues:
 NPV = ∑ {Future Value/(1+r)^n} - Initial Investment
= {$2,000/(1+.045)^1} + {$7,000/(1+.045)^2} +
{$11,000/(1+.045)^3} - $10,000
= $1,913.88 + $6,410.11 + $9,639.26 - $10,000
= $7,963.25
INTERNAL RATE OF RETURN
 The IRR is the interest rate, also called the
discount rate, that is required to bring the net
present value (NPV) to zero. That is, the
interest rate that would result in the present value of
the capital investment, or cash outflow, being equal
to the value of the total returns over time, or cashto the value of the total returns over time, or cash
inflow.
 NPV= ∑ {FV/ (1+r)^n} - Initial Investment
where r is the interest rate and n is the number of
time periods. IRR is calculated using the NPV
formula by solving for r if the NPV equals zero.
Year 2009 2010 2011 2012 2013 2014 2015 2016 2017 2018 2019 2020 2021 2022 2023 2024 2025 2026 2027 2028 2029 2030 2031 2032 2033
Outflows
Infrastructure Capital Costs 23.45 46.90 46.90
139.0
5
324.2
7
382.0
7
450.7
4
340.2
5
184.3
5
168.7
5 0.00 0.00 0.00 0.00 0.00 0.00 0.00 0.00 0.00 0.00 0.00 0.00 0.00 0.00 0.00
Infrastructure O&M Costs 0.0 11.5 21.9 28.5 33.5 43.1 52.0 57.5 65.8 66.0 65.7 72.6 83.0 83.3 82.9 91.7 104.8 105.1 104.7 115.7 0.0 0.0 0.0 0.0 0.0
Fleet Procurement Costs 0.0 0.0 0.0 0.0 0.0 22.0 43.2 30.2 55.5 111.9 118.7 94.0 112.0 148.6 221.3 60.7 153.8 163.1 141.3 187.2 247.6 358.4 158.4 302.4 310.0
Bus O&M Costs 11.4 23.0 68.5 99.8 161.9 231.1 280.8 335.6 395.9 507.0 542.9 583.2 626.4 663.7 712.8 766.8 824.7 884.0 947.4
1012.
3
Other System Costs 0.6 1.2 3.4 5.0 8.1 11.6 14.0 16.8 19.8 25.4 27.1 29.2 31.3 33.2 35.6 38.3 41.2 44.2 47.4 50.6
Total Outflows 23.45 58.36 68.81
167.5
3
357.7
2
459.1
6
570.1
7
499.8
3
410.4
2
516.6
5
427.0
0
461.4
1
547.4
0
647.5
2
836.6
9
722.4
2
871.0
1
925.9
5
942.9
3
1051.
35
1052.
70
1224.
35
1086.
59
1297.
15
1372.
85
Inflows
Fare Revenue pa (Rs crore) 11.0 21.8 62.7 90.8 148.0 219.3 267.2 320.0 378.2 502.0 536.7 578.4 623.0 671.0 722.4 777.6 836.9 900.4 968.5
1036.
3
Indirect Revenue 0.8 1.5 4.4 6.4 10.4 15.3 18.7 22.4 26.5 35.1 37.6 40.5 43.6 47.0 50.6 54.4 58.6 63.0 67.8 72.5
Bus Salvage Value 0.00 0.00 0.00 0.00 0.00 0.00 0.00 0.00 1.30 2.20 4.32 3.02 5.55 11.19 11.87 9.40 11.20 14.86 22.13 6.07 15.38
Grants for
Infrastructure Capital Costs-
GOI + GoG 16.42 32.83 32.83 49.25
130.8
1
147.2
2
195.2
9
141.9
9
129.0
5
118.1
3
993.8
0 0.00 0.00 0.00 0.00 0.00 0.00 0.00 0.00 0.00 0.00 0.00 0.00 0.00 0.00
Fleet Procurement Costs
(GOI+GoG) 0.00 0.00 0.00 0.00 0.00 17.64 34.56 24.15 44.44 89.55 94.93 75.18 89.64
118.8
7
177.0
8 48.60
123.0
7
130.4
5
113.0
5
149.7
4
198.0
5
286.7
3
126.7
3
241.9
3
247.9
8
Devolvements from UTF (D) 0.00 0.00 0.00 0.00 0.00 75.00 80.25 85.87 91.88 98.31
105.1
9
112.5
5
120.4
3
128.8
6
137.8
8
147.5
4
157.8
6
168.9
1
180.7
4
193.3
9
206.9
3
221.4
1
236.9
1
253.4
9
271.2
4
Total Inflows 16.42 32.83 32.83 49.25
130.8
1
251.5
8
333.3
8
319.0
9
362.5
6
464.3
3
1428.
56
473.6
2
553.7
8
654.5
8
856.4
1
773.4
5
905.3
3
977.2
1
1023.
61
1125.
54
1248.
26
1418.
43
1349.
17
1537.
75
1643.
49
Annual Cashflow -7.04 -25.53-35.98
-
118.2
9
-
226.9
2
-
207.5
9
-
236.7
9
-
180.7
4 -47.86-52.32
1001.
56 12.21 6.37 7.05 19.72 51.04 34.32 51.26 80.68 74.20
195.5
6
194.0
8
262.5
8
240.6
0
270.6
3
IRR 8.01%
Use Excel formula to calculate IRR
=IRR(D25:AB25,0.1) = IRR (select the total annual cash flow)
COST BENEFIT ANALYSIS
 Cost-Benefit Analysis (CBA) estimates and totals up
the equivalent money value of the benefits and costs
to the community of projects to establish whether
they are worthwhile.
 Main measure of cost and benefit – is difference in
costs and benefits ‘with’ and ‘without’ projectcosts and benefits ‘with’ and ‘without’ project
 What level of output would be with the project and
what they would have been without it
 Economic Cost: The cost in economic terms means
the cost of the resource actually forgone, free from
the effect of taxes, subsidy
(factor-0.85)
STEPS INVOLVED IN A FINANCIAL
APPRAISAL OF A PROJECT
(i) A forecast of demand,
(ii) Estimation of financial costs; capital and
annual maintenance/recurring cost
(iii) Estimation of benefits on the basis of(iii) Estimation of benefits on the basis of
forecasted future traffic and
(iv) Comparison of costs and benefits for
assessing viability.
COST BENEFIT ANALYSIS of MRTS
PROJECT
• Basics involve traffic projection, estimation of costs, benefits and
conducting appraisal using ‘with’ and ‘without’ approach.
• Cost streams
 Capital cost- civil works, rolling stock, signaling, interest
(current lending rate), construction of bus way, buses
 Operating costs-metro, bus way, existing buses/private Operating costs-metro, bus way, existing buses/private
vehicle that will continue even after MRTS.
• Benefit items
 Capital and operating cost of traffic if MRTS is not taken up
This become benefit (as this is not incurred after MRTS)
 Saving due to decongestion
 Saving in travel time
 Saving in petrol/ diesel consumption
• IRR/EIRR
DECISION RULES
• NPV - Accept all projects with a positive NPV when
discounted at a rate reflecting the opportunity cost
of capital.
(Shouldn’t use NPV alone, club it with IRR)
• IRR - Accept all projects with an IRR reflecting the• IRR - Accept all projects with an IRR reflecting the
opportunity cost of capital.
• B/C - Accept all projects with a ratio (gross
benefit/Above 1.00 when discounted at a gross
costs) rate reflecting the opportunity cost of
capital.

Financial appraisal

  • 1.
    Subject: FINANCIAL APPRAISAL Subject: URBAN FINANCE DhwaniShah, Assistant Professor Bhaikaka Centre for Human Settlements, APIED, Vallabh Vidyanagar. Date- 17/12/2015
  • 2.
    TYPES OF APPRAISAL Market Appraisal - Potential market, Location and accessibility of consumer  Technical Appraisal - Technical Viability, Operating at optimum level?  Financial Appraisal - Profitability, NPV, IRR, pay back Financial Appraisal - Profitability, NPV, IRR, pay back period, Level of Risk etc  Socio-Economic Appraisal - Social Cost benefits, level of savings in society  Ecological Appraisal - Impact of the project on quality of Air, Water, Noise, Vegetation, Human life. Likely Damage and the cost of restoration eg. Industries
  • 3.
    FINANCIAL APPRAISAL The FinancialAppraisal test demonstrates- methods for analyzing and evaluating a range of fictional accounting ratios and other commercial data to enable the candidate tocommercial data to enable the candidate to assess the potential risks and returns of applications and to make preliminary recommendations on whether or not to advance funds.
  • 4.
    WHY NECESSARY? • Mainproblem– unlimited wants/limited resources. • Judicious decision required – how much to invest/where to invest/when to invest ininvest/where to invest/when to invest in each sector of economy to achieve highest growth of economy. • All sectors are required to be developed at minimum cost while achieving highest overall economic growth
  • 5.
    INVESTMENT CRITERIA To investigateefficiency and profitability of investment in a project. Two Categories of Investment Criteria are used : i. Non- Discounting Cash Flow Methodsi. Non- Discounting Cash Flow Methods ii. Discounting Cash Flow Methods (DCF method)
  • 6.
    NON- DISCOUNTING CASHFLOW METHODS • Pay back period • Rate of Return • Annual Equivalent Method• Annual Equivalent Method
  • 7.
    PAY BACK PERIOD oTime in years, necessary to accumulate from annual cash flow (cash receipts minus cash payments – but not depreciation) – an amount equal to initial investment. o Simple – but ignores time value of money.
  • 8.
    RATE OF RETURN oExpresses profit as percentage of Capital employed. o Relates average annual expected incomeo Relates average annual expected income to total initial investment. o Both Pay back period and ROR are popular in private industry.
  • 9.
    ANNUAL EQUIVALENT METHOD Totalcost is converted into total annual amounts by replacing the investment cost with an annual equivalent cost, adding annual operating cost, and getting the ratioannual operating cost, and getting the ratio between the annual benefits and the total annual cost.
  • 10.
    DISCOUNTING CASH FLOWMETHODS  Concept: Taking time value of money Rs. 100 today at 10% annual interest would be Rs. 110/- after a year, Rs. 121/- after 2 years , Rs. 133/- after 3 years  Techniques: • Net Present Values (NPV) • Internal Rate of Return • Benefit/Cost Ratio.
  • 11.
    CASH FLOW The totalamount of money being transferred into and out of a business. Year 2012 2013 2014 2015 2016 Outflows Infrastructure Capital Costs 139.05 324.27 382.07 450.74 340.25 Infrastructure O&M Costs 28.5 33.5 43.1 52.0 57.5 Fleet Procurement Costs 0.0 0.0 22.0 43.2 30.2 Bus O&M Costs 11.4 23.0 68.5 Other System Costs 0.6 1.2 3.4 Total Outflows 167.53 357.72 459.16 570.17 499.83Total Outflows 167.53 357.72 459.16 570.17 499.83 Inflows Fare Revenue pa (Rs crore) 11.0 21.8 62.7 Indirect Revenue 0.8 1.5 4.4 Bus Salvage Value 0.00 0.00 0.00 0.00 Grants for Infrastructure Capital Costs- GOI + GoG 49.25 130.81 147.22 195.29 141.99 Fleet Procurement Costs (GOI+GoG) 0.00 0.00 17.64 34.56 24.15 Devolvements from UTF (D) 0.00 0.00 75.00 80.25 85.87 Total Inflows 49.25 130.81 251.58 333.38 319.09 Annual Cashflow -118.29 -226.92 -207.59 -236.79 -180.74
  • 12.
    PRESENT VALUE (PV) The value in the present of a sum of money, in contrast to some future value it will have when it has been invested at compound interest.  PV = FV / (1+r)n  PV is Present Value  FV is Future Value  r is the interest rate (as a decimal, so 0.10, not 10%)  n is the number of years
  • 13.
    instead of "adding10%" to each year it is easier to multiply by 1.10 Future Back to Now: what money in the future is worth now, go backwards (dividing by 1.10 each year instead of multiplying):
  • 14.
    Examples: 1) Sam promisesyou $500 next year, what is the Present Value? (r=10%) To take a future payment backwards one year divide by 1.10 So $500 next year is $500 ÷ 1.10 = $454.55 now The Present Value is $454.55 PV = FV / (1+r)n 2) Alex promises you $900 in 3 years, what is the Present Value? (r=10%) To take a future payment backwards three years divide by 1.10 three times So $900 in 3 years is: $900 ÷ 1.10 ÷ 1.10 ÷ 1.10 $900 ÷ (1.10 × 1.10 × 1.10) $900 ÷ (1.10)^3 $900 ÷ 1.331 $676.18 now
  • 15.
    NET PRESENT VALUE Net Present Value (NPV) is the difference between the present value of cash inflows and the present value of cash outflows. NPV is used in capital budgeting to analyze the profitability of a projected investment or project.of a projected investment or project.  NPV = ∑ {Future Value/(1+r)^n} - Initial Investment where r is the rate of return and n is the number of time periods.
  • 16.
    Example:  Assume acompany wants to analyze the predicted profitability of a project that requires an initial outlay of $10,000. Over the course of three years, the project is expected to generate revenues of $2,000, $7,000 and $11,000, respectively. The anticipated discount rate is 4.5%. At first glance, it seems the returns are nearly double the investment. However, a dollar earned in three years is not as valuable as a dollar earned today, so the company's accountant calculates the NPV as follows tocompany's accountant calculates the NPV as follows to determine profitability while accounting for the discounted time value of the projected revenues:  NPV = ∑ {Future Value/(1+r)^n} - Initial Investment = {$2,000/(1+.045)^1} + {$7,000/(1+.045)^2} + {$11,000/(1+.045)^3} - $10,000 = $1,913.88 + $6,410.11 + $9,639.26 - $10,000 = $7,963.25
  • 17.
    INTERNAL RATE OFRETURN  The IRR is the interest rate, also called the discount rate, that is required to bring the net present value (NPV) to zero. That is, the interest rate that would result in the present value of the capital investment, or cash outflow, being equal to the value of the total returns over time, or cashto the value of the total returns over time, or cash inflow.  NPV= ∑ {FV/ (1+r)^n} - Initial Investment where r is the interest rate and n is the number of time periods. IRR is calculated using the NPV formula by solving for r if the NPV equals zero.
  • 18.
    Year 2009 20102011 2012 2013 2014 2015 2016 2017 2018 2019 2020 2021 2022 2023 2024 2025 2026 2027 2028 2029 2030 2031 2032 2033 Outflows Infrastructure Capital Costs 23.45 46.90 46.90 139.0 5 324.2 7 382.0 7 450.7 4 340.2 5 184.3 5 168.7 5 0.00 0.00 0.00 0.00 0.00 0.00 0.00 0.00 0.00 0.00 0.00 0.00 0.00 0.00 0.00 Infrastructure O&M Costs 0.0 11.5 21.9 28.5 33.5 43.1 52.0 57.5 65.8 66.0 65.7 72.6 83.0 83.3 82.9 91.7 104.8 105.1 104.7 115.7 0.0 0.0 0.0 0.0 0.0 Fleet Procurement Costs 0.0 0.0 0.0 0.0 0.0 22.0 43.2 30.2 55.5 111.9 118.7 94.0 112.0 148.6 221.3 60.7 153.8 163.1 141.3 187.2 247.6 358.4 158.4 302.4 310.0 Bus O&M Costs 11.4 23.0 68.5 99.8 161.9 231.1 280.8 335.6 395.9 507.0 542.9 583.2 626.4 663.7 712.8 766.8 824.7 884.0 947.4 1012. 3 Other System Costs 0.6 1.2 3.4 5.0 8.1 11.6 14.0 16.8 19.8 25.4 27.1 29.2 31.3 33.2 35.6 38.3 41.2 44.2 47.4 50.6 Total Outflows 23.45 58.36 68.81 167.5 3 357.7 2 459.1 6 570.1 7 499.8 3 410.4 2 516.6 5 427.0 0 461.4 1 547.4 0 647.5 2 836.6 9 722.4 2 871.0 1 925.9 5 942.9 3 1051. 35 1052. 70 1224. 35 1086. 59 1297. 15 1372. 85 Inflows Fare Revenue pa (Rs crore) 11.0 21.8 62.7 90.8 148.0 219.3 267.2 320.0 378.2 502.0 536.7 578.4 623.0 671.0 722.4 777.6 836.9 900.4 968.5 1036. 3 Indirect Revenue 0.8 1.5 4.4 6.4 10.4 15.3 18.7 22.4 26.5 35.1 37.6 40.5 43.6 47.0 50.6 54.4 58.6 63.0 67.8 72.5 Bus Salvage Value 0.00 0.00 0.00 0.00 0.00 0.00 0.00 0.00 1.30 2.20 4.32 3.02 5.55 11.19 11.87 9.40 11.20 14.86 22.13 6.07 15.38 Grants for Infrastructure Capital Costs- GOI + GoG 16.42 32.83 32.83 49.25 130.8 1 147.2 2 195.2 9 141.9 9 129.0 5 118.1 3 993.8 0 0.00 0.00 0.00 0.00 0.00 0.00 0.00 0.00 0.00 0.00 0.00 0.00 0.00 0.00 Fleet Procurement Costs (GOI+GoG) 0.00 0.00 0.00 0.00 0.00 17.64 34.56 24.15 44.44 89.55 94.93 75.18 89.64 118.8 7 177.0 8 48.60 123.0 7 130.4 5 113.0 5 149.7 4 198.0 5 286.7 3 126.7 3 241.9 3 247.9 8 Devolvements from UTF (D) 0.00 0.00 0.00 0.00 0.00 75.00 80.25 85.87 91.88 98.31 105.1 9 112.5 5 120.4 3 128.8 6 137.8 8 147.5 4 157.8 6 168.9 1 180.7 4 193.3 9 206.9 3 221.4 1 236.9 1 253.4 9 271.2 4 Total Inflows 16.42 32.83 32.83 49.25 130.8 1 251.5 8 333.3 8 319.0 9 362.5 6 464.3 3 1428. 56 473.6 2 553.7 8 654.5 8 856.4 1 773.4 5 905.3 3 977.2 1 1023. 61 1125. 54 1248. 26 1418. 43 1349. 17 1537. 75 1643. 49 Annual Cashflow -7.04 -25.53-35.98 - 118.2 9 - 226.9 2 - 207.5 9 - 236.7 9 - 180.7 4 -47.86-52.32 1001. 56 12.21 6.37 7.05 19.72 51.04 34.32 51.26 80.68 74.20 195.5 6 194.0 8 262.5 8 240.6 0 270.6 3 IRR 8.01% Use Excel formula to calculate IRR =IRR(D25:AB25,0.1) = IRR (select the total annual cash flow)
  • 19.
    COST BENEFIT ANALYSIS Cost-Benefit Analysis (CBA) estimates and totals up the equivalent money value of the benefits and costs to the community of projects to establish whether they are worthwhile.  Main measure of cost and benefit – is difference in costs and benefits ‘with’ and ‘without’ projectcosts and benefits ‘with’ and ‘without’ project  What level of output would be with the project and what they would have been without it  Economic Cost: The cost in economic terms means the cost of the resource actually forgone, free from the effect of taxes, subsidy (factor-0.85)
  • 20.
    STEPS INVOLVED INA FINANCIAL APPRAISAL OF A PROJECT (i) A forecast of demand, (ii) Estimation of financial costs; capital and annual maintenance/recurring cost (iii) Estimation of benefits on the basis of(iii) Estimation of benefits on the basis of forecasted future traffic and (iv) Comparison of costs and benefits for assessing viability.
  • 21.
    COST BENEFIT ANALYSISof MRTS PROJECT • Basics involve traffic projection, estimation of costs, benefits and conducting appraisal using ‘with’ and ‘without’ approach. • Cost streams  Capital cost- civil works, rolling stock, signaling, interest (current lending rate), construction of bus way, buses  Operating costs-metro, bus way, existing buses/private Operating costs-metro, bus way, existing buses/private vehicle that will continue even after MRTS. • Benefit items  Capital and operating cost of traffic if MRTS is not taken up This become benefit (as this is not incurred after MRTS)  Saving due to decongestion  Saving in travel time  Saving in petrol/ diesel consumption • IRR/EIRR
  • 22.
    DECISION RULES • NPV- Accept all projects with a positive NPV when discounted at a rate reflecting the opportunity cost of capital. (Shouldn’t use NPV alone, club it with IRR) • IRR - Accept all projects with an IRR reflecting the• IRR - Accept all projects with an IRR reflecting the opportunity cost of capital. • B/C - Accept all projects with a ratio (gross benefit/Above 1.00 when discounted at a gross costs) rate reflecting the opportunity cost of capital.