2
Capital Budget
Capital budgetis the budget of capital expenditures.
Capital Expenditures are those expenditures whose
benefit spread in number of years e.g., purchase of
Plant and Machinery , Land and building and starting
a new factory plant etc.
3.
3
CAPITAL BUDGETING
Capital budgeting:is the planning process for
allocating all expenditures that will have an expected
benefit to the firm for more than one year.
4.
4
Investment Appraisal
Firms normallyplace projects in the following categories:
• Replacement and maintenance of old or damaged
equipment.
• Investments to upgrade or replace existing equipment
• Marketing investments to expand product lines or
distribution facilities.
• Investments for complying with government or
5.
5
OVERALL AIM
To maximiseshareholders wealth..
Projects should give a return over and above the marginal
weighted average cost of capital.
Projects can be;
Mutually exclusive
Independent
6.
6
IDEAL SELECTION
METHOD
• Selectthe project that maximises shareholders wealth
• Consider all cash flows
• Discount the cash flows at the appropriate market
determined opportunity cost of capital
7.
7
Need for InvestmentAppraisal
• Large amount of resources are involved and wrong
decisions could be costly
• Difficult and expensive to reverse
• Investment decisions can have a direct impact on the
ability of the organisation to meet its objectives
8.
8
Investment Appraisal Process
Stages:
•identify objectives. What is it? Within the corporate
objectives?
• Identify alternatives.
• Collect and analyse data. Examine the technical and
economic feasibility of the project, cash flows etc.
9.
9
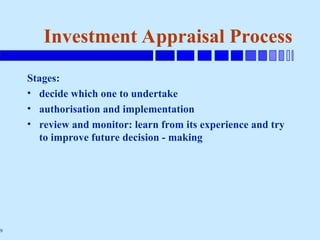
Investment Appraisal Process
Stages:
•decide which one to undertake
• authorisation and implementation
• review and monitor: learn from its experience and try
to improve future decision - making
10.
10
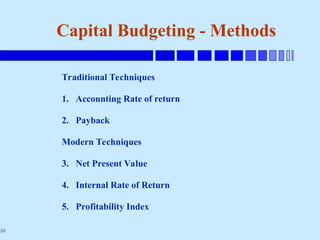
Capital Budgeting -Methods
Traditional Techniques
1. Accounting Rate of return
2. Payback
Modern Techniques
3. Net Present Value
4. Internal Rate of Return
5. Profitability Index
11.
11
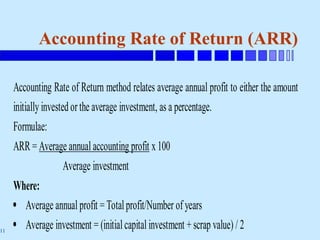
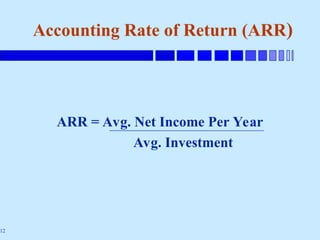
Accounting Rate ofReturn (ARR)
Accounting Rate of Return method relates average annual profit to either the amount
initiallyinvestedorthe average investment, as a percentage.
Formulae:
ARR = Average annual accounting profit x 100
Average investment
Where:
Average annual profit = Totalprofit/Number of years
Average investment = (initialcapital investment +scrap value) / 2
13
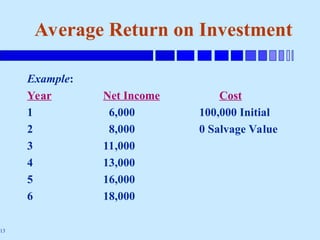
Average Return onInvestment
Example:
Year Net Income Cost
1 6,000 100,000 Initial
2 8,000 0 Salvage Value
3 11,000
4 13,000
5 16,000
6 18,000
14.
14
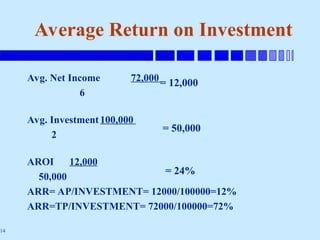
Avg. Net Income72,000
6
Avg. Investment100,000
2
AROI 12,000
50,000
ARR= AP/INVESTMENT= 12000/100000=12%
ARR=TP/INVESTMENT= 72000/100000=72%
Average Return on Investment
= 12,000
= 24%
= 50,000
15.
15
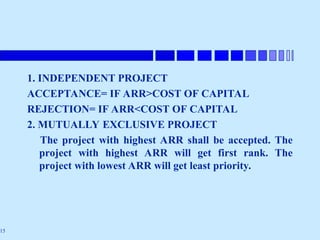
1. INDEPENDENT PROJECT
ACCEPTANCE=IF ARR>COST OF CAPITAL
REJECTION= IF ARR<COST OF CAPITAL
2. MUTUALLY EXCLUSIVE PROJECT
The project with highest ARR shall be accepted. The
project with highest ARR will get first rank. The
project with lowest ARR will get least priority.
17
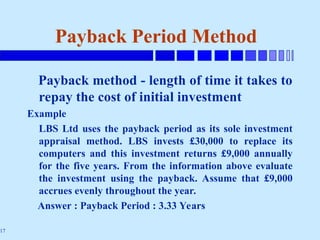
Payback Period Method
Paybackmethod - length of time it takes to
repay the cost of initial investment
Example
LBS Ltd uses the payback period as its sole investment
appraisal method. LBS invests £30,000 to replace its
computers and this investment returns £9,000 annually
for the five years. From the information above evaluate
the investment using the payback. Assume that £9,000
accrues evenly throughout the year.
Answer : Payback Period : 3.33 Years
18.
18
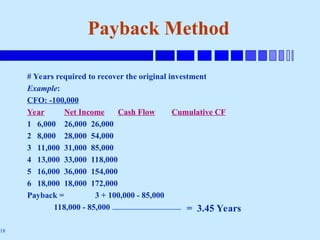
Payback Method
# Yearsrequired to recover the original investment
Example:
CFO: -100,000
Year Net Income Cash Flow Cumulative CF
1 6,000 26,000 26,000
2 8,000 28,000 54,000
3 11,000 31,000 85,000
4 13,000 33,000 118,000
5 16,000 36,000 154,000
6 18,000 18,000 172,000
Payback = 3 + 100,000 - 85,000
118,000 - 85,000 = 3.45 Years
22
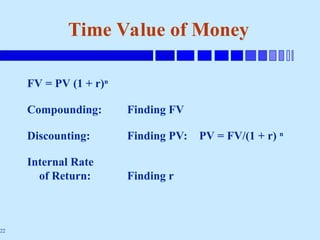
Time Value ofMoney
FV = PV (1 + r)n
Compounding: Finding FV
Discounting: Finding PV: PV = FV/(1 + r) n
Internal Rate
of Return: Finding r
23.
23
Definitions
• Present value:-the amount of money you must invest
or lend at the present time so as to end up with a
particular amount of money in the future.
• Discounting: -finding the present value of a future cash
flow
24.
24
Net Present Value
•Net Present Value (NPV) - the difference between the
present values of cash inflows and outflows of an
investment
• Opportunity cost of undertaking the investment is the
alternative of earning interest rate in the financial
market.
• NPV is the difference between PV of cash inflows
minus Cash Outflows
26
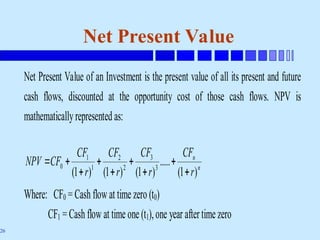
Net Present Value
NetPresent Value of an Investment is the present value of all its present and future
cash flows, discounted at the opportunity cost of those cash flows. NPV is
mathematicallyrepresented as:
n
n
r
CF
r
CF
r
CF
r
CF
CF
NPV
)
1
(
.....
)
1
(
)
1
(
)
1
( 3
3
2
2
1
1
0
Where: CF0 = Cash flow at time zero (t0)
CF1 = Cash flow at time one (t1),one year aftertime zero
27.
27
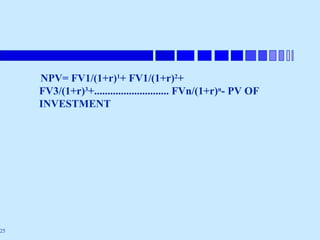
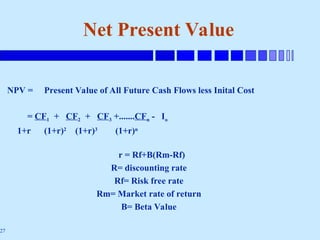
Net Present Value
NPV= Present Value of All Future Cash Flows less Inital Cost
= CF1 + CF2 + CF3 +.......CFn - Io
1+r (1+r)2
(1+r)3
(1+r)n
r = Rf+B(Rm-Rf)
R= discounting rate
Rf= Risk free rate
Rm= Market rate of return
B= Beta Value
28.
28
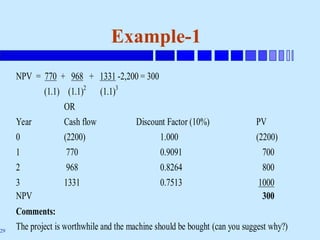
Example-1
A company canpurchase a machine at the
price of £2200. The machine has a productive
life of three years and the net additions to cash
inflows at the end of each of the three years are
£770, £968 and £1331. The company can buy
the machine without having to borrow and the
best alternative is investment elsewhere at an
interest rate of 10%.
Evaluate the project using the
a) Net present value method.
b) Internal rate of return
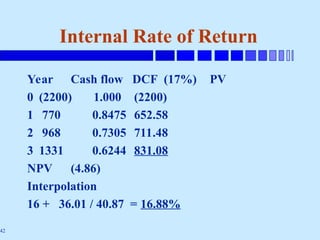
29.
29
Example-1
NPV = 770+ 968 + 1331 -2,200 = 300
(1.1) (1.1)2
(1.1)3
OR
Year Cash flow Discount Factor (10%) PV
0 (2200) 1.000 (2200)
1 770 0.9091 700
2 968 0.8264 800
3 1331 0.7513 1000
NPV 300
Comments:
The project is worthwhile and the machine should be bought (can you suggest why?)
30.
30
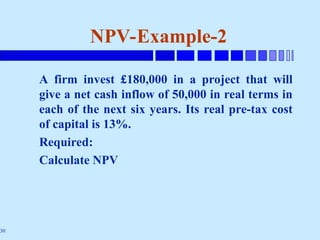
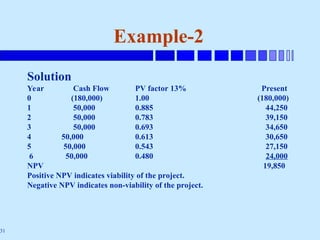
NPV-Example-2
A firm invest£180,000 in a project that will
give a net cash inflow of 50,000 in real terms in
each of the next six years. Its real pre-tax cost
of capital is 13%.
Required:
Calculate NPV
34
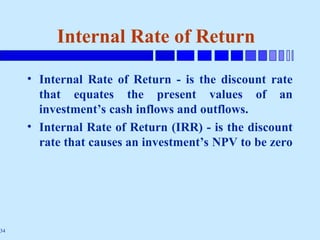
Internal Rate ofReturn
• Internal Rate of Return - is the discount rate
that equates the present values of an
investment’s cash inflows and outflows.
• Internal Rate of Return (IRR) - is the discount
rate that causes an investment’s NPV to be zero
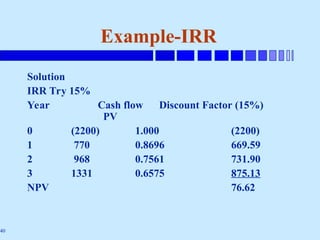
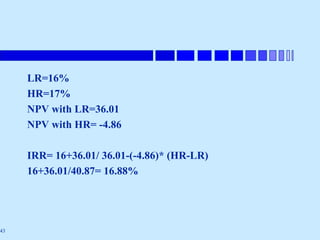
35.
35
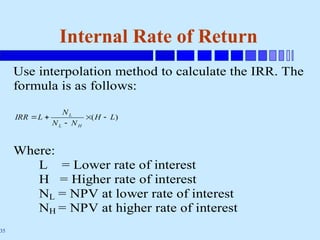
Internal Rate ofReturn
Use interpolation method to calculate the IRR. The
formula is as follows:
)
( L
H
N
N
N
L
IRR
H
L
L
Where:
L = Lower rate of interest
H = Higher rate of interest
NL = NPV at lower rate of interest
NH = NPV at higher rate of interest
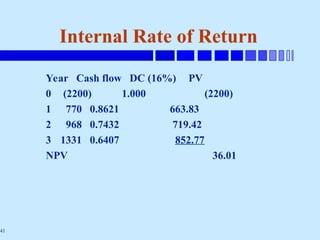
36.
36
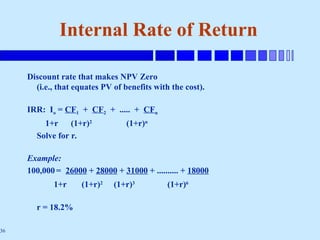
Internal Rate ofReturn
Discount rate that makes NPV Zero
(i.e., that equates PV of benefits with the cost).
IRR: Io = CF1 + CF2 + ..... + CFn
1+r (1+r)2
(1+r)n
Solve for r.
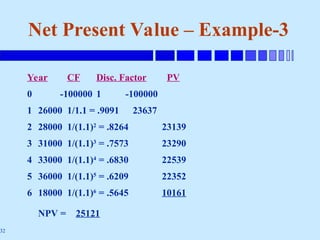
Example:
100,000= 26000 + 28000 + 31000 + .......... + 18000
1+r (1+r)2
(1+r)3
(1+r)6
r = 18.2%
37.
37
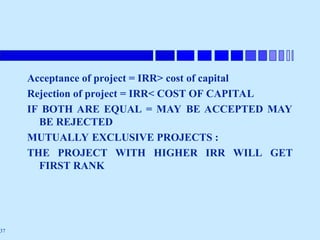
Acceptance of project= IRR> cost of capital
Rejection of project = IRR< COST OF CAPITAL
IF BOTH ARE EQUAL = MAY BE ACCEPTED MAY
BE REJECTED
MUTUALLY EXCLUSIVE PROJECTS :
THE PROJECT WITH HIGHER IRR WILL GET
FIRST RANK
44
Profitability Index
What DoesProfitability Index Mean?
An index that attempts to identify the relationship
between the costs and benefits of a proposed project
through the use of a ratio calculated as:
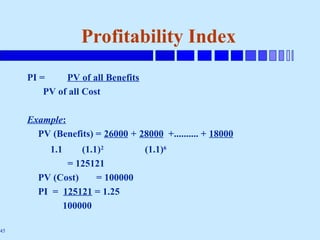
45.
45
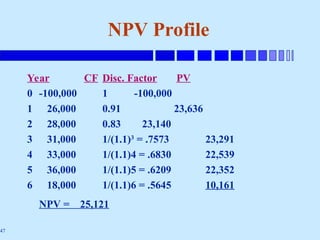
Profitability Index
PI =PV of all Benefits
PV of all Cost
Example:
PV (Benefits) = 26000 + 28000 +.......... + 18000
1.1 (1.1)2
(1.1)6
= 125121
PV (Cost) = 100000
PI = 125121 = 1.25
100000
52
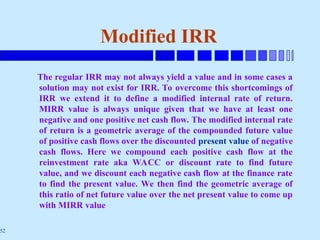
Modified IRR
The regularIRR may not always yield a value and in some cases a
solution may not exist for IRR. To overcome this shortcomings of
IRR we extend it to define a modified internal rate of return.
MIRR value is always unique given that we have at least one
negative and one positive net cash flow. The modified internal rate
of return is a geometric average of the compounded future value
of positive cash flows over the discounted present value of negative
cash flows. Here we compound each positive cash flow at the
reinvestment rate aka WACC or discount rate to find future
value, and we discount each negative cash flow at the finance rate
to find the present value. We then find the geometric average of
this ratio of net future value over the net present value to come up
with MIRR value
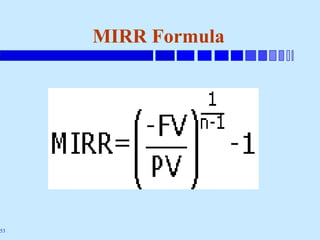
54
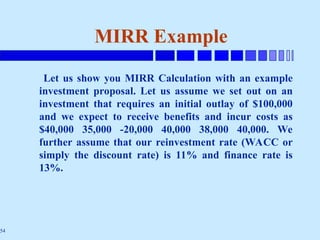
MIRR Example
Let usshow you MIRR Calculation with an example
investment proposal. Let us assume we set out on an
investment that requires an initial outlay of $100,000
and we expect to receive benefits and incur costs as
$40,000 35,000 -20,000 40,000 38,000 40,000. We
further assume that our reinvestment rate (WACC or
simply the discount rate) is 11% and finance rate is
13%.
55.
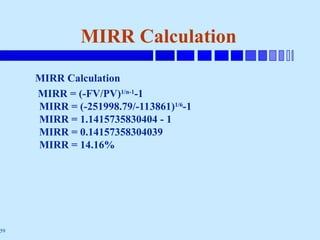
55
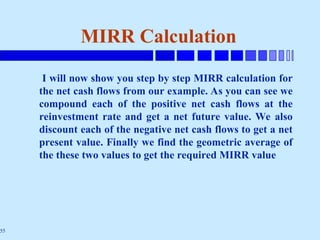
MIRR Calculation
I willnow show you step by step MIRR calculation for
the net cash flows from our example. As you can see we
compound each of the positive net cash flows at the
reinvestment rate and get a net future value. We also
discount each of the negative net cash flows to get a net
present value. Finally we find the geometric average of
the these two values to get the required MIRR value
57
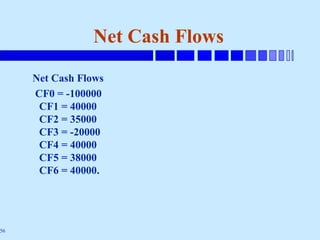
Compounded Net CashFlows at 11%
Compounded Net Cash Flows at 11%
CCF1 = 40000 x (1+11%)5 = 40000 x 1.68506 = 67402.33
CCF2 = 35000 x (1+11%)4
= 35000 x 1.51807 = 53132.46
CCF4 = 40000 x (1+11%)2
= 40000 x 1.2321 = 49284
CCF5 = 38000 x (1+11%)1
= 38000 x 1.11 = 42180
CCF6 = 40000. x (1+11%)0
= 40000. x 1 = 40000
FV = 251998.79
58.
58
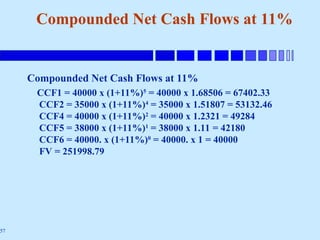
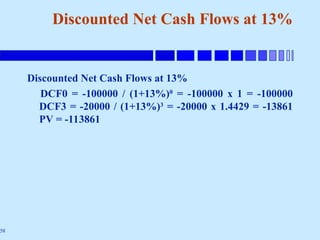
Discounted Net CashFlows at 13%
Discounted Net Cash Flows at 13%
DCF0 = -100000 / (1+13%)0
= -100000 x 1 = -100000
DCF3 = -20000 / (1+13%)3
= -20000 x 1.4429 = -13861
PV = -113861
60
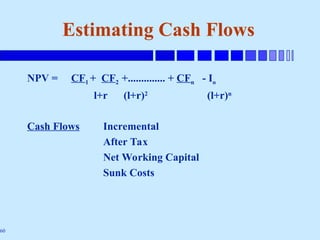
Estimating Cash Flows
NPV= CF1 + CF2 +.............. + CFn - Io
l+r (l+r)2
(l+r)n
Cash Flows Incremental
After Tax
Net Working Capital
Sunk Costs
61.
61
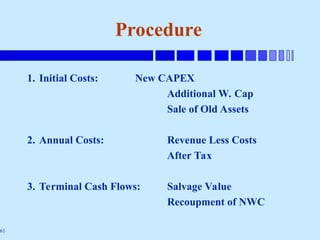
Procedure
1. Initial Costs:New CAPEX
Additional W. Cap
Sale of Old Assets
2. Annual Costs: Revenue Less Costs
After Tax
3. Terminal Cash Flows: Salvage Value
Recoupment of NWC
62.
62
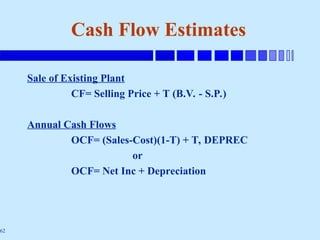
Cash Flow Estimates
Saleof Existing Plant
CF= Selling Price + T (B.V. - S.P.)
Annual Cash Flows
OCF= (Sales-Cost)(1-T) + T, DEPREC
or
OCF= Net Inc + Depreciation
63.
63
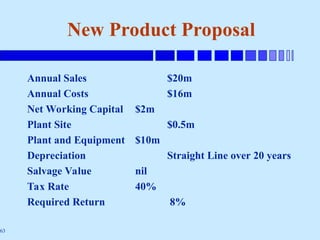
New Product Proposal
AnnualSales $20m
Annual Costs $16m
Net Working Capital $2m
Plant Site $0.5m
Plant and Equipment $10m
Depreciation Straight Line over 20 years
Salvage Value nil
Tax Rate 40%
Required Return 8%
66
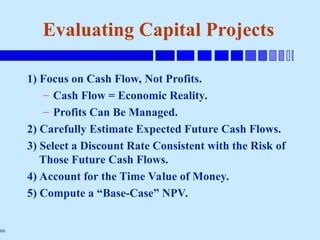
Evaluating Capital Projects
1)Focus on Cash Flow, Not Profits.
– Cash Flow = Economic Reality.
– Profits Can Be Managed.
2) Carefully Estimate Expected Future Cash Flows.
3) Select a Discount Rate Consistent with the Risk of
Those Future Cash Flows.
4) Account for the Time Value of Money.
5) Compute a “Base-Case” NPV.
67.
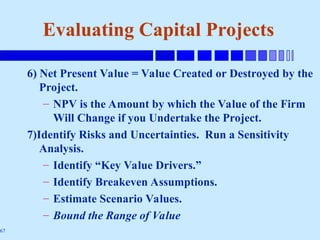
67
6) Net PresentValue = Value Created or Destroyed by the
Project.
– NPV is the Amount by which the Value of the Firm
Will Change if you Undertake the Project.
7)Identify Risks and Uncertainties. Run a Sensitivity
Analysis.
– Identify “Key Value Drivers.”
– Identify Breakeven Assumptions.
– Estimate Scenario Values.
– Bound the Range of Value
Evaluating Capital Projects


![5) capital_budgeting_(1)_-(2)[1].ppt.pdf](https://cdn.slidesharecdn.com/ss_thumbnails/5capitalbudgeting121-250323135834-146732f6-thumbnail.jpg?width=640&height=640&fit=bounds)


